


Introduction
A central question in psycholinguistics is how speakers select which variant of a structure to produce when there is more than one option (e.g., brain activation pattern vs. pattern of activation in the brain), and how listeners’ comprehension is influenced by which variant is produced. One common way of exploring this question appeals to information theory, originally put forth by Shannon (Reference Shannon1948) and developed extensively in psycholinguistic work under the notion of surprisal (Hale, Reference Hale2001; Levy, Reference Levy2008; see also Gibson et al., Reference Gibson, Futrell, Piandadosi, Dautriche, Mahowald, Bergen and Levy2019). In a nutshell, linguistic information originates in a source (speaker, writer), is encoded into symbols (spoken words, written letters) which are transmitted through a channel (sound waves, printed paper) to a receiver (listener, reader), and is communicated at an average rate (entropy). Crucially, the information contained in each symbol is modulated by predictability (i.e., how surprising the symbol is): when the symbol is predictable, it conveys a low amount of information; when it is less predictable, it conveys a higher amount of information. The core idea for psycholinguistics is that comprehenders will have more difficulty processing words or sentences that are less predictable (i.e., contain high surprisal).
Based on this idea, the Uniform Information Density (UID) hypothesis has emerged as an influential account using information theory to explain how speakers select between alternative variants of a structure (e.g., Jaeger, Reference Jaeger2010; Levy & Jaeger, Reference Levy, Jaeger, Schölkopf, Platt and Hoffman2006). Key to this hypothesis is the notion of information density – a measure of how much information is communicated per unit of signal when the predictability of this information is taken into account. The claim is that speakers aim for UID in their productions: they prefer to produce a uniform amount of information per unit of linguistic signal in constructing a message and seek to avoid “peaks” and “troughs” in the rate of information provided. The UID hypothesis thus predicts that, in general, speakers will select the longer alternative of a given structure to convey less predictable information and the shorter alternative to convey more predictable information. Figure 1 illustrates how this idea would work in sentences with an optional that introducing a new clause. In (a), an object phrase is expected but a new clause is started, causing the first word of the clause not only to carry its typical information content but also to indicate the beginning of the new clause. In this case, the inclusion of the that reduces the information contained in the first word, avoiding a peak on the amount of information transmitted per symbol. Conversely, in (b), since a clause is already expected, speakers are predicted to omit the that, avoiding the transmission of too little information per symbol. This has been shown for a number of structures including that-deletion in relative clauses (e.g., this is the friend (that) I told you about; Ferreira & Dell, Reference Ferreira and Dell2000) and optional complementizer deletion (e.g., my boss thinks (that) I’m absolutely crazy; Jaeger, Reference Jaeger2010). The UID hypothesis aims to explain an efficient communication system in which speakers “convey as much information as possible with as little signal as possible,” while balancing “the risk of transmitting too much information per time (or per signal), which increases the chance of information loss or miscommunication” (Jaeger, Reference Jaeger2010, p. 25).

Figure 1. An example of the predictions of the UID hypothesis. Speakers have been shown to prefer using that in (a), but not in (b). Reprinted from Jaeger (Reference Jaeger2010, figure 1), with permission from Elsevier.
Virtually, all research on the UID hypothesis to date has focused on speakers’ choices in production. However, a similar effect should hold in comprehension: listeners should find it easier to comprehend structures where information density is more uniform. Indeed, this must be the case – there is no point in speakers optimizing the communication channel to provide UID if this is not the preferred way for listeners to comprehend information (Piantadosi et al., Reference Piantadosi, Tily and Gibson2012). Further, most evidence for the UID hypothesis to date comes from studies of relatively local alternatives, showing the effects of information density in the omission vs. inclusion of optional words (A. F. Frank & Jaeger, Reference Frank and Jaeger2008; Jaeger, Reference Jaeger2010; Levy & Jaeger, Reference Levy, Jaeger, Schölkopf, Platt and Hoffman2006). Little evidence is as yet available showing that speakers are sensitive to UID for more complex alternative syntactic encodings.
As far as we are aware, only three studies to date have explicitly investigated the role of UID in the comprehension of more complex syntactic structures. First, Collins (Reference Collins2014) used Mechanical Turk to collect reader preferences on a number of syntactic alternations (e.g., I looked up the number vs. I looked the number up). They examined to what extent their preferences were in line with the predictions of language parsing models such as Surprisal Theory (Levy, Reference Levy2008), the UID hypothesis, and Dependency Locality Theory (DLT; Gibson, Reference Gibson, Marantz, Miyashita and O’Neil2001). They found that none of the theories was able to model the totality of their data and suggested that the UID and DLT are complementary to each other, explaining separate aspects of the parsing system. More recently, Meister et al. (Reference Meister, Pimentel, Haller, Jäger, Cotterell, Levy, Moens, Huang, Specia and Tau Yih2021) have analyzed a number of different ways in which the UID hypothesis could be operationalized. They analyzed six English corpora containing self-paced and eye-tracking reading times, as well as acceptability judgments, and found that both reading times and reader judgments were best modeled by a super-linear function of each word’s surprisal in the sentence. Importantly, this super-linear function meant that the effort is minimal when surprisal is transmitted at a constant rate, supporting the UID hypothesis. Finally, Sikos et al. (Reference Sikos, Greenberg, Drenhaus, Crocker, Gunzelmann, Howes, Tenbrink and Davelaar2017) assessed participants’ preferences for alternative syntactic encodings of noun phrases (e.g., essay that was carefully written vs. carefully written essay) under different conditions of predictability (e.g., The journalist published … vs. The man evaluated …), using the G-maze task in a self-paced reading study in German. Results indeed suggested that participants were sensitive to information density in their comprehension of variants in more complex syntax.
In the present paper, we provide further insight into the effects of syntactic variants on comprehension and its relation to the UID by investigating a different syntactic structure using the more sensitive measure of eye-tracking while reading. We focus on nominal compounds (NC) in English – a structure that denotes one unified concept but consists of a head noun modified by nouns or adjectives, as illustrated in the bolded portion of (1). In the studies reported here, we focus particularly on NCs where the head noun is modified by two or more nouns or adjectives. We contrast these with an alternative structure in which the head noun is modified by prepositional phrases (PP), as in the bolded portion of (2).
-
1. In some cases, pharmaceutical market size increase is driven by the competition in Western countries. (NC)
-
2. In some cases, increase in size of the pharmaceutical market is driven by the competition in Western countries. (PP)
Nominal compounds
NCsFootnote 1 are commonly used to convey complex concepts efficiently in a condensed form, serving as “ad hoc names” to refer to new concepts or to further refine or specify existing terms (Bartolic, Reference Bartolic, Trimble, Trimble and Drobnic1978; Bhatia, Reference Bhatia, Bouton and Kachru1992; Downing, Reference Downing1977; Montero, Reference Montero1996; Pérez Ruiz, Reference Pérez Ruiz2006; Tobin, Reference Tobin2002; Trimble, Reference Trimble1985; Varantola, Reference Varantola1984). Although relatively rare in conversation, they account for 10–15% of words in academic texts, with the frequency, complexity, and length of the NCs increasing as the level of the text gets more advanced (Biber & Gray, Reference Biber and Gray2010, Reference Biber and Gray2011; Horsella & Pérez, Reference Horsella and Pérez1991; Salager, Reference Salager, Pugh and Ulijn1984; Swales, Reference Swales1974; Williams, Reference Williams, Pugh and Ulijn1984). Their frequency has increased considerably in the scientific register in the last century (see Fig. 2). Complex NCs composed of several words are particularly relevant for the present study because, in the absence of any predictive context, they create a “peak” in information density with respect to the surrounding text in that they convey a large amount of information per unit of communication.

Figure 2. The development of the use of nouns as nominal premodifiers (i.e., forming NCs) through time. Adapted from (Biber & Gray, Reference Biber and Gray2011).
The parsing of NCs is complicated by at least three factors. First, NCs offer fewer signal units (words) than PPs to communicate the same informational content. For example, the bolded information in (1) is conveyed by four words in the NC compared to seven words in the PP equivalent. The NC lacks cues such as prepositions that elucidate the intended meaning relationships between its components.
Second, NCs in English are head-final so the reader must store the modifiers in working memory during incremental processing and can only integrate them into the parse upon reaching the head noun. Further, since each noun within the NC could potentially serve as the head (e.g., pharmaceutical market, pharmaceutical market size), the reader could potentially misanalyze the phrase at each word and cannot fully parse the NC until a verb signals its completion. In the PP variant, however, the head noun begins the noun phrase so the reader can immediately integrate the modifiers without holding them in working memory. Several theories of parsing make clear that locality – the distance between two elements that are dependent on each other – plays an important role in integration difficulty at the head (e.g., Gibson, Reference Gibson, Marantz, Miyashita and O’Neil2001; Vasishth, Reference Vasishth, Yamashita, Hirose and Packard2010).
Third, the string of words in the NC usually does not enable the reader to quickly grasp which of the large number of possible underlying syntactic and semantic relationships a particular NC conveys. Noun compounds can convey the same semantic information as a number of alternative syntactic structures and relationships (e.g., verb-argument relationships, relative clauses, prepositional phrases), but these are not evident in the NC itself (Lees, Reference Lees1960, Reference Lees, Bierwisch and Heidolph1970; Levi, Reference Levi, Corum, Smith-Stark and Weiser1973, Reference Levi1978; Limaye & Pompian, Reference Limaye and Pompian1991; Pérez Ruiz, Reference Pérez Ruiz2006; Warren, Reference Warren1978). Even the basic branching structure within longer NCs is typically not discernible without context; three-word NCs can be left-branching (e.g., health service employee), right-branching (e.g., head copy boy), or ambiguous between the two (e.g., steel bridge foundation) (Kvam, Reference Kvam1990). A wide variety of semantic relationships can also hold between words in an NC; lists of the possible relationships for two-word NCs proposed in the literature extend from four relationships (Granville Hatcher, Reference Granville Hatcher1960) to over 100 (Brekle, Reference Brekle1976). Further, many NCs are ambiguous between two or more potential semantic interpretations. For example, translator writing system could be understood as either Purpose (writing system for the translator) or Source (writing system of translators) (Montero, Reference Montero1996, p. 66). Because the syntactic and semantic relationships are not overtly expressed within the NC itself, they must be actively reconstructed online by the reader based on pragmatic and contextual information, which leads to potential processing difficulty and delay (Bauer & Tarasova, Reference Bauer and Tarasova2013; Berg, Reference Berg2016). In contrast, the additional words in PPs such as prepositions and verbs facilitate awareness of syntactic and semantic relationships during online processing.
In summary, the aforementioned literature has considered NCs from a number of different but converging perspectives strongly suggesting that NCs should be harder to process than PPs. In this paper, we assume that all these perspectives are subsumed under the notion of information density.
But are NCs really harder to process? Given the frequent use of complex NCs in academic texts combined with the potential comprehension difficulties they present, it is surprising that relatively little is known about how complex NCs are processed by readers. Most of the research on the processing of NCs has focused on two-constituent compounds and has examined compounds in isolation using tasks such as lexical decision, sense-nonsense judgment, and masked priming (e.g., Estes & Jones, Reference Estes and Jones2006; Gagné & Shoben, Reference Gagné and Shoben1997; Gagné & Spalding, Reference Gagné and Spalding2009; Schmidtke et al., Reference Schmidtke, Kuperman, Gagné and Spalding2016). Only a few studies have looked at longer compounds (e.g., de Almeida & Libben, Reference de Almeida and Libben2005; Inhoff et al., Reference Inhoff, Radach and Heller2000; Krott et al., Reference Krott, Libben, Jarema, Dressler, Schreuder and Baayen2004) or at compounds in actual sentences (e.g., Kuperman et al., Reference Kuperman, Bertram and Baayen2008), but not from the point of view of information density. Several off-line behavioral studies with longer NCs have shown that there is a considerable error and lack of consistency across individuals in paraphrasing NCs (e.g., Geer et al., Reference Geer, Gleitman and Gleitman1972; Gleitman & Gleitman, Reference Gleitman and Gleitman1970; Olshtain, Reference Olshtain, Hines and Rutherford1981; Williams, Reference Williams, Pugh and Ulijn1984), selecting appropriate definitions for NCs (e.g., Gleitman & Gleitman, Reference Gleitman and Gleitman1970; Limaye & Pompian, Reference Limaye and Pompian1991), and translating NCs to other languages (e.g., Carrió Pastor, Reference Carrió Pastor2008; Carrió Pastor & Candel Mora, Reference Carrió Pastor and Candel Mora2013). Overall, this literature strongly suggests that NCs are challenging to process, but provides no information about the comprehension of these constructions in real time. Further, none of these studies has focused directly on information density, comparing the processing of NCs to other less dense structures.
The present studyFootnote 2
Therefore, in the studies reported here, we examine the processing of NCs vs. PPs in real time using eye-tracking while reading, in the absence of any preceding context that would allow the meaning of the critical segment to be predicted. We report two separate experiments in English where L1 participants read sentences containing NCs and PPs of different lengths. In the first experiment, sentences contained critical structures (NC or PP) of lengths 4 and 6. In the second, which controls for a number of limitations identified from Experiment 1, shorter critical structures of lengths 3 and 4 were used.
We predict that participants will experience more processing difficulty with the informationally dense structure (NC) than with the less dense structure containing roughly the same total information content (PP). Since the target structures vary considerably in length, we do not measure the time participants spend looking directly at them, but instead operationalize this difficulty in two indirect ways. First, we count the number of times participants regress towards the critical structure (i.e., toward the NC or the PP), predicting a higher number of regressions in sentences containing NCs (vs. PPs) and longer structures (6 vs. 4 words in Experiment 1, 4 vs. 3 words in Experiment 2). Second, we measure the time participants spend looking at the text segments following the critical structure, in a fashion similar to other studies in the eye-tracking literature (e.g., Christianson et al., Reference Christianson, Luke, Hussey and Wochna2017; Jared & O’Donnell, Reference Jared and O’Donnell2017; Paape & Vasishth, Reference Paape and Vasishth2022; Pickering & Traxler, Reference Pickering and Traxler1998). Since these (subsequent) text segments do not change between conditions, we can say that, if participants gaze for a significantly different amount of time in one condition, then this can only be attributed to the experimental manipulation of the critical structures preceding them. In order to evaluate the time course of this processing difficulty, we extract eye-tracking measures from the data reflecting both early and late effects, and predict that participants will spend more time looking at the segments following the critical segment after reading an NC than after reading a PP and after reading a longer structure than after reading a shorter structure. Since no other study has used eye-tracking to investigate online NC processing, and in an attempt to be statistically conservative, we a priori selected one early and one late reading measure.
Experiment 1
Method
Participants
Participants were 31 L1 English speakers recruited from the communities of the University of Alberta (Canada) and the Technische Universität Kaiserslautern (Germany). One participant was excluded from the analysis due to exceptionally noisy eye-tracking data (see “Eye-movement analysis” below). We report below the data of the remaining 30 participants (mean age: 25.2, SD: 8.31). No participants were exposed to a second language before the age of 5 years and did not regularly use any other language in their daily life. All had normal or corrected-to-normal vision. Participants were compensated with payment or course credit.
Materials
Eye-tracking reading task
Participants read sentences containing either a nominal compound (NC) or the same noun phrase in the form of a head noun followed by prepositional phrases (PP). The number of content words in the NC/PP was manipulated: there were 12 critical items containing four (4) content words, and 12 critical items containing six (6) content words. The relationship between the ordering of the content words in the NC and in its corresponding PP was always the same. For 4-length items, the NC order was N1-N2-N3-N4, while the PP order was N4-P-N3-P-N1-N2. For 6-length items, the NC order was N1-N2-N3-N4-N5-N6 and the PP order was N6-P-N5-P-N3-N4-P-N1-N2. The 4-length and 6-length items were completely different, that is, there is no overlap between the words used in 4-length and in 6-length items. The variables Phrase Type (NC vs. PP) and Length (4 vs. 6) were combined to yield four conditions (see Table 1 for example items; see full set of critical items in Appendix A). In order to reduce cognitive load, and in order to ensure that the materials were equally familiar for all participants, the sentence content was kept theme constant, always focused on economics and business (none of the participants were studying economics).
Table 1. Example sentences for each experimental condition in Experiment 1

The critical sentences were composed of five regions (see Table 1): a preamble containing three words and ending with a comma; a critical region containing either an NC with 4 or 6 words or an equivalent PP; a passive construction (ROI1) composed of the auxiliary “is” or “are” and a participle; the agent of the passive construction (ROI2) containing a single noun and introduced by “by the”; a final “wrap up” region. The critical segment was positioned early in the sentence to avoid influence of any preceding context on comprehension. The number of characters and syllables in the content words of the NC and PP was controlled (see Supplementary Materials). The introductory phrase and critical segment were on the first line and the other three segments on the second line (see Fig. 3 for a reconstruction of how the items were presented on the screen).

Figure 3. An example trial reconstructed from the data collected in Experiment 1. (The reconstruction’s font size does not reflect the exact font size of stimulus presentation – note the varying distance between words.) The boxes around each word indicate the interest area associated with that word: fixations inside a given interest areas are treated as fixations on its word. The boxes and the indication of the sentence regions were not visible to readers during the experiment.
Oxford Placement Test Part 1 (OPT)
Participants’ English proficiency was assessed using the OPT. It consisted of a series of sentences containing 50 gaps at which three possible completions were presented and only one was grammatically correct. The participant’s task was to choose the correct option.
Language Background Questionnaire (LBQ)
In order to ensure that participants were native speakers, they also filled out a language background questionnaire responding to questions about the languages they speak, the situations in which they use them, how well they are able to use them, and the people with whom they use them.
Digit span test (DST)
We assessed participants’ working memory using a digit span test (WM; see Wambach et al., Reference Wambach, Lamar, Swenson, Penney, Kaplan, Libon, Kreutzer, DeLuca and Caplan2011). Participants saw sequences progressing from 2 to 9 digits and had to recall the correct order for at least two sequences of a given length to advance to the next length. A participant’s final digit span was the longest length for which they correctly answered at least two sequences. (see Supplementary Materials).
Design
The task consisted of 68 trials: 4 practice trials, 24 critical items (12 of each length), and 40 fillers. The fillers had similar syntactic complexity and length to the critical sentences, but did not contain any NCs longer than two words. The design is partially factorial: phrase type (NC vs. PP) was manipulated within participant and within item, and length (4-length vs. 6-length) was manipulated within participant and between items. We additionally consider the interaction between type and length (see “Eye-movement analysis” below for details). The NC and PP versions of the twelve 4-length and the twelve 6-length critical items were separately assigned to two counterbalanced lists, such that each list contained six NC and six PP variants of each length. The presentation order was randomized per participant. After each item, a comprehension question was displayed, and the participant pressed the letters X or M to answer. Questions after critical items probed the head noun (see Table 1).
Apparatus
Stimulus presentation was programmed with the Experiment Builder software from SR Research, and eye movements were recorded with an Eyelink 1000, sampling at 1000 Hz. The eye tracker recorded movements from the right eye, though presentation was binocular. Participants viewed the stimuli on a color monitor at a resolution of 1280 × 1024 and a distance of approximately 100 cm, using a chin rest to stabilize their head. The sentences were presented using the font Courier New. Eyes were calibrated and validated at the beginning of the study, halfway through, and as needed throughout the study.
Procedure
After giving informed consent, participants completed four tasks in the following order: the Oxford Placement Test Part A (OPT; Allan, Reference Allan2006) assessing English proficiency, a language background questionnaire, the DST, and the eye-tracking task. For the eye-tracking task, participants were informed that they would read English sentences from economics texts while having their eye movements recorded, and after each sentence, they would have to answer a question about the sentence they just read. They were also presented with written instructions on the screen and given the chance to ask questions. The eye tracker was then calibrated, and the participant read the four practice trials. If needed, a new calibration was then performed. Finally, the two blocks of 34 sentences each were presented. Each item started with a drift correct that corresponded to the sentence’s first letter. After reading the sentence, participants pressed the spacebar to advance to the comprehension question. Participants were told to read normally with no time limit.
Eye-movement analysis
Prior to the analysis of the eye-movement data, trials with incorrectly answered comprehension question were discarded (see Table 2). As is common with eye-tracking data (Hornof & Halverson, Reference Hornof and Halverson2002; Zhang & Hornof, Reference Zhang and Hornof2011; Blignaut et al., Reference Blignaut, Holmqvist, Nyström, Dewhurst, Horsley, Eliot, Knight and Reilly2014; Zhang & Hornof, Reference Zhang and Hornof2014), fixations in many trials contained systematic errors that could be easily corrected. In order to account for this error while avoiding human bias, we applied an automatic correction procedure on all fixations of all trials prior to analysis (see Supplementary Materials). We then visually inspected each trial looking for trials containing fewer than five fixations (1 trial) and any trial that was clearly noisy either before correction (i.e., the algorithm could not possibly have meaningfully corrected the data) or after correction. All noisy trials were concentrated on a single participant, who, as mentioned in the Participants section, was thus removed entirely from the data. All statistics reported below are based on the remaining corrected data.
Table 2. Participant mean accuracy per condition of Experiment 1. Incorrect trials were discarded from the eye-movement analysis

* : Recall that 1 trial was removed before analysis because it had fewer than 5 fixations.
For the analysis, we a priori chose one early reading measure – First Pass Duration (FPD) – and one late reading measure – Total Duration (TD) – for our analyses. First Pass Duration was defined as the summed length of all fixations on a given region for the first time the participant arrived at that region, before moving past it. Footnote 3 Total Duration was defined as the summed length of all fixations on a given region. These measures were extracted from the corrected fixations for each of ROI1 and ROI2 using the Get Reading Measures script (Dan, 2020). In addition, we extracted a count of all the regressions onto the critical region (Reg2CR). A fixation counted as a Reg2CR if it satisfied two conditions: (1) it was located inside the critical region, and (2) the previous fixation was located inside a subsequent interest area. Note that this definition will include regressions performed completely inside the critical region. For example, given the critical region pharmaceutical market size increase, a fixation on pharmaceutical will count as a regression if its previous fixation was performed on any of market, size, and increase. We chose to include these cases because the critical region of our items was quite long (cf. increase in the size of the pharmaceutical market).
We trimmed the data in order to avoid extreme reading measure values. For each ROI, we trimmed extreme values by discarding trials whose FPD was below 80 ms or greater than 1000 ms, and trials whose TD was below 80 ms or greater than 2000 ms (see Table 3). Because we analyzed five reading measures (two duration measures over two ROIs, plus the regression count), we applied a Bonferroni correction resulting in an alpha threshold of 0.05/5 = 0.01 (see von der Malsburg & Angele, Reference von der Malsburg and Angele2017).
Table 3. Number (percentage) of trials trimmed before the analysis of each reading measure of Experiment 1

The extracted duration measures were submitted to generalized mixed models (GMM) with a Gamma distribution and an identity link function to account for the skewed nature of duration measures (see Lo & Andrews, Reference Lo and Andrews2015), using the lme4 package (Bates et al., Reference Bates, Mächler, Bolker and Walker2015) in R (R Core Team, 2013). Results include p-value estimates from the lmerTest package (Kuznetsova, Brockhoff, Christensen, et al., Reference Kuznetsova, Brockhoff and Christensen2017). Given that we had clear hypotheses, fixed effects included Phrase Type (NC/PP), and Length (4/6), both of which were sum-coded, as well as two predictors (OPT score and DST score), which were scaled and centered to reduce collinearity. Also included were random effects for subjects and items, which were maximally specified (Barr et al., Reference Barr, Levy, Scheepers and Tily2013)Footnote 4 . Full model estimates and values are provided in Appendix C.
The number of regressions onto the critical region is a type of count data and thus is not expected to follow a normal distribution. Therefore, we fitted a GMM, using a Poisson distribution with a log link function. The model was maximally specified, in the same way as the duration measures.
Results
Comprehension accuracy was high as can be seen in Table 2 and will not be considered further. Participants scored a mean of 93.45% (SD: 4.96) on the OPT and a mean of 6.64 out of 9 (SD: 1.25) on the DST. Table 3 shows the number of discarded trials due to trimming of extreme reading measure values, and the number of trials used in the final eye-movement analyses.
Figures 4 and 5 show the reading measures for regions of interest 1 and 2, respectively. The GMMs revealed no effect of Length or Type in any of the duration models analyzed (see Tables C1, C2 for First Pass Duration in ROI1 and ROI2, respectively, and Tables C3 and C4 for Total Duration in ROI1 and ROI2, respectively). However, in the analysis of Total Duration (see Fig. 7a and 7b), we did find an effect of the DST score on both ROI 1 (t = −4.367, p < .001) and ROI2 (t = −4.816, p < .001), with higher WM scores leading to shorter durations.

Figure 4. Experiment 1: Reading measures in Region of Interest 1. Error bars represent 95% confidence intervals.

Figure 5. Experiment 1: Reading measures in Region of Interest 2. Error bars represent 95% confidence intervals.

Figure 6. Experiment 1: Regressions onto the critical region.

Figure 7. Experiment 1: The relation between the reading measures and some of the covariate data in our study. We use transparent data points in order to indicate their density. The covariates in (a), (b), and (c) were found to be significant predictors of the reading measures they are presented with. The covariates (d) and (e) are referred to in the Discussion. Gray shading indicates 95% confidence intervals for the regression line.
Figure 6 shows the distribution of the number of Reg2CR by condition. We do not present mean and standard deviation because the distribution is notably not normal. Trials with length 6 had a significantly larger amount of Reg2CRs (z = −4.645, p < .001). Trials containing an NC had significantly fewer Reg2CRs than trials containing PP (z = −5.312, p < .001). In addition, English proficiency was a significant predictor of the number of Reg2CR (z = 2.681, p < .007; see Fig. 7c), but not in the expected direction: higher proficiency led to more Reg2CRs than lower proficiency (see Table C5). This effect was driven by a single outlying participant with very low proficiency score (see Fig. 7c) and became non-significant when the participant was removed.
Discussion
In this experiment, we investigated the reading difficulty evinced by NCs compared with that caused by PPs. In particular, we examined structures composed of either four or six content words. Following the UID hypothesis, we predicted that the longer structures would cause more difficulty than the shorter ones and that NCs would be harder to process than PPs. In addition, we predicted that this difficulty would be modulated by participant individual differences such as WM (measured by the DST) and English proficiency (measured by the OPT). To measure this difficulty, we extracted the number of regressions onto the target structures, as well as two duration measures in the two regions following the target structure, reflecting early and late processing effects. Our assumption was that more regressions and longer duration measures would indicate more processing difficulty.
Surprisingly, we found no effect of either length or type for any of the duration measures, neither in the segment immediately following the target structure nor in the subsequent region. It is not clear why this is the case. If NCs are more difficult to process, constituting peaks of information density, then this difference in difficulty was not revealed by either early or late reading measures. We surmise that this may have occurred for at least three reasons: because of the a priori choice of reading measures, because this difficulty did not spill over to the subsequent sentence segments as we initially expected, or because of the large variance observed in these measures.
Turning to the regression data, we did find an effect of length indicating, as predicted, that 6-length structures led to more regressions than 4-length structures. These results support the UID hypothesis under the assumption that 6-length structures do generally involve higher peaks of information than 4-length structures. We also found an effect of type on the number of Reg2CR, but this effect indicated a higher number of regressions in the PP condition, contrary to our predictions. We return to this matter in the General Discussion.
Finally, turning to our covariates, proficiency did not affect reading measures, a result we also return to in the General Discussion. Conversely, DST did significantly predict TDs (in ROI1 and ROI2), as expected, but surprisingly not FPDs. As Fig. 7d and 7e suggest, however, it is possible that the effect of DST was too small for the power of the current experiment.
In sum, speakers did not fixate longer on the text segments following the critical regions, regardless of the length or the type of structure present in the critical region, but their fixations were generally modulated by their WM abilities, at least when considering the total time spent looking at these regions. Finally, participants regressed more after longer structures, and (contrary to expectations) after PPs.
Note, however, that the experiment reported above has several limitations that may have affected the results. First, the definition of NCs presented above allows for adjectival modifiers to be interleaved with nouns (e.g., modern era general election campaign corruption). Since in these contexts it is clear that the adjectives are modifying a subsequent noun, they might have helped the participants in predicting that the next word was also a continuation of the NC, producing some facilitation. From an information theoretic perspective, this would amount to modifying the probability distribution of the next word such that all nouns are a little more likely (are less surprising or informational) and all other words are a little less likely (more informational), ultimately smoothing the information density peak caused by the NC.
Second, assuming that, in the absence of external context, items with more content words are more informationally dense, we would expect longer items to evince more difficulty than shorter ones. However, the design used in Experiment 1 was not fully within-items, so that any effect of length we have found in Experiment 1 may be an artifact of a difference in the items themselves, rather than a real effect. In other words, it would be ideal if the items were designed in such a way that longer items contained the same words as the shorter items, so that any difference between shorter and longer items is unequivocally attributable to the differing words in these items.
Third, the content words used in many of the items in Experiment 1 can be used as both a noun and a verb. This may have caused garden path effects, introducing a confound in the experiment results. For example, when reading the item United States factory employee insurance costs, participants could have processed the last word (costs) as either a verb (therefore expecting an object afterward) or a plural noun (therefore expecting a verb afterward). Specifically in this case, the NC is already quite long, and this could have made the participants even more likely to expect it to be a verb, and not a noun.Footnote 5
Fourth, because the NCs used in Experiment 1 were inspired by real economics and business texts, they included certain collocationsFootnote 6 (e.g., United States). These collocations might have helped participants in deciphering the structure of the NC, reducing the difficulty perceived when processing them as compared to PPs. That is, if the items were controlled for these collocations, we would expect a starker difference between the difficulty perceived in processing NCs and that of processing PPs. In information theoretic terms, collocations are not informationally dense: after the first word is encountered, the subsequent words are very much expected and contain little information. Hence, NCs composed of collocations may be even easier than PPs if they are common enough (e.g., heart rate variability vs variability in rate of the heart).
Finally, Experiment 1 included a DST with the purpose of assessing WM ability.
The rationale was that participants with better WM abilities would have more resources available and therefore would be less affected by the peak of information caused by NCs. Hence, WM would act as a predictor of the number of regressions and of the time spent in the ROIs 1 and 2 after an NC. However, WM is a complex construct, composed of (among others) a phonological loop involved in the processing of language stimuli, and a visuospatial sketchpad involved in the processing of visual stimuli (see, e.g., Baddeley, Reference Baddeley2011 for a review), and it is not clear which of these subcomponents the DST taps into.
In Experiment 2, we use the same paradigm, but address each of the limitations just described.
Experiment 2
In Experiment 2, each NC is composed solely of nouns that normally cannot be used as verbs, and do not contain collocations. In addition, to allow for a fully within-items experiment design, we use NCs of length 3 and 4, which were constructed such that those composed of 4 content words are an extension of the 3-length NCs. As discussed earlier, the UID hypothesis predicts NCs to lead to more difficulty than PPs, since they are used at the beginning of the sentences, without any helpful context, producing a peak of information. For similar reasons, we also expect longer constructions to lead to more difficulty than shorter ones: without any context or collocations to guide the participants’ expectations, longer structures should correspond to starker peaks of information.
Instead of a DST, in Experiment 2 we use two WM tasks: a verbal and a non-verbal task. Both tasks are serial order reconstruction tasks (SORT; Jones et al., Reference Jones, Farrand, Stuart and Morris1995), where participants are shown a sequence of items one-by-one and are later asked to select them in the order in which they were displayed. Given the direct relationship between the phonological loop and language processing, we expect that the two tasks will not be related to each other, and that the verbal SORT will predict reading behavior, but that the visual SORT will not.
We measured participants’ English proficiency with the OPT and assessed the quality of lexical representation (cf. Perfetti & Hart, Reference Perfetti, Hart, Verhoeven, Elbro and Reitsma2002) with a misspelling identification task (MSIT). We use the two tasks because spelling has been shown to predict variance independently of vocabulary and reading comprehension measures in priming and eye-movement data (see e.g., Andrews et al., Reference Andrews, Veldre and Clarke2020).
Method
Participants
The participants were 39 English native speakers, all of whom were students at the University of Alberta. They had normal or corrected-to-normal vision and were compensated with course credits. Out of the 39, 13 participants reported substantial exposure to a language other than English before the age of 5 and were therefore discarded from further analysis. The data of the remaining 26 participants, aged between 17 and 28 (mean age: 20.2, SD: 3.29), are reported below.
Materials
Eye-tracking reading task
As in Experiment 1, participants performed a reading task in which they read sentences containing either an NC or a PP. Each sentence was divided into the same five segments as Experiment 1: a semantically neutral introductory phrase, the critical segment (NC or PP), the first and second regions of interest (ROI1 and ROI2, respectively), and the final segment (not analyzed).
The 4-length NCs were composed exclusively of nouns and were constructed so that they were identical to the 3-length NCs except for the first word (e.g., inflation constraint action vs. currency inflation constraint action). The items were reviewed by three native speakers who were aware of the purposes of the experiment and who additionally checked for collocations. None of the nouns repeats across items.
We additionally controlled the critical items in a number of ways. The preamble was again composed of 3 words, but this time started exclusively with the preposition “in.” The critical segment was always preceded by “the.” The passive construction (ROI1) used exclusively the auxiliary “is.” The nouns composing the NCs were controlled for length, such that all 3-length NCs had between 24 and 29 characters and all 4-length NC had between 31 and 36 characters. The additional word inserted to create a 4-length NC was always between 6 and 10 characters long. See Table 4 for example items, and Appendix B for a list of all items.
Table 4. An example critical item of Experiment 2

Oxford Placement Test Part 1 (OPT)
This was the same as in Experiment 1.
Language Background Questionnaire (LBQ)
This was the same as in Experiment 1.
Misspelling Identification Task (MSIT)
The MSIT was performed in addition to the OPT. In this task, participants received a list of 215 words, 50 of which were incorrectly spelled. Their task was to circle all incorrectly spelled words present in the two pages. The scoring was based on the LexTale (Lemhöfer & Broersma, Reference Lemhöfer and Broersma2012) scoring formula. See the Supplementary Materials for scoring details and all task words.
Working memory tasks
Participants also performed a visual and a verbal serial order reconstruction task (SORT; Jones et al., Reference Jones, Farrand, Stuart and Morris1995). Both tasks measured participants’ WM abilities, but tapped into a different memory component. In each trial, participants saw a sequence of letters or dots, depending on the task. After the sequence, all its elements were shown again and the participant was tasked with clicking on the elements in the order in which they had appeared (3 practice and 20 critical trials). See Supplementary Materials for details.
Design
The eye-tracking task was composed of a total of 4 practice sentences, 40 filler sentences, and 28 critical sentences. They were divided into three blocks: a set of 4 practice sentences, presented in a random order, followed by a randomized set of 68 trials divided into two blocks of 34 trials containing both filler and critical sentences, and separated by a short break. The experimental items were randomly assigned to four lists forming a 2 × 2 Latin square design (type: NC vs. PP; length: 3 vs. 4) such that each participant only saw one version of each sentence.
After each item, participants answered a comprehension question by pressing the letters X or M. In order to avoid disrupting participants’ typical reading behavior, the questions were designed to be easy.
Apparatus
Stimulus presentation was programmed with the Experiment Builder software from SR Research, and eye movements were recorded with an Eyelink 1000 Plus, sampling at 500 Hz. The eye tracker recorded movements from the right eye, though presentation was binocular. Participants viewed the stimuli on a 20-inch color monitor at a resolution of 1280 × 1024 and a distance of approximately 90 cm, using a chin rest to stabilize their head. The sentences were presented using the font Courier New. Eyes were calibrated and validated at the beginning of the study, halfway through, and as needed throughout the study.
Procedure
After signing the informed consent form, participants were given the language background questionnaire. The OPT was then administered, followed by the MSIT.
The participant then was asked to sit in front of the eye tracker and instructed about the eye-tracking reading task, whose procedure was virtually the same as that of Experiment 1. As in Experiment 1, sentences were presented so that the preamble and the critical region appeared on the first text line, and the rest appeared on the second line.
After finishing the eye-tracking task, the participant moved on to another computer where the two short-term memory tasks were performed. The visual serial order reconstruction task was performed first, followed by the verbal SORT. This ordering was chosen to prevent participants from being influenced by the verbal task when performing the visual one: if the verbal task were performed first, participants could be led to use a verbal strategy to perform the visual task, yielding spurious results. Before each task, the task instructions were both explained by the experimenter and presented on the screen for the participant to read.
Eye-movement analysis
The analysis is roughly the same as in Experiment 1. Trials with incorrect comprehension question responses were discarded (see Table 5), and the fixation correction resulted in the removal of 7 additional trials (see the Supplementary Materials for examples of these cases).
Table 5. Participant mean accuracy per condition of Experiment 2 after data removal. Incorrect trials were discarded from the eye-movement analysis
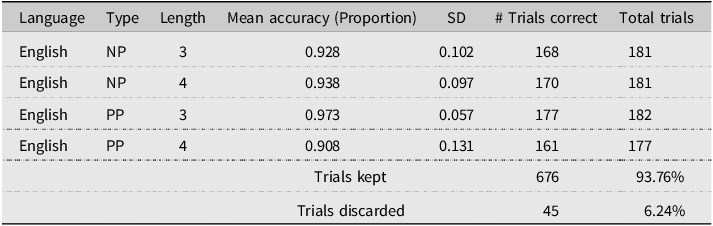
From the resulting data, we extracted FPD and TD for each of ROI1 and ROI2, as well as the number of Reg2CR. Trimming and Bonferroni correction were applied as in Experiment 1.
The extracted duration measures were submitted to separate GMMs with a Gamma distribution and an identity link function. Fixed effects included two predictor variables for proficiency (OPT score and MSIT score) and two WM scores (verbal SORT and visual SORT), all of which were scaled and centered. We also added Length (3/4) and Phrase Type (NC/PP) as fixed effects, both of which were sum-coded. The random effects structure of the models was maximally specified.Footnote 7
Regression counts were analyzed in an analogous manner, with a maximally specified GMM using the Poisson distribution and the log link function.
Results
Comprehension accuracy was generally high, as reported in Table 5, and, as in Experiment 1, was not considered further. Participants also scored high both in the OPT (46.440 ± 2.583 out of 50) and in the MSIT (82.94 ± 7.636 out of 100). The amount of trimming for each duration measure is reported in Table 6.
Table 6. Number of trials trimmed before the analysis of each reading measure of Experiment 2. Numbers inside parenthesis indicate the percentage of the total trials

Figures 8 and 9 show the results for ROIs 1 and 2, respectively. No effect was found for TD in either ROI1 or ROI2. For FPD in ROI2, we found an effect of Type, with trials containing an NC evoking significantly longer FPDs than trials containing a PP (t = 2.974, p = .003). In addition, visual WM score was a significant predictor of FPD in ROI1 (t = 3.540, p < .001) and in ROI2 (t = 2.684, p = .007), with longer FPDs associated with better visual WM abilities (see Fig. 10). This effect was driven by a single participant with a very high visual WM score. Removing the participant made the effect no longer significant (see Fig. 10c and 10d). See Tables D1 and D2 in Appendix D for FPD in ROIs 1 and 2, respectively, and Tables D3 and D4 in Appendix D for TD in ROIs 1 and 2, respectively.

Figure 8. Experiment 2: Reading measures in Region of Interest 1. Error bars represent 95% confidence intervals.

Figure 9. Experiment 2: Reading measures in Region of Interest 2. Error bars represent 95% confidence intervals.

Figure 10. Experiment 2: Correlation between participants’ visual WM scores and First Pass Duration in ROI1 (a) and ROI2 (b), found to be significant predictors in our model, and the same results (c and d, respectively) after removing the single outlier with very high Visual WM score. Gray shading indicates 95% confidence intervals for the regression line.
Figure 11 shows a histogram of the number of Reg2CR. Again, we do not show mean and standard deviations because the distribution was clearly not Gaussian. We found a significant effect of Length (z = −4.276, p < .001), indicating a higher Reg2CR count for trials containing structures with length 4 than those with length 3. In addition, NCs evoked significantly fewer Reg2CR than PPs (t = −9.821, p < .001). See Table D5.

Figure 11. Experiment 2: Regressions onto the critical region.
As expected, visual WM scores (mean: 4.526, SD: .969) and verbal WM scores (mean: 4.631, SD: 1.380) were not significantly correlated (correlation: 0.129, t = .638, p = .530).
In order to verify that there was no large correlation between the model variables that could lead to a poor model fit, we computed the Variance Inflation FactorFootnote 8 (VIF) score of each model. In particular, this was done in order to rule out any correlation between verbal and visual SORT or between OPT and MSIT scores. In none of the models was the VIF associated with any of the covariates at a level higher than 2, indicating that, for each model, none of the variables could be reliably predicted based on the other model variables.
Discussion
In Experiment 2, we further explored the differences predicted by the UID between the processing of NCs and that of PPs with improved items. We expected longer reading times for all measures in the segments following the critical region for sentences containing NCs and sentences containing a longer critical structure. As in Experiment 1, we also expected these differences to be modulated by individual differences, such as English proficiency and WM abilities.
Our results partially replicate those of Experiment 1. We found no effects of length or type for FPD in ROI1, nor for TD in ROI1 and ROI2, nor for proficiency in any measure analyzed. In addition, we did find significant effects of length and type for Reg2CR in the same direction as Experiment 1 (with longer structures and PPs leading to more regressions).
In contrast with Experiment 1, however, we found no effect of WM scores. This may reflect the fact that we used a different task in Experiment 2, and it is not clear whether we would have found a significant effect had we used a DST. More interestingly, we did find an effect of type on FPD in ROI2 in the predicted direction, namely, NCs led to longer FPDs than PPs. This effect constitutes evidence in favor of the UID, suggesting that NCs are harder to process than PPs.
General discussion
In two experiments, we investigated the online processing of nominal compounds (NC) compared to that of nouns modified by prepositional phrases (PP), which use more words and express roughly the same meaning. We assumed that NCs transfer more information per symbol, leading to a peak in information density. Based on the UID hypothesis, we predicted that these peaks would cause processing difficulty. We also assumed that the UID hypothesis would subsume all other sources of NC processing difficulty that have been both theorized and shown in the NC literature. In our online studies, we expected it to be reflected by more frequent regressions toward the NC and longer reading times in the subsequent text segments (as compared to PPs). The pattern of results found in the two experiments is summarized in Table 7.
Table 7. An overview of the results of Experiments 1 and 2. Effects that were no longer significant after outlier removal are not shown

Relevance of the findings to the UID
The clearest indication we have in favor of our predictions was the longer First Pass Durations (FPDs) in ROI2 for NCs in Experiment 2: As predicted, the denser structures evoked more processing difficulty than the less dense ones. This effect only became apparent after controlling for the shortcomings of Experiment 1. It was an early effect, only found in a segment further away from the critical segment (ROI2). In addition, we found a clear effect of length in the analysis of regressions toward the critical region (Reg2CR): Longer structures led to more Reg2CR in both studies. We interpret these as evidence in favor of the UID hypothesis, since longer structures are presumed to be associated with higher information transmission rate.Footnote 9
Contrary to expectation, trials containing PPs had significantly more regressions than trials containing NCs. We believe this may be an artifact of two characteristics of this study: The position of the head noun and the large length difference between the structures. First, the head noun in PPs is the first word encountered by the reader, thus leading to a long gap between the critical region head noun and the ROI1 tensed verb. When the reader arrives at ROI1, they need to regress in order to verify the agreement between the two words. In NC sentences, the head noun is the last word of the critical region, the reader probably still has it in working memory (WM) when they reach the tensed verb in ROI1, and hence no regression is necessary. Second, recall that a fixation is a Reg2CR if two conditions are met: The fixation is a regression (moved backward with respect to the previous fixation) and is positioned on the critical region. We chose to include regressions inside the critical region because of the region’s length: Participants could experience difficulty inside the critical region itself, which would be hidden if we only considered regressions coming from subsequent text areas. But this decision meant that participants have many more chances to regress inside a PP than inside an NC, potentially leading to a spurious effect of Length in Reg2CR.
Interestingly, none of the measures was predicted by English proficiency in either experiment. Of course, participants were L1 speakers and therefore generally showed high proficiency, resulting in small variance in proficiency scores, which may have obscured the effects of proficiency on the measures. Note, however, that our findings are consistent with those of recent studies on the association between proficiency and prediction (Dijkgraaf et al., Reference Dijkgraaf, Hartsuiker and Duyck2017; Kim & Grüter, Reference Kim and Grüter2021; Ito et al., Reference Ito, Corley and Pickering2018; Mitsugi, Reference Mitsugi2020). The integration difficulty expected in our study is linked to the notion of prediction, that is, the idea that the surrounding context influences the state of the language parsing system, which is then used to infer the upcoming signal (Kuperberg & Jaeger, Reference Kuperberg and Jaeger2016). Under this framework, in a way very much compatible with the UID formulation, one could attribute the parsing difficulty experienced upon encountering an NC/PP to a prediction error, where participants incorrectly expected a different sequence of upcoming words. Even though it is typically assumed that better proficiency necessarily leads to better prediction, our results are in line with recent studies suggesting that these two abilities are not as clearly associated – neither for L1 (Dijkgraaf et al., Reference Dijkgraaf, Hartsuiker and Duyck2017) nor for L2 (Ito et al., Reference Ito, Corley and Pickering2018; Kim & Grüter, Reference Kim and Grüter2021; Mitsugi, Reference Mitsugi2020) – as has been typically assumed (see review in Kaan & Grüter, Reference Kaan, Grüter, Kaan and Grüter2021).
Conversely, the digit span test (DST) score was a good predictor of total durations (TDs) in Experiment 1 and did present a negative (but not significantly different from zero) correlation with FPDs. Replacing the DST with serial order reconstruction tasks (SORTs) did not produce the expected results: Neither verbal nor visual SORT significantly predicted the duration measures. It is not clear how DST scores relate to SORT results and it is therefore not possible to say whether the results would be the same had we used a DST in Experiment 2. Further experiments are needed in order to better understand the relationship between the different WM measures and their impact on eye-tracking reading measures.
Given the abundance of literature showing that the UID holds for production, it may seem odd that we did not find clear results for comprehension. How can this be? In order to better understand these results, there are at least three different perspectives through which this data should be considered, which are discussed separately below.
Technical matters related to the data
One potential confounding factor in our results is technical matters related to the data. Because the sentences used in Experiments 1 and 2 were long, stimulus presentation was performed in two text lines, with the critical segment positioned at the end of the first line, and ROIs 1 and 2 positioned at the beginning of the second line. This caused three types of distortion in the data. First, in order to move from the critical segment toward ROI1, participants needed to perform a long saccade with a high chance of landing by mistake in ROI2. By definition, when a participant fixated in ROI2 before fixating in ROI1, then FPD in ROI1 was 0 ms. This led the trial to be discarded during trimming from the FPD ROI1 analysis, partially explaining the high number of trimmed trials in ROI1 (see Tables 3 and 6). Second, participants varied substantially the vertical position of their fixations while reading. For example, while reading United States in Fig. 3, some participants performed fixations too low, closer to the second text line than the first one. When extracting the reading measures, this was calculated as equivalent to “skipping” ROI1, again causing FPD to be 0 ms. Third, regressions were not easily identifiable as left-saccades (e.g., moving from ROI1 to the critical region required a right-saccade). Thus, we had to redefine “regression” based on the previous fixation’s interest area: If the previous fixation was in the interest area of a word that followed the current fixation’s word, then the current fixation counted as a regression. The disadvantage of this definition is that it disregarded regressions coming from outside any interest areas. In order to alleviate the impact of these shortcomings, we took them into account when implementing our correction algorithm (see Supplementary Materials). Our subjective review of the corrected data concluded that the correction did substantially improve its quality. However, we suggest that future studies be run with stimulus presentation in a single text line in order to avoid the aforementioned problems.
In addition, given the exploratory nature of the study, we chose to investigate the time course of the predicted difficulty by only analyzing two reading measures (FPD and TD), thus avoiding too many comparisons. Given the results reported here, it may be that our choice of reading measures was unlucky and that other measures might have provided clearer evidence favoring the UID, given that eye-tracking reading measures have been found not to correlate much with one another (see von der Malsburg & Angele, Reference von der Malsburg and Angele2017). Furthermore, our results may also reflect the indirect nature of our paradigm, which depends on participants’ difficulty spilling over to the subsequent text segments. While both options are in principle possible, it is important to note that the kind of spillover-based analysis we chose is well established in the literature, and numerous studies on the processing of other structures have found significant differences in spillover regions analyzed the way we did using the exact same reading measures we chose (e.g., Christianson et al., Reference Christianson, Luke, Hussey and Wochna2017; Jared & O’Donnell, Reference Jared and O’Donnell2017; Paape & Vasishth, Reference Paape and Vasishth2022; Pickering & Traxler, Reference Pickering and Traxler1998).
Cognitive load differences in comprehension vs. production
When interpreting the data reported here, one should also consider the differences between production and comprehension, and in particular the differences in cognitive demands associated with each task type. The relationship between production and comprehension is an open area of research, not yet clearly understood, and results that hold for one task type sometimes do not hold for the other (for a review, see Iraola Azpiroz et al., Reference Iraola Azpiroz, Allen, Katsika and Fernandez2019a, Reference Iraola Azpiroz, Allen, Katsika and Fernandez2019b). As discussed earlier, most other studies favoring the UID have probed production. Perhaps real-time production is more difficult, involving turn-taking, linguistic parsing, motor coordination, and typically relying on real-world information, making speakers more likely to be affected by peaks and troughs of information density, as the associated cognitive costs may harm their communicative goals. Conversely, reading is static, and the communicative goals of the writer are presumably not the same as those of a conversation partner. Thus, the reader may not be taxed to the same extent as a speaker, the effect may be subtler, and experiments investigating the UID in reading may actually require starker peaks in information density to unlock the same effects. Hence, maybe it is possible to find results favoring the UID by imposing an additional task that taxes participant WM while reading to exacerbate information density peak-related costs. This would explain the findings of Sikos et al., Reference Sikos, Greenberg, Drenhaus, Crocker, Gunzelmann, Howes, Tenbrink and Davelaar2017 in support of the UID, since two aspects of their design provided additional cognitive load. First, they used a G-Maze task that forced participants to make decisions about the sentence as they went through it. Second, their experiment incorporated a prediction aspect by manipulating the subject (the journalist published/the man evaluated the carefully written essay). Kuperberg and Jaeger (Reference Kuperberg and Jaeger2016) point out that prediction is costly and suggest that speakers balance this cost with the reliability of their predictions and with how useful their predictions are in advancing their communicative goal.
Our study illustrates the importance of converging evidence from different domains: Despite the evidence for production, the UID hypothesis may not hold as clearly when considering well-designed reading studies, for which it may actually be harder to find evidence in its favor. Of course, this study is one of the first to focus on the UID while reading, and much more exploration is necessary to determine its validity.
The role of experience with NC use
Finally, it is important to consider the relevance of previous participant experience with NCs to our results. When preparing the experiments reported here, we had good reason to presume that NCs are not straightforward to process: NCs had been thus theorized in the literature, and a number of behavioral studies had shown evidence favoring this assumption. However, the few significant differences reported here cast some doubt on this presumption. Are NCs really denser than PPs?
In order to answer this question, we used a language model to estimate the informational content of our items. The language model we used was OpenAI’s GPT-2 (Radford et al., Reference Radford, Wu, Child, Luan, Amodei and Sutskever2019), a pre-trained version of which can be downloaded from the web. This ready-to-use model was trained on a dataset scraped from millions of links referred to by Reddit users, contemplating pages of all sorts of domains, including commercial pages (e.g., eBay, Apple, Craig’s list), journalistic pages (New York Times, BBC, Reuters), wikis (Wikipedia, Wikia, Gamepedia), other user-created content (Urban Dictionary, Pastebin, Medium, Stack Exchange), as well as academic pages (Nasa, Stanford, NIH). Given a context c (a set of words, e.g., “pharmaceutical market”) and a continuation word w (e.g., “size”), the model produces probabilities P(w|c). The informational content of the word w is calculated as −log(P(w|c)). Of course, to calculate the information of a subsequent word w 2 (e.g., “increase” after “size”) we use w in its context, that is, we calculate −log(P(w 2|c,w). Since information is additive, the information content of both “size” and “increase” is the sum of their individual contents (see Appendix E for details).
We used the language model and the aforementioned procedure to calculate the information content of all of our items. The results of the model can be seen in Fig. 12. Considered generally, the NCs used in our study do carry more information per word than their PP counterparts. While the total NC information amount is not very different from that of PPs, the distributions become much more clearly divided when considered the amount of information per word.Footnote 10

Figure 12. The information of items in Experiment 1 and 2. Graphs show the total amount (a and b) and the information per word (c and d). In all graphs, each point represents an item.
Why, then, do we not find clear processing difficulties caused by NCs relative to PPs? There are two factors that may have affected the study results. First, a large portion of our participants were university students, who might be used to reading scientific articles, and thus NCs. Presumably, their internal parser already associates a higher probability (and thus a lower density) to NCs.
Second, NC use in certain registers is changing. Consider Biber and Gray’s (Reference Biber and Gray2011) diachronic study of NCs in several English registers. Even though they found an increase in NC use in academic and journalistic texts (see Fig. 2), this was not the case for the other registers they investigated (novels and drama), suggesting that NC probability may still be considerably low in general English and corroborating the output of the language model. However, for the academic register specifically, although their latest reported data are from 2005, we have no reason to think that the trend has stopped there: The probability associated with the structure is increasing, making them less informational.
The information formula discussed above is also known as surprisal in the literature and is at the core of Surprisal Theory, a theory hypothesizing that a word’s processing difficulty is proportional to its surprisal (Levy, Reference Levy2008): More informative (surprising) words should lead to more processing difficulty. Given the calculated information values above, it may be worth asking whether Surprisal Theory would have fared better at predicting the processing difficulty experienced by participants.Footnote 11 Considering the aforementioned factors affecting the results, we would expect surprisal (information) to be a bad predictor of processing difficulty. Unfortunately, we do not have enough data to add item information values to our models. However, Fig. 13 shows the information content of each item of Experiment 1 along with the observed FPD values in ROI1. As expected, there does not seem to be a clear relationship between FPD values and information. Footnote 12 Further research should address this question in a more careful way.

Figure 13. Figure shows items of Experiment 1 ordered by their surprisal per word, as indicated by the triangles, and separated by condition. Mean and standard error of FPD in ROI1 are indicated by the dot and the error bars. Similar comparisons between reading measures and total surprisal of each item are also available in the Supplementary Materials.
Overall, this highlights the role of experience in language processing in general and in particular in the processing of complex structures. Even though NCs are generally dense, they may not be so for our specific combination of participants and items.
Conclusion
This study provides evidence in favor of the UID hypothesis through the investigation of a structure typically considered hard to process, namely complex nominal compounds consisting of three or more words. In one of the first studies to investigate the UID hypothesis from the point of view of comprehension, we compared NCs with a much longer structure (PPs) that spreads the information conveyed more evenly through time. The results reported in Experiments 1 and 2 indicate that NCs do lead to comprehension difficulty, although the pattern of results was not as clear as predicted.
The results reported here have two key implications for the UID. First, we interpret our results as reflecting differences between the processes of production and comprehension, namely the fact that production tends to be harder than comprehension. As a result, it may be beneficial in future reading studies to include an additional parallel task in order to increase participants’ cognitive load and this way evoke the effects predicted by the UID hypothesis. Second, these results highlight the importance of considering the role of experience in the design of UID studies. NC use is becoming more common in recent years, especially among the academic population that is typically recruited in psycholinguistic studies, and we argue that in our case their experience with the structure led to less difficulty in its processing.
In sum, this study gives rise to two key areas that should form an integral part of our understanding of the UID, namely how the comprehension-production asymmetry and experience with a given register impact the way the UID hypothesis has been operationalized in the literature.
Replication package
All research materials, data, and analysis code are available at: https://osf.io/tqspf.
Supplementary material
The supplementary material for this article can be found at https://doi.org/10.1017/S0142716424000092
Acknowledgements
We are grateful for the help of many people in bringing this project to fruition in the present paper. Numerous students and colleagues provided assistance in developing materials, testing participants, piloting earlier versions of the study, and discussing the results: Reza Akhtar, Anthony Akinbodunse, Ian Brenckle, Lindsay Coffin, Liz Dovenberg, Mary Elliot, Neiloufar Family, Maialen Iraola Azpiroz, Gunnar Jacob, Abdullah Jelelati, Alice Johnson, Kalliopi Katsika, Maria Klatte, Victor Kuperman, Tenyse Wells, Nariman Utegaliyev, Fransisca Hapsari, Jamie Nisbet, Lisa Martinek, Liberus Ogbonna Ogochukwu, and Hannah Powers. Lianna Fortune and Juhani Järvikivi generously collected the data for Experiment 1 at the University of Alberta. Audiences at several conferences and university colloquia provided feedback on the ideas presented here, and the Kaiserslautern Scientific Writing Group provided helpful comments on previous versions of this article. This work was funded by the Rheinland-Pfälzische Technische Universität via a doctoral fellowship to the first author through the Rhineland-Palatinate State Research Initiative and via a faculty start-up grant to the third author.
Appendix A Experiment 1 items
Table A1. List of all items with length 4

Table A2. List of all items with length 6

Appendix B Experiment 2 items
Table B1. List of all items with length 4. The parenthesis indicates the parts that need to be removed in order to build the items with length 3

Appendix C Experiment 1 models
Table C1. Experiment 1: First pass duration – region of interest 1

Note: Significant (p < .01) findings are indicated in bold.
Table C2. Experiment 1: First pass duration – region of interest 2

Table C3. Experiment 1: total duration – region of interest 1

Table C4. Experiment 1: total duration – region of interest 2

Table C5. Experiment 1: Regressions onto the critical region. Note that the effect of OPT was driven by a single outlying participant

Table C6. Experiment 1: Regressions onto the critical region (normalized by the length in characters of the critical region). Note that the effect of OPT was driven by a single outlying participant

Appendix D Experiment 2 models
Table D1. Experiment 2: First pass duration – region of interest 1. Note that the effect of visual WM was driven by a single outlying participant

Note: Significant (p < .01) findings are indicated in bold.
Table D2. Experiment 2: First pass duration – region of interest 2. Note that the effect of visual WM was driven by a single outlying participant

Table D3. Experiment 2: Total duration – region of interest 1

Table D4. Experiment 2: Total duration – region of interest 2

Table D5. Experiment 2: Regressions onto the critical region

Table D6. Experiment 2: Regressions onto the critical region (normalized by the length in characters of the critical region)

Appendix E Calculating item information
Calculating information depends on estimating the probability of a word given the surrounding context. A number of methods exist for such an estimation, which have been shown in the literature to correlate with other behavioral measures such as self-paced reading times and ERP patterns, including n-gram models (see, e.g., Lopopolo et al., Reference Lopopolo, Frank, van den Bosch and Willems2017; Willems et al., Reference Willems, Frank, Nijhof, Hagoort and van den Bosch2016) and models based on neural networks (e.g., S. L. Frank et al., Reference Frank, Monaghan, Tsoukala and Hagoort2019; Merkx & Frank, Reference Merkx, Frank, Chersoni, Hollenstein, Jacobs, Oseki, Prévot and Santus2021). We use Python 3.8.10 and the HuggingFace transformer library (Wolf et al., Reference Wolf, Debut, Sanh, Chaumond, Delangue, Moi and Rush2020) version 4.8.2 with OpenAI’s GPT-2 neural network-based language model (Radford et al., Reference Radford, Wu, Child, Luan, Amodei and Sutskever2019) accessible through the transformer’s interface to make our estimations. Given a sequence of words (e.g., “the cat sat on the”) composing the context c, the model produces a probability distribution P(t|c) over all tokens t in its vocabulary. For example, in this case, the probability assigned by the model to the word “mat” is P(“mat” |“the cat sat on the”) = 0.0000000145 (a very low probability), and the highest probability is assigned to the word “floor” (P(“floor” |“the cat sat on the”) = 0.06707). To calculate the information in “mat,” we use
 $${\rm info}\left( {''mat''{\rm{ }}|''the\ cat\ sat\ on\ the''} \right)\; = \; - {\rm log}\left( {P(''mat''|''the\ cat\ sat\ on\ the'')} \right).$$
This formula is known as Shannon’s amount of information and is identical to a value known as surprisal in the psycholinguistic literature (cf. Hale, Reference Hale2001; Levy, Reference Levy2008).
In order to calculate the information contained in a text segment, we start by tokenizing the text into a sequence of tokens. The library provides its own tokenizer class (AutoTokenizer) which, given a sequence of characters, say, hello world, breaks the sequence into tokens that are recognized by the language model. In this case, it would produce the tokens “hello” and “world.”
Out of the original text segment, the tokenization procedure produces a sequence of tokens t 1 ,…,t n . In order to calculate the amount of information in this sequence, we take advantage of the assumption that information is additive and sum the amounts produced for each token composing the sequence. In particular, we calculate the sum
 $${\rm info}({t_1}, \ldots, {t_{n}})\; = \; - {\rm log}\left( {P\left( {{t_1}|{t_0}} \right)} \right) - {\rm log}\left( {P\left( {{t_2}|{t_0},{t_1}} \right)} \right)\cdot\cdot\cdot{\rm{ }} - {\rm log}\left( {P\left( {{t_n}|{t_0},{t_1}, \ldots {\rm{ }}{t_{n - }}_1} \right)} \right)$$
where t 0 is a placeholder context used for the first token. In our calculations, t 0 is always the token “the.”
For a concrete example, the segment “the United States factory employee insurance costs” was tokenized as the tokens “the,” “ United,” “ States,” “ factory,” “ employee,” “ insurance,” and “ costs.” Then, we calculated:


