


Introduction
Polycystic ovary syndrome (PCOS) is one of the most common endocrine diseases with uncertain aetiology and causes infertility in 10–15% of women of reproductive age (Eini et al., Reference Eini, Novin, Joharchi, Hosseini, Nazarian, Piryaei and Bidadkosh2017). Several factors, including hormonal, genetic, metabolic, and environmental, are involved in PCOS (Laganà et al., Reference Laganà, Rossetti, Buscema, La Vignera, Condorelli, Gullo, Granese and Triolo2016). It has been characterized by multiple disorders such as hyperandrogenism, insulin resistance, obesity, type 2 diabetes, hyperlipidaemia, increased levels of LH to FSH, chronic anovulation, increased immature oocytes, and decreased oocyte quality, fertilization, and implantation rate (Patel and Carr, Reference Patel and Carr2008; Qiao and Feng, Reference Qiao and Feng2011; Hayes et al., Reference Hayes, Urbanek, Ehrmann, Armstrong, Lee and Sisk2015; Amini et al., Reference Amini, Tehranian, Movahedin, Ramezani Tehrani and Soltanghoraee2016).
Hyperinsulinemia in PCOS patients develops androgen hormones in two different ways. On the one hand, stimulating thecal cells increases androgen secretion; on the other hand, a decrease in sex hormone-binding globulin levels raises the free androgen level in the blood. These changes eventually create a vicious cycle of hyperandrogenism and hyperinsulinemia (Kokosar et al., Reference Kokosar, Benrick, Perfilyev, Fornes, Nilsson, Maliqueo, Behre, Sazonova, Ohlsson, Ling and Stener-Victorin2016). Hyperandrogenism impairs the folliculogenesis process, increasing immature oocytes and decreasing the quality of the mature oocytes. Lack of the ovarian follicle’s proper response to FSH is another consequence of hyperinsulinemia in PCOS, which provides a route to ovulation disorders and reduces corpus luteum presence (Patel and Carr, Reference Patel and Carr2008). Hyperandrogenism plays a critical role in oxidative stress and apoptosis, increasing the antral follicle diameter while decreasing the G/T ratio and making the follicles go into atresia. Consequently, the increased apoptosis in granulosa cells and oocytes has a negative effect on the IVF results (Karuputhula et al., Reference Karuputhula, Chattopadhyay, Chakravarty and Chaudhury2013; Ikeda et al., Reference Ikeda, Baba, Morishita, Honnma, Endo, Kiya and Saito2014).
Mitochondria are vital organs in oocytes, and their function is one of the parameters affecting oocyte quality and development. Mitochondrial function can be assessed by ATP content examination (Zhang et al., Reference Zhang, Bao, Zhou and Zheng2019). DHEA impairs mitochondrial function by acting on complex I of the respiratory chain and inhibiting cellular respiration, which ultimately increases the production of reactive oxygen species (ROS) (Safiulina et al., Reference Safiulina, Peet, Seppet, Zharkovsky and Kaasik2006), followed by a decrease in the ATP content (Huang et al., Reference Huang, Yu, Gao, Li, Zhang, Zhao, Zhao and Qiao2015). Conversely, hyperandrogenism decreases the intracellular glutathione (GSH) level in PCOS (Eini et al., Reference Eini, Novin, Joharchi, Hosseini, Nazarian, Piryaei and Bidadkosh2017), which is a critical antioxidant. Inofolic is one of the supplements used to improve the fertility of PCOS women, and contains 2 g MYO and 200 µg folic acid. MYO plays a key role in many cellular functions (Vitale et al., Reference Vitale, Rossetti, Corrado, Rapisarda, La Vignera, Condorelli, Valenti, Sapia, Laganà and Buscema2016).
In ovarian follicles, a direct relationship between the MYO concentration in the follicular fluid and the oocyte quality has been observed (Lewin et al., Reference Lewin, Szeinberg and Lepkifker1973, Chiu et al., Reference Chiu, Rogers, Law, Briton-Jones, Cheung and Haines2002). Moreover, increasing the ratio of MYO to d-chiro-inositol (DCI) in the follicular fluid promotes blastocyst quality, implantation, and pregnancy rate (Ravanos et al., Reference Ravanos, Monastra, Pavlidou, Goudakou and Prapas2017). The use of MYO in PCOS patients increases estradiol (Zeng and Yang, Reference Zeng and Yang2018) and reduces prolactin, testosterone, the LH/FSH ratio, androstenedione, insulin concentration, the glucose:insulin ratio (Artini et al., Reference Artini, Di Berardino, Papini, Genazzani, Simi, Ruggiero and Cela2013), and insulin resistance (Papaleo et al., Reference Papaleo, Molgora, Quaranta, Pellegrino and De Michele2011; Artini et al., Reference Artini, Di Berardino, Papini, Genazzani, Simi, Ruggiero and Cela2013). In addition, it improves metabolic status (Laganà et al., Reference Laganà, Rossetti, Buscema, La Vignera, Condorelli, Gullo, Granese and Triolo2016). MYO also increases the number of mature oocytes and decreases the number of immature oocytes received in the IVF cycles (Ciotta et al., Reference Ciotta, Stracquadanio, Pagano, Carbonaro, Palumbo and Gulino2011).
Research on human oocytes is not possible due to ethical issues. Previous clinical studies have examined the effect of MYO on oocyte quality in granulosa cells and follicular fluid (Akbari Sene et al., Reference Akbari Sene, Tabatabaie, Nikniaz, Alizadeh, Sheibani, Mortezapour Alisaraie, Tabatabaie, Ashrafi and Amjadi2019). This study is the first to assess the direct effect of the optimal dose of MYO on the oocyte quality parameters, including oocyte maturity and morphology, oxidative stress, intracellular GSH, and oocyte ATP content.
Materials and methods
Experimental design
In this study, 110 female prepubertal (21-day-old) NMARI mice provided by the Pasteur Institute of Iran were used. The animals were housed in fibreglass cages in a room with a light/dark cycle of 12 h, an ambient temperature of 22–24°C, proper ventilation, and free access to water and food. To determine the effective dose of MYO plus folic acid (Inofolic: LO.LI.pharma-Italian) supplement and its use in the later stages, this study was designed in two phases. First phase: the development and confirmation of the PCOS model along with the determination of MYO plus folic acid effective dose. Second phase: oocyte retrieval and cellular evaluation. The animals used in both stages were subjected to identical conditions. In the first phase, 36 mice were randomly divided into six groups after weighing.
First phase: The development and confirmation of the PCOS model along with the determination of MYO plus folic acid effective dose
The DHEA group consisted of female prepubertal (21-day-old) mice that received a daily dose of 6 mg/100 g of body weight of dehydroepiandrosterone (DHEA; Sigma Aldrich, St Louis, MO, USA) subcutaneously (s.c.) for 20 days continuously. For injection preparation, 0.01 ml of 95% ethanol was used to dissolve the DHEA powder (Aragno et al., Reference Aragno, Brignardello, Tamagno, Gatto, Danni and Boccuzzi1997, Reference Aragno, Mastrocola, Brignardello, Catalano, Robino, Manti, Parola, Danni and Boccuzzi2002). Then the resulting solution was well mixed with 0.09 ml sesame oil (Sigma Aldrich, St Louis, MO, USA) (Henmi et al., Reference Henmi, Endo, Nagasawa, Hayashi, Chida, Akutagawa, Iwasaki, Kitajima, Kiya, Nishikawa, Manase and Kudo2001; Zhu et al., Reference Zhu, Zhu, Liang, Xing, Schatten and Sun2010; Hakimpour et al., Reference Hakimpour, Jelodar, Shabani, Pourheydar, Ajdary and Mehdizadeh2022). The control group received a mixture of 0.09 ml of sesame oil and 0.01 ml of 95% ethanol subcutaneously (s.c.) for 20 continuous days. All treatment groups received daily DHEA (6 mg/100 g body weight, s.c.) and MYO plus folic acid supplement intraperitoneally (i.p.) in four different doses of: 1.2 mg/g body weight (DI4) (Croze et al., Reference Croze, Vella, Pillon, Soula, Hadji, Guichardant and Soulage2013), 0.73 mg/g body weight (DI3) (through conversion of human to animal dose by article formula) (US Food and Drug Administration, 2005), 0.36 mg/g body weight (DI2) (half dose of the DI3), and 0.184 mg/g body weight (DI1) (half dose of the DI2), for 20 days continuously. To confirm the PCOS model, vaginal smear, hormonal examination, and histopathological examination were performed.
Oestrous cycle assessment
From the 10th day of the DHEA injection until the end of the study, vaginal smears were taken for cytological examination, daily at a specified time. Cell collections were performed from the beginning of the vagina by swab impregnated with saline lavage. After transferring the cells to glass slides and drying, the samples were stained with crystal violet (Sigma Aldrich, St Louis, MO, USA) and observed under a light microscope (Nikon inverted light microscope ECLIPSE Ti-U, Japan). The dominant cells of each smear represented the stage of the cycle. Proestrus stage with nucleated cells, oestrus stage with cornified epithelium cells, metestrus stage with cornified epithelial cells and leukocytes, and diestrus stage mainly with leukocytes were detected in a vaginal smear (Ubaldi and Rienzi, Reference Ubaldi and Rienzi2008). To validate the results and eliminate the effect of different stages of the oestrus cycle, in the control group, only the mice that were in the oestrous stage were killed and assessed.
Hormone assay
After 8 h of fasting, the mice were anaesthetised with ketamine (100 mg kg−1) then 750–1000 μl of blood was taken from the heart and centrifuged at 3000 g for 10 min. After separation, the serum was immediately stored at −80°C for hormonal analysis. Fasting insulin and testosterone levels were assessed by ELISA (catalogue nos. 80552 and 90080, respectively; Crystal Chem, USA). Reagents were added according to the manufacturer’s instructions and examined using a spectrophotometer (Bio Teck, Highland Park, USA) at a wavelength of 450 nm.
Ovarian morphology
Ovaries were carefully removed from various tissues and placed in 10% formalin for fixation then embedded in paraffin. After routine histological stages, tissue sections with a thickness of 5 μm were cut and placed on a clean glass slide. Followed by dehydration and paraffinization with different concentrations of alcohol, tissue sections were stained with Harris’ haematoxylin and eosin (HandE; DAKO, CA, USA) and then were observed and photographed under an inverted light microscope (Nikon ECLIPSE Ti-U inverted microscope, Japan) that was equipped with a camera (Nikon Digital camera D5100, Japan) with ×4 and ×10 magnifications.
During microscopic observation, primordial follicles (oocytes surrounded by a row of squamous granulosa cells), preantral follicles (PAF; oocytes surrounded by multiple layers of cubic granulosa cells), early antral follicles (EAF; the presence of multiple cavities among granulosa cells), antral follicles (AF; the presence of a large and fluid-filled cavity between granulosa cells), corpus luteum (CL), large atretic antral follicles (LAtAnF; degenerated oocytes and sometimes degenerated granulosa cells that collapse in the antral space), and cystic follicles (CF: a thin wall covered with flat granulosa cells in the absence of oocytes) were examined for their specific histological features. ImageJ software (v.1.50; National Institutes of Health, Bethesda, MD, USA) was used to measure the diameter of follicles and layers. In this study, for the accurate evaluation of follicles, tissue sections from all over the ovaries (beginning to end) were prepared, stained, and examined. To evaluate the diameter of the follicle, the average diameters of small and large follicles were measured from the outer theca layer. To measure the thickness of the theca and granulosa layers of the AF, each layer with different thicknesses in each follicle was measured and their average was presented. The diameter measurement of the theca layer was carried out from areas of the follicle that were not adjacent to another follicle to differentiate theca cells from two adjacent follicles.
Second phase: The oocyte retrieval and cellular evaluation
Confirmation of PCOS mouse model
An effective dose of MYO plus folic acid (0.36 mg/g body weight), which was obtained in the first phase, was used to continue the study. So, 70 female prepubertal (21-day-old) NMRI mice were randomly divided into four groups: Control group received (s.c.) a mixture of 0.09 ml of sesame oil and 0.01 ml of 95% ethanol per day (n = 15), Sham group injected (i.p.) with 0.36 mg/g body weight MYO plus folic acid per day (n = 15), DHEA group received (s.c.) 6 mg/100 g body weight DHEA per day (n = 25), and treatment group injected daily with (s.c.) 6 mg/100 g body weight DHEA along with 0.36 mg/g body weight MYO plus folic acid (i.p.), (n = 15). All injections were performed for 20 continuous days. Vaginal smears were taken every day from the 10th day onwards. At the end of the study, four mice from the DHEA group were anaesthetised with ketamine (100 mg kg−1) to confirm the PCOS model, and the ovaries were removed for histopathological examination. Ovulation stimulation was performed in the remaining mice of the four groups to release mature oocytes.
Oocyte collection and investigation of maturity and morphology
To obtain mature oocytes, 10 IU of pregnant mare serum gonadotropin (PMSG) hormone (Gestyl; Organon, Oss, The Netherlands) was injected i.p. and 48 h later 5 IU human chorionic gonadotrophin (hCG) (Pregnyl, Organon, Oss, The Netherlands) was injected in the same way. Mice were killed 14–16 h later by cervical dislocation. Then under a stereomicroscope (Luxeo 6Z Stereozoom Microscope, Labo America, Inc, Roseville, CA, USA) oviducts were opened in a dish containing HTCM culture medium (HEPES-buffered TCM199; Sigma Aldrich, St Louis, MO, USA) supplemented with 0.5% fetal bovine serum (FBS; GIBCO BRL Invitrogen). To isolate oocytes from cumulus cells, the cumulus–oocyte complexes (COCs) were pipetted in HTCM medium containing 100 IU ml−1 hyaluronidase. Finally, all oocytes of the four groups were counted in three categories of abnormal oocytes, meiosis I (MI) stage oocytes, and MII stage oocytes. Subsequently, MII oocytes were selected for the cellular study taking into consideration the normal morphological parameters such as having spherical oocyte, round and smooth zona pellucida, small perivitelline space (PVS), and cytoplasm with low and uniform granulation (Ubaldi and Rienzi, Reference Ubaldi and Rienzi2008). For imaging oocytes, a stereomicroscope equipped with a camera was used.
Detection of intracellular ROS levels
Intracellular ROS levels were detected as green fluorescence in a dark environment using 2′,7′-dichlorodihydrofluorescein diacetate (H2DCFDA; Invitrogen, Barcelona, Spain). From each group, 35–40 MII oocytes were washed in phosphate-buffered saline (PBS) containing 1 mg ml−1 polyvinyl alcohol (PBS-PVA) droplets to remove the previous culture medium. Then, the oocytes were washed in several PBS-PVA drops containing 10 μM H2DCFDA and incubated for 30 min at 37°C. Afterwards, the washed oocytes were imaged by fluorescence microscopy (Olympus fluorescence microscope, Tokyo, Japan) with a 460 nm filter and saved as graphic files in TIFF format (Wang et al., Reference Wang, Tian, Zhang, He, Ji, Li, Tan and Liu2014). Using ImageJ software, the fluorescence pixel intensity was analyzed in different groups.
Measurement of the intracellular glutathione (GSH) level
Intracellular GSH levels were detected as blue fluorescence in a dark environment using 4-chloromethyl-6,8-difluoro-7-hydroxycoumarin (Cell Tracker Blue CMF2HC Molecular Probes; Invitrogen, Barcelona, Spain). After washing, 35–40 MII oocytes from each group in PBS drops containing 1 mg ml−1 PVA, they were washed several times in PBS-PVA drops containing 10 μM Cell Tracker Blue and incubated for 30 min at 37°C. Finally, the washed oocytes were rapidly photographed under a fluorescence microscope with a 370 nm filter (Wang et al., Reference Wang, Tian, Zhang, He, Ji, Li, Tan and Liu2014). The fluorescence intensity of the images, as graphic files in TIFF format, was analyzed by ImageJ software.
Measurement of ATP content
To evaluate the ATP content in this study, a colorimetric-based commercial mouse adenosine triphosphate ELISA kit (AB Clonal Technology, USA) was used. In total, 15 mature oocytes from each group were loaded into the microtubes with 20 μl of ultrapure water and stored at −80°C until the ATP was evaluated. For cell lysis, 100 μl of schizolysis (centrifugal separation technique based on component density) solution was added to each microtube containing oocytes and vortexed on ice for 1 min. To obtain a supernatant, the resulting mixtures were centrifuged at 10,000 g for 10 min at 4°C. After this step, the supernatant was loaded into microplates and reagents were added according to the manufacturer’s instructions. Finally, light absorption was read using an ELISA reader (Bio Teck, Highland Park, USA) with a wavelength of 450 nm. In each assay, a six-point standard curve obtained from different concentrations of standard solution (0 to 5 ng ml−1) and their light absorption readings were used. The ATP content of oocytes in four groups was calculated using the linear formula obtained from the standard curve.
Statistical analysis
The entire experiments were repeated three times and the results were presented as mean ± standard error of the mean (SEM). Statistical analysis was performed using SPSS 25.0 statistical software (Statistical Package for the Social Sciences; SPSS Inc., Chicago, IL, USA), whereas a P-value < 0.05 was considered as statistically significant. The obtained data were analyzed via one-way analysis of variance (ANOVA) followed by a least significant difference (LSD) post hoc multiple comparisons test. An independent-sample T-test was used for analysis between the two groups.
Results
The first phase: The development and confirmation of the PCOS mouse model along with determination of MYO plus folic acid effective dose
The effect of DHEA and MYO on oestrous cycle and ovarian tissue morphology
The investigations showed that the mice in the DHEA group became acyclic and remained at the oestrus stage (predominant cells were cornified epithelium) (Figure 1). Moreover, in this group, the absence of CL was significantly different compared with the control group (P < 0.000), which indicated anovulation in PCOS mice. In all the MYO plus folic acid recipient groups, a relative improvement in the oestrous cycle and the presence of CL in the ovaries were observed. However, compared with the DHEA group, only in the group treated with DHEA and 0.36 mg/g MYO plus folic acid (DI2), significant increases in the numbers of corpora lutea were observed (P < 0.033).

Figure 1. Evaluation of vaginal smear cytology to identify different stages of mice oestrous cycle: Three main cells are visible in vaginal smears. Nuclear epithelial cells (white arrow), cornified epithelial cells (black arrowheads), and leukocytes (black arrow). The predominant presence of each of these cells determines the stage of the oestrous cycle. Dominant cells in proestrus are nucleated epithelial cells, in oestrus cornified epithelial cells, in metestrus leukocyte and cornified epithelial cells, and in diestrus leukocyte.
In the ovaries of the DHEA group mice, as in the control group mice, follicles were noticed at different stages of development. The results showed that in the DHEA group the numbers of preantral, early antral, and AF increased significantly compared with the control group (P < 0.01, P < 0.05, and P < 0.0001, respectively). However, the numbers of preantral follicles in the DI3 group (0.73 mg/g MYO plus folic acid) and the numbers of AF in the DI1 group (0.184 mg/g MYO plus folic acid) were not significantly different compared with the control group. DHEA injection for 20 days led to a significant increase in the numbers of LAtAnF and CF in the DHEA group compared with the control group (P < 0.004, P < 0.02, respectively). It was also observed that the numbers of CF in the groups treated with DHEA and MYO plus folic acid in the three groups DI1 (0.184 mg/g), DI2 (0.36 mg/g), and DI3 (0.73 mg/g) were not significantly different compared with the control and DHEA groups. In this study, LAtAnF numbers were significantly increased in all the studied groups except for the group treated with DHEA and 0.36 mg/g MYO plus folic acid (DI2) compared with the control group (P < 0.01) (Table 1, Figure 2).
Table 1. Comparison of follicles types number in the study groups

Data are presented as mean ± SEM and P-value < 0.05 was significant (variance analysis and LSD) n = 6.
Table 1 presents the obtained values for the six variables in the six studied groups. Group 1 was the control, group 2 as the DHEA group, and the remaining four groups (groups 3–6) are groups treated with DHEA and different concentrations of myo-inositol plus folic acid (Inofolic) including: 0.184 mg/g (DI1: group 3), 0.36 mg/g (DI2: group 4), 0.73mg/g (DI3: group 5), and 1.2 mg/g (DI4: group 6).
As can be seen, for the preantral follicles significant differences between group 1 with groups 2, 3, 4, and 6 (P < 0.01) were observed. Also, group 5 showed a significant difference with group 6 (P < 0.05). Regarding the early antral follicles, a significant difference was found between groups 1 and 2 (P < 0.05). For antral follicles significant differences between groups 1 with group 2 (P < 0.0001), group 1 with groups 4 and 5 (P < 0.05), and group 2 with groups 3 and 6 (P < 0.05) were observed. Regarding cystic follicles significant differences between group 1 with groups 2 and 6 (P < 0.05) were found. For large atretic antral follicles, significant differences between group 1 with groups 2, 3, and 6 (P < 0.005), group 1 with group 5 (P < 0.05), and group 4 with group 6 (P < 0.05) were obvious. Last, the corpora lutea were significantly different between group 1 with groups 2–6 (P < 0.000), as well as group 2 with group 4 (P = 0.033).

Figure 2. Comparison of mice ovary morphology in groups of control, DHEA group, and groups treated with DHEA and different concentrations of myo-inositol plus folic acid (Inofolic). (a) The part of the ovarian tissue in the control group that contains different categories of follicles, including the primordial follicle shown by the arrowhead, the early antral follicle (EAn) marked with an asterisk (*), the antral follicle shown as (An), and the corpus luteum pointed as (CL). (b) Part of the ovarian tissue of the DHEA group is characterized by large cystic follicles (cyst, CF) and large atretic antral follicles (LAtAnF). (c) Part of the ovarian tissue in the DHEA-treated group with 0.184 mg/g MYO plus folic acid (DI1). (d) Part of the ovarian tissue in the DHEA-treated group with 0.36 mg/g MYO plus folic acid (DI2). (e) Part of the ovarian tissue in the DHEA-treated group with 0.73 mg/g MYO plus folic acid (DI3). (f) Part of the ovarian tissue in the DHEA-treated group with 1.2 mg/g MYO plus folic acid (DI4). All images are magnification ×40 (scale bar: 200 µm) (n = 6).
The G/T ratio in the AF of the DHEA group was significantly lower than in the control group (P < 0.0001(. The G/T ratio showed a significant increase only in the AF of the group treated with DHEA and 0.36 mg/g MYO plus folic acid (DI2) compared with the DHEA group (P < 0.0001(. To evaluate the G/T ratio, 20 follicles were selected from the ovaries of six mice in each group (Figure 3). Significant reduction in LAtAnF diameter was only observed in the group treated with DHEA and 0.36 mg/g MYO plus folic acid (DI2) compared with the DHEA group (P < 0.0001), and in the other MYO plus folic acid doses, no significant reduction was observed in diameter of LAtAnF. To examine the large antral atrial follicles, complete ovarian sections of six mice in each group were analyzed (Figure 4).
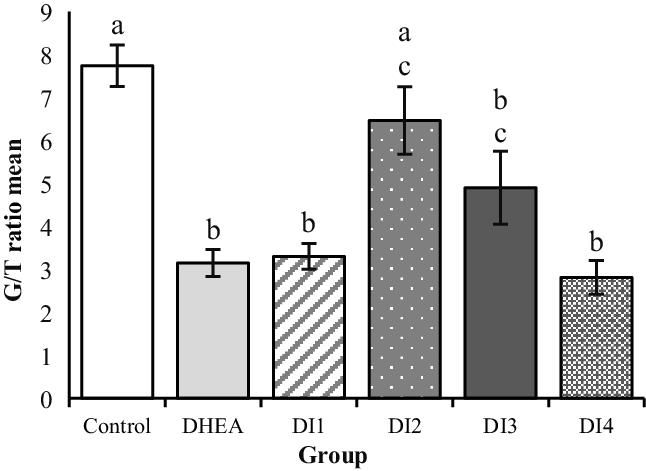
Figure 3. The effect of dehydroepiandrosterone (DHEA) and different concentrations of myo-inositol plus folic acid (Inofolic) on the morphometry of granulosa theca layer thickness (G/T) ratio in antral follicles of mice ovaries. The six studied groups are including the control group, the DHEA group, and the groups treated with DHEA and MYO plus folic acid at different concentrations such as 0.184 mg/g (DI1), 0.36 mg/g (DI2), 0.73 mg/g (DI3), and 1.2 mg/g (DI4). Data are the mean ± SEM (n = 20). As the graph presents, there was a significant reduction in DHEA recipient groups (DHEA group, DI1, DI4, and DI3) compared with the control group (P < 0.0001 and DI3 P = 0.003, respectively) and significant increase in the group treated with DHEA and 0.36 mg/g MYO plus folic acid (DI2) compared with the DHEA group (P < 0.0001). However, there was no significant difference between the control group and the DI2 group. Different lowercase letters above bars indicate significant difference.

Figure 4. The effect of dehydroepiandrosterone (DHEA) and different concentrations of myo-inositol plus folic acid (Inofolic) on the diameter morphometry of large atretic antral follicles (LAtAnF) in the mice ovary. The six groups included the control group, the DHEA group, and four groups of treated with DHEA and MYO plus folic acid at different concentrations such as 0.184 mg/g (DI1), 0.36 mg/g (DI2), 0.73 mg/g (DI3), 1.2 mg/g (DI4). Data are presented as the mean ± SEM (n = 6). There was a significant increase in all groups receiving DHEA (DHEA group, DI1, DI2, DI3, and DI4) compared with the control group (P < 0.0001) and a significant decrease in the DI2 group with the concentration of 0.36 mg/g MYO plus folic acid compared with the DHEA group (P < 0.0001). Different lowercase letters above bars indicate significant difference.
Effect of DHEA and MYO on testosterone and fasting insulin levels
The results showed that fasting insulin and testosterone concentrations were significantly increased in all groups compared with the control group (P < 0.0001 and P < 0.01, respectively). As shown in Figure 5(a), it was observed that testosterone concentrations decreased in all groups receiving MYO plus folic acid and DHEA compared with the DHEA group, but only in the DI2 group with a dose of 0.36 mg/g per day, was the decrement significant (P < 0.05). The experiment showed that fasting insulin levels in none of the groups were significantly lower than in the DHEA group. In this study, MYO plus folic acid did not cause a significant decrease in serum insulin levels (Figure 5b).

Figure 5. Effect of dehydroepiandrosterone (DHEA) and different concentrations of myo-inositol plus folic acid (Inofolic) on testosterone and fasting insulin serum levels. Serum levels of testosterone (a) and fasting insulin (b) in the control group, DHEA group, and four groups treated with DHEA and MYO plus folic acid at different concentrations including 0.184 mg/g (DI1), 0.36 mg/g (DI2), 0.73 mg/g (DI3), 1.2 mg/g (DI4). Data are presented as the mean ± SEM (n = 6). As panels (a) and (b) show, significant increases in testosterone and fasting insulin concentrations were observed in all groups compared with the control group (P < 0.01 and P < 0.0001, respectively). Testosterone levels decreased significantly only in the DI2 group compared with the DHEA group (P < 0.05). No significant decrease in fasting insulin concentration was observed in the groups DHEA-treated with MYO plus folic acid compared with the DHEA group. Different lowercase letters above bars indicate significant difference.
The second phase: The oocyte retrieval and cellular evaluation
Confirmation of PCOS mouse model
In the second phase of the study, the cessation of the oestrous cycle in the vaginal smear and the presence of CF in the DHEA group ovaries were observed (n = 3). The numbers of CF increased significantly compared with the control group (P < 0.01), which confirmed the PCOS model (Figure 6).

Figure 6. Part of ovarian tissue in control and DHEA group. (a) Presence of cyst follicles in the DHEA group. (b) Effect of dehydroepiandrosterone on the cystic follicles’ formation in control and DHEA group groups (scale bar: 200 µm). Data are presented as the mean ± SEM (n = 3). *P < 0.01 compared with the control group with the DHEA group.
The effect of DHEA and MYO on oocyte maturity and morphology
The results showed that DHEA led to a significant increase in the percentage of abnormal morphology (fragmented or giant polar body, large PVS, and fragmented cytoplasm) and immature oocytes (MI) in the DHEA group compared with the control, sham, and DHEA-treated with MYO plus folic acid (DI2) groups (MI: 17.71 ± 1.89 vs 4.60 ± 1.07 and 5.79 ± 0.99; P < 0.0001 and 10.33 ± 1.35; P = 0.001, respectively; abnormal morphology: 22.28 ± 2.74 vs 5.00 ± 1.36 and 5.10 ± 1.27; P < 0.0001 and 12.00 ± 1.77; P = 0.001, respectively). Conversely, there was a significant decrease in the percentage of mature oocytes (MII) in the DHEA group compared with the control, sham, and DHEA-treated with MYO plus folic acid (DI2) groups)MII: 54.14 ± 5.01 vs 83.83 ± 4.00 and 84.83 ± 2.721; P < 0.0001, and 69.66 ± 5.51; P = 0.02, respectively). The results showed that the supplement of MYO plus folic acid in the DI2 group significantly increased the percentages of normal morphology and mature oocytes compared with the DHEA group. Conversely, despite the use of this supplement, the maturity and normal morphology percentages of the oocytes decreased significantly compared with the control and sham groups (MII: 69.66 ± 5.51 vs 83.83 ± 4.00 and 84.83 ± 2.72; abnormal morphology: 12.00 ± 1.77 vs 5.00 ± 1.36 and 5.10 ± 1.27, respectively; P < 0.05) (Figure 7).
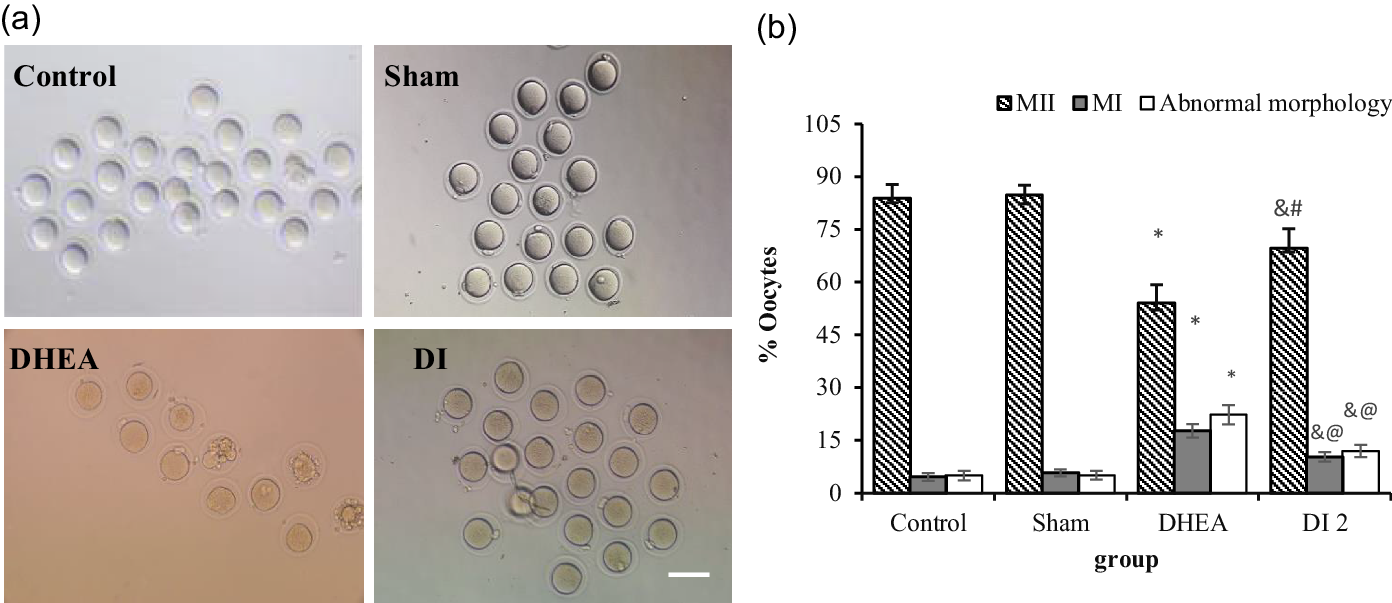
Figure 7. The effect of dehydroepiandrosterone (DHEA) and myo-inositol plus folic acid (Inofolic) on maturation and oocyte morphology in a PCOS mice model. (a) Images of oocyte maturation and morphology in the control, sham, DHEA, and DHEA-treated with MYO plus folic acid (DI2) groups. (b) Quantified data. Data are presented as the mean ± SEM [n = 217, 203, 83, and 134 in the control, sham, DHEA, and DHEA-treated with MYO plus folic acid (DI2) groups, respectively]. In the DHEA group, a significant decrease in the MII oocytes percentage and increase in the percentage of MI oocytes and abnormal morphology were observed (*). In the DI2 group significant increases in the MII oocytes percentage (# P = 0.02) and decrease in MI oocytes and abnormal morphology percentage (@ P = 0.001) were found compared with the DHEA group; & P < 0.05, in the DI2 group compared with the control and sham groups (scale bars: 100 µm).
The effect of DHEA and MYO on intracellular levels of ROS and GSH
The addition of DHEA led to a significant increase in intracellular ROS (H2O2) levels in the DHEA group compared with the control and sham groups (80.89 ± 7.63 vs 17.49 ± 2.23 and 15.8 ± 2.23 pixels per MII oocyte, respectively; P < 0.0001; Figure 6a–c). MYO plus folic acid at the 0.36 mg/g concentration in the DI2 group led to a significant decrease in intracellular ROS levels compared with the DHEA group)59.96 ± 6.07 vs 80.89 ± 7.63 pixels per MII oocyte, P < 0.05; Figure 6c,d). Nevertheless, intracellular ROS levels in this group had a significant increase compared with the control and sham groups (59.96 ± 6.07 vs 17.49 ± 2.23 and 15.8 ± 2.23 pixels per MII oocyte groups, respectively; P < 0.0001; Figure 6a,b,d). Outcomes showed that the level of intracellular GSH was significantly reduced in MII oocytes in the DHEA group compared with the control and sham groups (82.69 ± 5.99 vs 150.15 ± 8.22 and 153.1 ± 7.146 pixels per MII oocyte groups, respectively; P < 0.0001; Figure 6e–g). However, MYO plus folic acid at the 0.36 mg/g concentration in the DI2 group led to a significant increase in intracellular GSH levels compared with the DHEA group (110.72 ± 12 vs 82.69 ± 5.99 pixels per MII oocyte groups; P < 0.05; Figure 6g,h) (Figure 8).
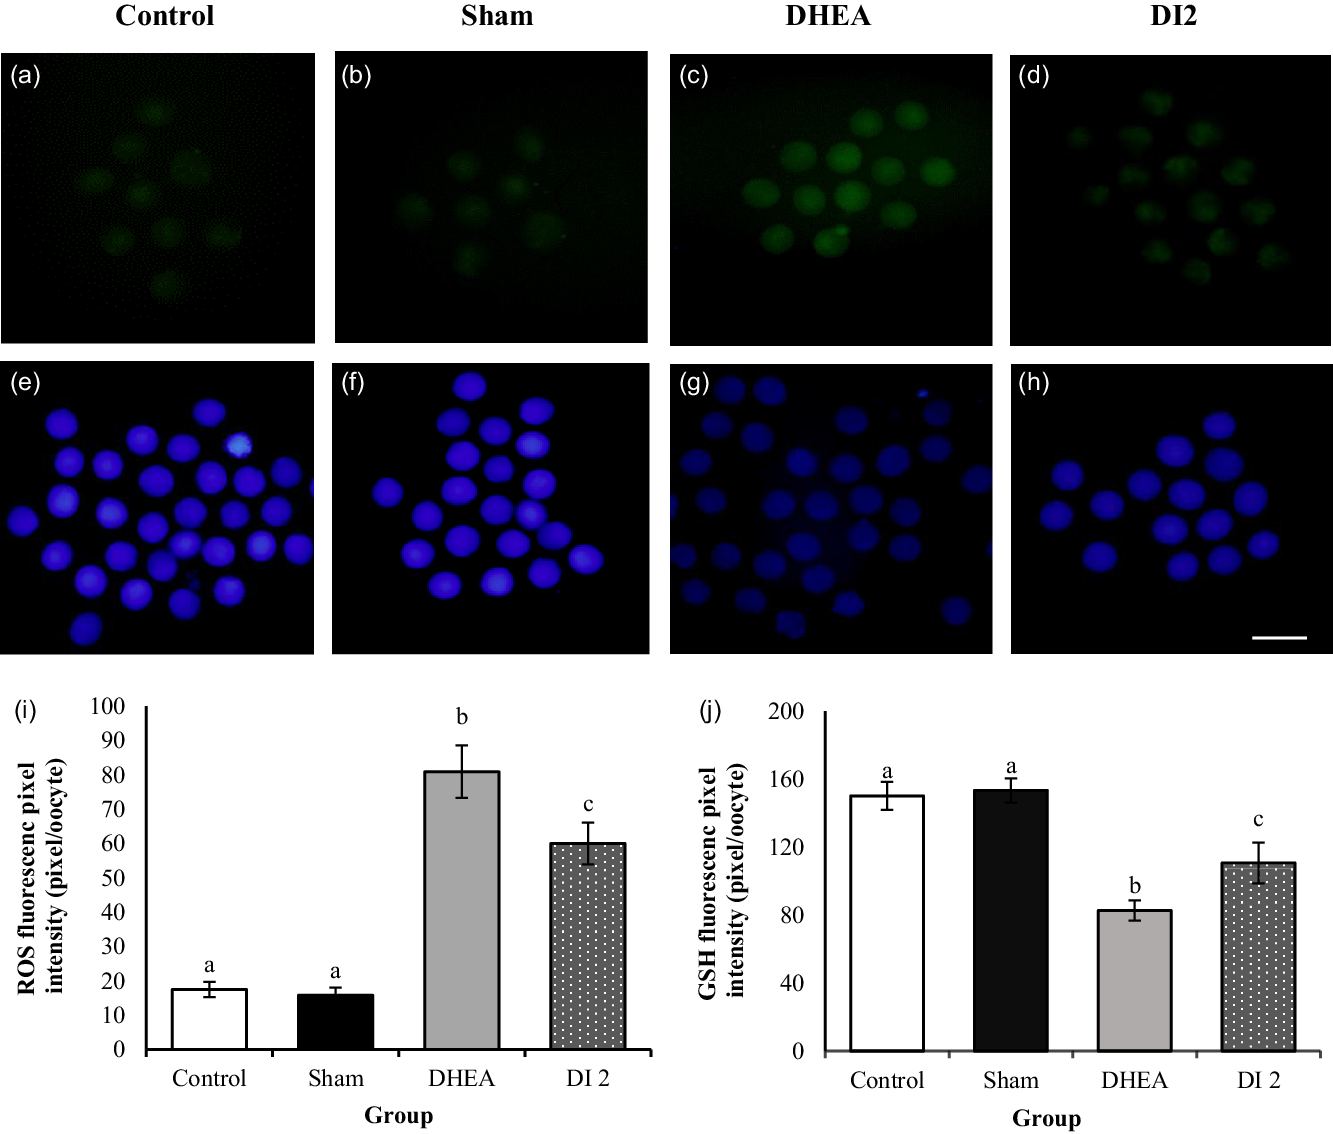
Figure 8. Effect of dehydroepiandrosterone (DHEA) and myo-inositol plus folic acid (Inofolic) on intracellular ROS and GSH levels of mouse MII oocytes. (a–d) Images of intracellular ROS and (e–h) intracellular GSH levels of MII oocytes in the control, sham, DHEA, and DHEA-treated with MYO plus folic acid (DI2) groups that were stained by H2DCFDA and Cell Tracker Blue, respectively. Scale bar, 100 µm. (i, j) Data were quantified by ImageJ software and showed the fluorescence intensity of MII oocytes stained by (i) H2DCFDA and (j) Cell Tracker Blue. Data are presented as the mean ± SEM and P < 0.05 (n = 40). In the DHEA group, fluorescence intensity significantly increased and decreased in ROS and GSH, respectively, compared with the control and sham groups (P < 0.0001). In the DHEA-treated with MYO plus folic acid (DI2) group, fluorescence intensity showed a significant decrease and increase in ROS and GSH, respectively (P < 0.05) compared with the DHEA group. Different lowercase letters above bars indicate significant difference.
The effect of DHEA and MYO on ATP content
DHEA with mitochondrial dysfunction caused a significant reduction in ATP content in the DHEA group compared with the control and sham groups (33.08 ± 9.43 vs 216.06 ± 37.28 and 175.69 ± 2.85 ng/ml; P < 0.0001). In the group receiving DHEA and MYO plus folic acid (DI2), ATP content was markedly higher than in the DHEA group (93.31 ± 18.09 vs 33.08 ± 9.43 ng/ml; P < 0.05) but, in this group, ATP content still had a significant decrement compared with the control and sham groups (93.31 ± 18.09 vs 216.06 ± 37.28 and 175.69 ± 2.85 ng/ml; P < 0.001) (Figure 9).

Figure 9. Effect of dehydroepiandrosterone (DHEA) and myo-inositol plus folic acid (Inofolic) on ATP content in mouse MII oocytes. ATP content of MII oocytes in the control, sham, DHEA, DHEA-treated with MYO plus folic acid (DI2) groups. Data are presented as the mean ± SEM (n = 15). As the diagrams show, ATP content in the DHEA group had a significant decrease compared with sham and control groups (P < 0.0001), and in the DHEA-treated with MYO plus folic acid (DI2) group this showed a significant increase compared with the DHEA group (P < 0.05). Different lowercase letters above bars indicate significant difference.
Discussion
In the present study, which followed MYO dosimetry in a PCOS mice model, the morphology of the ovary and the number of immature oocytes, fasting insulin and testosterone levels, oxidative stress, and ATP production were examined. The findings showed that MYO plus folic acid supplementation could improve almost all parameters, except for fasting insulin.
Hyperandrogenism affects the growth of preantral follicles until early antral by increasing the expression of androgen receptors on these follicles (Gleicher et al., Reference Gleicher, Weghofer and Barad2011). Previous studies have indicated that the continuous administration of DHEA in mice with increasing plasma androgen concentration led to the abnormal development of growing follicles, failure to select the dominant follicle for ovulation, and the formation of CF (Huang et al., Reference Huang, Yu, Gao, Li, Zhang, Zhao, Zhao and Qiao2015; Nikmard et al., Reference Nikmard, Hosseini, Bakhtiyari, Ashrafi, Amidi and Aflatoonian2017) and LAtAnF (Kim et al., Reference Kim, Shaipanich, Hasselblatt and Yeh2003). Similarly, our findings indicated that the injection of DHEA into mice significantly increased the numbers of preantral, early antral, antral, cystic, and LAtAn follicles compared with the control group. Moreover, it led to oestrous cycle disorders, anovulation, and the absence of the CL in the ovaries. In this study, for the first time, the effects of MYO plus folic acid on different types of ovarian follicles, G/T ratio in AF, and the diameter of large atretic AF in the PCOS mice model were evaluated.
In PCOS patients, MYO is converted to DCI by the enzyme insulin-dependent epimerase, and the increased DCI enhances androgen production in theca cells (Unfer et al., Reference Unfer, Carlomagno, Papaleo, Vailati, Candiani and Baillargeon2014). In the first phase of the present study (dosimetry), the administration of MYO plus folic acid reduced the numbers of preantral (DI3) and antral (DI1) follicles in some groups, which were not significantly different from the control group. Moreover, there was no significant difference between the control group and the three PCOS groups receiving MYO plus folic acid (DI1, DI2, DI3) regarding the number of CF. Also, in the DI2 group (0.36 mg/g), no significant difference was observed in the numbers of LAtAnF compared with the control group, which illustrated the positive effect of this supplement on ovarian morphology, as shown by a relative decrease in the number of growing follicles, CF and LAtAnF. MYO administration reduced DCI-induced androgen synthesis in theca cells by increasing the MYO/DCI ratio in the ovary (Unfer et al., Reference Unfer, Facchinetti, Orrù, Giordani and Nestler2017, Reference Unfer, Dinicola, Laganà and Bizzarri2020). It seems that a reduction in the intracellular androgen levels led to a relative improvement in the development of growing follicles and a relative decrease in ovarian follicular atresia.
MYO also improves ovulation and the menstrual cycle by reducing testosterone levels (Zacchè et al., Reference Zacchè, Caputo, Filippis, Zacchè, Dindelli and Ferrari2009; Unfer et al., Reference Unfer, Facchinetti, Orrù, Giordani and Nestler2017) and enhancing FSH signalling (Bizzarri et al., Reference Bizzarri, Cucina, Dinicola, Harrath, Alwasel, Unfer and Bevilacqua2016; Zeng and Yang, Reference Zeng and Yang2018; Kamenov and Gateva, Reference Kamenov and Gateva2020). In this research, CL was observed in the ovaries of four groups receiving MYO plus folic acid. However, only in the DI2 group, the numbers of corpora lutea were significantly larger than in the DHEA group, indicating the positive effect of this supplement with the 0.36 mg/g dose on the oestrous cycle and ovulation relative recovery compared with the other MYO doses. An increased plasma androgen concentration elevates the oxidative stress and apoptosis in the oocyte and inner layer of granulosa cells of follicles, which diminishes the G/T ratio and the oocyte quality (Maurya et al., Reference Maurya, Sangappa, Kumar, Mahfooz, Singh, Rajender and Jha2014; Mikaeili et al., Reference Mikaeili, Rashidi, Safa, Najafi, Sobhani, Asadi and Abbasi2016; Azhary et al., Reference Azhary, Harada, Takahashi, Nose, Kunitomi, Koike, Hirata, Hirota, Koga, Wada-Hiraike, Fujii and Osuga2019). Furthermore, Kim et al. (Reference Kim, Shaipanich, Hasselblatt and Yeh2003) showed that, following DHEA administration, apoptosis in the ovarian increased the diameter of the AF. Eventually, the follicles shifted to atresia, in which ovarian morphology is characterized by the appearance of cystic and large atretic AF.
Similarly, the G/T ratio in the DHEA group decreased significantly, whereas the diameter of the AF increased. In PCOS patients, MYO increased CDC42 gene expression, thereby reducing granulosa cell apoptosis (Akbari Sene et al., Reference Akbari Sene, Tabatabaie, Nikniaz, Alizadeh, Sheibani, Mortezapour Alisaraie, Tabatabaie, Ashrafi and Amjadi2019). Similarly, the G/T ratio of AF in the DI2 group markedly increased compared with the DHEA group and was not significantly different from the control group. Moreover, the diameter of LAtAn follicles was significantly smaller only in the DI2 group compared with other groups. According to these findings, MYO plays an effective role in enhancing the G/T ratio and reducing the diameter of the LAtAnF follicle by diminishing apoptosis in the ovary.
Nikmard et al. (Reference Nikmard, Hosseini, Bakhtiyari, Ashrafi, Amidi and Aflatoonian2017) reported that the daily injection of DHEA in mice increased plasma testosterone levels. Song et al. (Reference Song, Shen, Fan, Yu, Jia, Sun, Bai and Kang2018) reported a significant increase in fasting serum insulin levels in mice receiving DHEA. Similarly, our findings revealed increased levels of testosterone and fasting insulin in the DHEA-treated groups. In PCOS patients, MYO reduces testosterone levels (Zacchè et al., Reference Zacchè, Caputo, Filippis, Zacchè, Dindelli and Ferrari2009; Unfer et al., Reference Unfer, Facchinetti, Orrù, Giordani and Nestler2017); however, several studies have revealed conflicting findings regarding its effect on fasting insulin levels (Kamenov and Gateva, Reference Kamenov and Gateva2020). Some studies have documented that MYO is ineffective in PCOS patients who have a high BMI (Gerli et al., Reference Gerli, Papaleo, Ferrari and Di Renzo2007), and some others have indicated its benefits in the same group of patients with high fasting insulin levels (Genazzani et al., Reference Genazzani, Prati, Santagni, Ricchieri, Chierchia, Rattighieri, Campedelli, Simoncini and Artini2012). In the present study, MYO supplementation did not significantly reduce fasting serum insulin in any dose; however, it significantly reduced testosterone levels in the DI2 group compared with the DHEA group. We speculate that the DHEA hormonal signal is too strong to be fully counteracted by MYO supplementation, which was not sufficient to recover the insulin levels of the control group, as well as testosterone, despite the significant decrease observed in testosterone levels.
Evaluating the effects of the four doses of MYO plus folic acid on the PCOS mice demonstrated that the most effective dose of MYO plus folic acid was 0.36 mg/g because of the relative improvement of ovarian morphology and serological parameters. Accordingly, this dose was considered in the second phase of the study (cellular evaluation). Patel and Carr (Reference Patel and Carr2008) reported that hyperandrogenism with impaired folliculogenesis led to the cessation of follicle growth before maturity, resulting in low-quality oocytes and a high ratio of immature oocytes (GV and MI) to mature oocytes (MII) (Tamura et al., Reference Tamura, Takasaki, Miwa, Taniguchi, Maekawa, Asada, Taketani, Matsuoka, Yamagata, Shimamura, Morioka, Ishikawa, Reiter and Sugino2008). In the DHEA group, as in previous studies (Eini et al., Reference Eini, Novin, Joharchi, Hosseini, Nazarian, Piryaei and Bidadkosh2017), there was a significant decrease in MII oocytes and a significant increase in abnormal morphology and immature oocytes (MI) compared with the control group. MYO reduces hyperandrogenism (Zacchè et al., Reference Zacchè, Caputo, Filippis, Zacchè, Dindelli and Ferrari2009; Unfer et al., Reference Unfer, Facchinetti, Orrù, Giordani and Nestler2017) and plays a key role in calcium homeostasis. MYO is converted to inositol triphosphate (IP3) by phospholipase C, and IP3 can bind to IP3 receptors (IP3R) on the endoplasmic reticulum and induce calcium release. The increased concentration of intracellular and mitochondrial calcium plays a special role in meliorating calcium homeostasis. Numerous studies have documented that IP3-induced calcium release plays a vital role in oocyte maturation during oocyte maturation (Mehlmann and Kline, Reference Mehlmann and Kline1994, Goud et al., Reference Goud, Goud, Van Oostveldt and Dhont1999). As in previous studies (Ciotta et al., Reference Ciotta, Stracquadanio, Pagano, Carbonaro, Palumbo and Gulino2011; Zeng and Yang, Reference Zeng and Yang2018), the present study showed that the injection of an effective dose of MYO plus folic acid (DI2) improved folliculogenesis and significantly increased the percentages of normal morphology and MII oocytes, compared with the DHEA group.
Mitochondria is the main source of calcium homeostasis, ATP (Cardozo et al., Reference Cardozo, Pavone and Hirshfeld-Cytron2011), and intracellular ROS production, and it is the target organ of ROS (Huang et al., Reference Huang, Yu, Gao, Li, Zhang, Zhao, Zhao and Qiao2015). Hyperandrogenism plays a critical role in oxidative stress and apoptosis (Karuputhula et al., Reference Karuputhula, Chattopadhyay, Chakravarty and Chaudhury2013; Ikeda et al., Reference Ikeda, Baba, Morishita, Honnma, Endo, Kiya and Saito2014). Accordingly, hyperandrogenism-induced ROS production directly disrupts mitochondrial function by impairing calcium homeostasis (Wesson and Elliott, Reference Wesson and Elliott1995) and initiates a defective cycle of ROS production in mitochondria (Huang et al., Reference Huang, Yu, Gao, Li, Zhang, Zhao, Zhao and Qiao2015). Consistent with Ying Huang and co-worker’s findings (Huang et al., Reference Huang, Yu, Gao, Li, Zhang, Zhao, Zhao and Qiao2015), this study showed that the DHEA-induced PCOS group had increased intracellular ROS levels and decreased GSH levels compared with the control group. In general, GSH, as a ROS scavenger, plays a significant role in maintaining redox homeostasis (Wang et al., Reference Wang, Tian, Zhang, He, Ji, Li, Tan and Liu2014). In this study, the effects of MYO plus folic acid on the ROS, GSH, and ATP levels of mature oocytes were investigated for the first time in the PCOS mouse model. Our findings indicated that, in the group receiving MYO plus folic acid with an effective dose of 0.36 mg/g, the intracellular levels of ROS and GSH significantly decreased and increased, respectively, compared with the DHEA group. Due to its antioxidant role (Lewin et al., Reference Lewin, Szeinberg and Lepkifker1973), MYO could partly reduce intracellular oxidative stress, maintain the balance of oxidants and antioxidants, and improve mitochondrial function in oocytes.
Any disorder in the mitochondria function affects the ATP production cycle. Safiolina et al. (2006) reported that the administration of DHEA in Wister rats disrupted mitochondrial function and reduced ATP production by inhibiting cellular respiration and transferring the metabolic pathway from oxidative phosphorylation (OXPHOS) to glycolysis. Similar to the findings of Huang et al. (Reference Huang, Yu, Gao, Li, Zhang, Zhao, Zhao and Qiao2015), our findings indicated that, in DHEA-treated mice, the ATP levels markedly decreased compared with the control group (Huang et al., Reference Huang, Yu, Gao, Li, Zhang, Zhao, Zhao and Qiao2015). MYO might reduce mitochondrial stress by decreasing androgen levels (Zacchè et al., Reference Zacchè, Caputo, Filippis, Zacchè, Dindelli and Ferrari2009; Unfer et al., Reference Unfer, Facchinetti, Orrù, Giordani and Nestler2017) and also increase cytosolic and mitochondrial calcium levels by increasing IP3 concentrations, thereby stimulating oxidative metabolism and ATP production (Kockskämper et al., Reference Kockskämper, Zima, Roderick, Pieske, Blatter and Bootman2008; Vitale et al., Reference Vitale, Rossetti, Corrado, Rapisarda, La Vignera, Condorelli, Valenti, Sapia, Laganà and Buscema2016). Our findings also suggested that MYO plus folic acid in the DI2 (0.36 mg/g) group had a positive effect on mitochondrial function, causing a significant increase in the ATP count levels compared with the DHEA model group. Finally, MYO may act via multiple mechanisms to improve mitochondrial function and oocyte quality.
Due to the different physiological conditions between humans and animals, the PCOS model on mice does not fully reflect the status of patients with PCOS. However, our research provided clues to the direct effect of MYO on oocyte cell changes. Finally, the effective dose of MYO determined in the PCOS mouse model in this study provides the grounds for further cellular and molecular studies on this model as a hotbed of research.
Conclusion
In this study, the cellular effects of MYO in the PCOS mouse model were investigated due to the ethical limitations of working on human oocytes. Our findings show that DHEA affects the ovarian morphology of mice by disrupting folliculogenesis and apoptosis. It also increases fasting insulin and testosterone levels, decreases the normal morphology of oocytes, and increases the numbers of immature oocytes compared with mature ones. Moreover, it increases oxidative stress levels while decreasing the GSH levels and the ATP counts. After evaluating several doses of MYO supplementation, the dose of 0.36 mg/g was found to be the most effective due to the positive effects on the return of the oestrous cycle, ovulation, increased G/T ratio, and reduced LAtAnF diameter. This dose increases the quality, normal morphology, and maturation percentage of oocytes. Moreover, the decreased ROS level improves GSH and relieves the decreased ATP levels. However, it does not reduce the level of fasting serum insulin.
Acknowledgements
This field study is part of a Ph.D. dissertation conducted with the support of the Iran University of Medical Sciences, Tehran, Iran. We wish to acknowledge Ardeshir Talebi for his merciful courtesy and effort in the amelioration of the paper.
Financial support
This research received no specific grant from any funding agency, commercial or not-for-profit sectors.
Conflict of interest
The authors declare none.
Ethical standards
The authors assert that all procedures contributing to this work comply with the ethical standards of the National Research Council guidelines (National Research Council, 2011) (Zimmermann, Reference Zimmermann1983) on the care and use of laboratory animals. Advised by the Independent Ethics Committee of IUMS, all protocols used in this study received the necessary approvals with the number IR.Iums. Fmd. Rec.1396.9323113001 from the Internal Affairs Department of Laboratory Animals and Research.


