


Introduction
Glacier retreat is dynamic and can be influenced by several factors, such as topography and atmospheric temperature variability (Nesje & Dahl Reference Nesje and Dahl2000, Cuffey & Paterson Reference Cuffey and Paterson2010). Tidewater and land-terminating glaciers in the Antarctic region are important targets for monitoring dynamic glacial responses and sensitivity to changes in climate (Liang et al. Reference Liang, Peng, Niu, Zhou and Wang2018). Geomorphological changes in glaciers can be considered indicators of environmental fluctuations (Benn & Evans Reference Benn and Evans2010, Knight & Harrison Reference Knight and Harrison2012).
During the second half of the twentieth century, a trend of increase in air temperature was reported in the vicinity of King George Island (KGI), Antarctica (e.g. Ferron et al. Reference Ferron, Simões, Aquino and Setzer2004, Kejna et al. Reference Kejna, Arazny and Sobota2013). In a recent study, Comin & Justino (Reference Comin and Justino2017) additionally showed an increase of 0.8–1.0°C in air temperature during 1955–2010 using data from two meteorological stations (Bellingshausen and Jubany). The average surface air temperature of KGI increased by 1°C from the 1950s to the 2000s (Kejna et al. Reference Kejna, Arazny and Sobota2013). Kejna et al. (Reference Kejna, Arazny and Sobota2013) and Sobota et al. (Reference Sobota, Kejna and Arzany2015) argued that the warming atmospheric trend directly interferes with the mass balance of glaciers in KGI.
Turner et al. (Reference Turner, Lu, White, King, Philips and Scott Hosking2016) showed evidence of a warming trend (+0.32°C) between 1979 and 1997. For the 2001–2010 period, Carrasco (Reference Carrasco2013) identified a decrease in air temperature in the western stations of the Antarctic Peninsula and a slight cooling trend in KGI. These environmental changes are linked to the regional warming trend, which has been observed for several decades, and variations in sea-ice and sea surface temperatures (Li et al. Reference Li, Holland, Gerber and Yoo2014).
The glaciers throughout the KGI have been retreating in recent decades (Kejna et al. Reference Kejna, Arazny and Sobota2013, Simões et al. Reference Simões, Rosa, Czapela, Vieira and Simões2015, Sobota et al. Reference Sobota, Kejna and Arzany2015, Petlicki et al. Reference Petlicki, Szillo, Macdonell, Vivero and Bilaik2017, Pudełko et al. Reference Pudełko, Angiel, Potocki, Jędrejek and Kozak2018, Perondi et al. Reference Perondi, Rosa and Viera2019). Pudełko et al. (Reference Pudełko, Angiel, Potocki, Jędrejek and Kozak2018) observed fluctuations in the glacier outlines of five glaciers in KGI, namely the Ecology, Sphinx, Baranowski, Tower and Windy glaciers, for the 1979–2018 period, and they suggested that the glacier retreat rates were the lowest between 2001 and 2007. Pudełko et al. (Reference Pudełko, Angiel, Potocki, Jędrejek and Kozak2018) affirmed that water-terminating glaciers (Windy, Baranowski and Ecology) with lagoon ice-contact systems and land-terminating glaciers (Tower and Sphinx) have distinct behaviours in the same period of analysis, with the latter exhibiting retreat.
In this paper, we analyse the surface area fluctuations of five glaciers (i.e. Ecology, Sphinx, Baranowski, Tower and Windy) and their proglacial systems located on the west coast of Admiralty Bay, KGI (Antarctica) from 1979 to 2018. In the case of the Ecology Glacier, the glacier surface data (starting in 1956) are analysed. The winter air temperature observations (1956–2018) and tendencies of glacier retreat under various decadal-scale atmospheric temperature trends are analysed for the glaciers of various dimensions and topographies. Furthermore, the retreat patterns of the proglacial systems under various environmental conditions, such as land- and marine-terminating glaciers, are analysed.
Study area
The study area (Fig. 1) is located in the western sector of Admiralty Bay, KGI, which is a part of the Antarctic Specially Managed Area. The study area is composed of five glaciers, namely Ecology, Sphinx, Baranowski, Tower and Windy glaciers, and their proglacial systems.

Fig. 1. Geographical location of Ecology, Sphinx, Baranowski, Tower and Windy glaciers and their ice-free areas in the eastern sector of Warszawa Icefield, King George Island.
Precipitation in KGI is characterized by high annual variability, with an estimated average of 701.3 mm during the 1968–2011 period (Kejna et al. Reference Kejna, Arazny and Sobota2013). The average annual air temperature is approximately −1.5°C, with the average warmest month being January (2.4°C) and the coldest being June (−5.6°C) (2012 observations) (Sobota et al. Reference Sobota, Kejna and Arzany2015). According to Kejna et al. (Reference Kejna, Arazny and Sobota2013), the prevailing wind near Ecology Glacier is katabatic, originating from the Warszawa Icefield, which is domed with an asymmetric shape and ice flow directions towards the west and east (Rachlewicz Reference Rachlewicz1999).
Sziło & Bialik (Reference Sziło and Bialik2018) and Perondi et al. (Reference Perondi, Rosa and Viera2019) discuss the various landforms in the recent proglacial landscape (i.e. striated pavement, eskers, terminal, lateral, latero-frontal, ice-cored and fluted moraines, kames, outwash plains, kettle and moraine-damage lakes, talus slopes, debris flow gullies, meltwater channels and glaciolacustrine and lacustrine landforms). The frontal area of Baranowski Glacier displays rapid geomorphological changes owing to the high variation in sediment particles (Sziło & Bialik Reference Sziło and Bialik2018).
Data and methods
For mass balance analysis, the accumulation area ratio (AAR), which is the ratio of the accumulation area at the end of the melt season to the total glacier area (0–1% or 0–100%), was estimated using the methods of Meier & Post (Reference Meier and Post1962) and Kulkarni (Reference Kulkarni1992). The accumulation area is identified based on snowline altitude estimations using the Sentinel-1B data. The synthetic aperture radar (SAR) C-band data of Sentinel-1B were acquired in March 2017 (after geometric and radiometric corrections) and have a spatial resolution of 5 × 20 m (https://sentinel.esa.int/documents/247904/349449/S1_SP-1322_1.pdf). Various radar surface zones on the glaciers are identified, based on Rau et al. (Reference Rau, Mauz, De Angelis, Jana, Arigony-Neto and Skvarca2004), to estimate the snowline altitudes and AARs. The snowline identification is based on the backscattering characteristics of the Sentinel-1B data (C-band, double polarization, Extra Wide Swath model, Level 1 Product, Ground-Range GRD and Standard - S). The images were processed (radiometric calibration, clipping and application of the 5 × 5 median filter in the NEXT ESA SAR Toolbox) and backscatter limits were obtained (-8 dB threshold is appropriate to delimit the upper boundary line of the frozen percolation radar zone).
The variations in glacier area were identified and vectorized using images from Landsat ETM+ (acquired in January 2007), Sentinel-2 (acquired in March 2018), PlanetScope (acquired in February 2018) (Table I) and WorldView-2 (acquired in March 2014). This was possible owing to the reflectance difference between snow and ice-free areas, as well as those among snow (albedo: 0.8–0.9), exposed ice (albedo: 0.3–0.4) and ice-free land areas (Marshall Reference Marshall2012). The WorldView-2 and Sentinel-2 data were acquired at the end of the ablation season for cloud-free images as well as for better visibility of the glacier termini. Orthorectified WorldView-2 images have a spatial resolution of 0.5 × 2.0 m in their panchromatic and multispectral channels (eight bands). The Sentinel-2 Multispectral Instrument (MSI) data consist of 13 spectral bands, 4 of which have a spatial resolution of 10 m in the wavelength range 490–842 nm (https://sentinel.esa.int/web/sentinel/missions/sentinel-2). The Sentinel-2 images used in this study were obtained from the United States Geological Survey (USGS; https://earthexplorer.usgs.gov) at no cost. Frontal variation data, obtained using SPOT (1988–95 and 2000) imagery, were additionally considered in this study. The glacier area loss data for the 1956–79 period were available for Ecology Glacier (obtained using aerial photographs) at the Polar and Climatic Centre of the Federal University of Rio Grande do Sul, Brazil. The details of the optical satellite data used for this research are summarized in Table I. While an uncertainty of ± 1 pixel is assumed for glaciers with surface areas > 0.1 km2 (Frey et al. Reference Frey, Paul and Strozzi2012), the maximum uncertainty is < 5% for all the datasets, which is within the tolerable range.
Table I. Specifications of the optical satellite data used in this study.
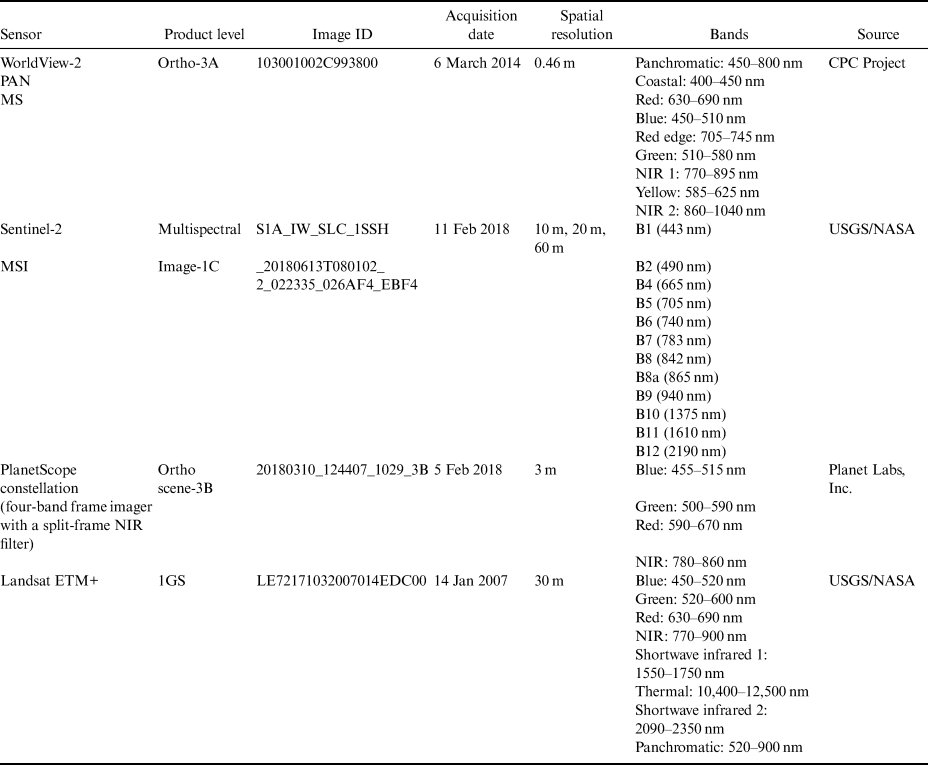
NIR = near-infrared.
The TanDEM-X digital elevation model (DEM) data were used to analyse slopes and elevation changes (maximum and minimum elevation values for each glacier) (Perondi et al. Reference Perondi, Rosa and Viera2019). The DEM used here has a spatial resolution of 12 m and a vertical accuracy of 3.5 m (https://doi.org/10.1594/PANGAEA.863567).
The annual mean surface air temperature data for the study region were scarce and discontinuous and hence were obtained from multiple stations. The Brazilian Comandante Ferraz Antarctic Station (−62.08°S, −58.39°W; 5 m a.s.l.), installed by the Brazilian National Institute for Space Research (INPE), provided data for the 1986–2013 period. The Russian Bellingshausen Station (−62.19°S, −58.94°W; 1 m a.s.l.), located in Fildes Peninsula (30 km from the Brazilian station) in the western part of KGI, provided data for the 1968–76 and 2014–2018 periods. The Polish Henryk Arctowski Station (−62.09°S, −58.28°W; 2 m a.s.l.), located in Admiralty Bay, KGI, provided data for the 1977–85 period. The Argentine Deception Station (−62.59°S, −60.34°W; 7 m a.s.l.), located on Deception Island, South Shetlands (138 km from the Brazilian station), provided data for the 1956–68 period. The method of combining these time series is described in |Ferron et al. (Reference Ferron, Simões, Aquino and Setzer2004) (positive correlation; r > 0.9). In order to analyse the relationship between air temperature and variations in the glacier surface area, the coefficient of determination (r 2) is estimated.
In addition to station observations, the ERA Interim reanalysis data, which are currently being replaced by ERA5 (https://cds.climate.copernicus.eu/cdsapp#!/home), are used in the present study. These data are available at no cost (e.g. https://climatereanalyzer.org) and provide high-quality solutions on a global scale (Auger et al. Reference Auger, Birkel, Maasch, Mayewski and Schuenemann2018) (i.e. ERA Interim solutions are closer to the observations).
The proglacial systems are classified into various zones according to glacial landform and geomorphic intensity (glacial and paraglacial sediment supply, deposition and reworking). The geomorphic analysis is based on previous geomorphological mapping (Sziło & Bialik Reference Sziło and Bialik2018, Perondi et al. Reference Perondi, Rosa and Viera2019) and field observations (January 2011).
Results
Trends in atmospheric temperature and glacier fluctuations
A strong positive correlation between the annual temperature observations from this study and the annual temperature solution from the ERA Interim data is observed over KGI (r > 0.90, P > 0.05), demonstrating that the latter can be used as a good estimate for air temperature in this region (Fig. 2). The atmospheric observations during the 1956–2018 period reveal an increase in the winter average annual temperature (Fig. 3). The eastern sector of Warszawa Icefield shows a loss of 5.1 km2 (30%) in surface area for the 1979–2018 period. The area loss has an r 2 value of 0.6 with the trends observed in the winter air temperature.

Fig. 2. Correlation between annual temperature observations and ERA Interim data for 2 m temperature.

Fig. 3. Historical station data of average annual atmospheric temperature for the winter (June–August) and the summer (January–March) in King George Island from 1956 to 2018.
The surface area loss of Ecology Glacier during 1956–2018 was 1.79 km2 (25% of 7.11 km2 in 1956). During 1979–2018, the individual glacier area losses presented by the Sphinx, Baranowski, Tower and Windy glaciers were 0.36 km2 (21% of 1.70 km2 in 1979), 0.76 km2 (25% of 3.09 km2 in 1979), 1.28 km2 (70% of 1.82 km2 in 1979) and 1.10 km2 (31% of 3.51 km2 in 1979), respectively (Fig. 4 & Table II). (The maximum errors were < 5% for all the data sets.)

Fig. 4. Glacial fluctuations (by period) in eastern sector of Warszawa Icefield, Admiralty Bay.
Table II. Surface areas, accumulation area ratios (AARs) and geomorphometric values of glaciers in the eastern sector of Warszawa Icefield, Admiralty Bay.

For the 5 year period from 1995 to 2000, a fast retreat was observed (0.3 km2 year−1, overall 1.5 km2, which is 8% of 17.2 km2 in 1979) for all of the glaciers studied, particularly for the Ecology, Baranowski and Tower glaciers (Fig. 5 & Table II).

Fig. 5. Variations in individual glacier areas (1956–2018).
However, during the subsequent 18 years (2000–18), the glaciers (with the exception of Windy Glacier) displayed a lower surface area loss rate (4 × 10⁻² km2 year−1), indicating a lower rate of retreat since the 2000 measurement (Fig. 5).
In 1979, the areas of the Ecology, Sphinx, Baranowski, Tower and Windy glaciers were 7.10, 1.70, 3.09, 1.82 and 3.51 km2, respectively. In 2018, the individual surface areas of these five glaciers were estimated to be 5.31, 1.34, 2.34, 0.53 and 2.40 km2, respectively.
Proglacial environment and its recent changes
On Warszawa Icefield, the increase in ice-free areas is estimated to be ~5.1 km2 between 1979 and 2018. The foreland shows three zonations (high, moderate and low geomorphic intensity zones) (Figs 6 & 7). The high geomorphic intensity zone is characterized by recent changes in glacier margins and an elevation class of 50–100 m, and this represents the 2000–18 period. Ice-marginal lakes, meltwater channels, recessional moraines, eskers and flutings are susceptible to intense paraglacial processes. Active slumping occurs on parts of the upper ice-distal faces in association with the steep slopes of the moraines. The moderate geomorphic intensity zone has been a land-free area since the 1970s and is characterized by an elevation class of 0–50 m and discontinuous esker and moraine ridges owing to a gully system. The low geomorphic intensity zone is characterized by old glacial landforms (ice-free land before the 1970s) and an elevation class of 0–25 m, and it exhibits the complete paraglacial sequence. Here, the lakes have lost connection with the glacier margins and there is an absence of eskers and flutings in the smooth terrain. The paraglacial sediments are stored in the outwash plain.

Fig. 6. a. Ice-free land area on the western coast of Admiralty Bay, b. recessional moraines and c. spatial distribution of recessional moraines in proglacial environments in the western sector of Admiralty Bay (photographs were taken during fieldwork in the summer of 2011). LIA = Little Ice Age.

Fig. 7. Landform spatial distribution in foreland with three zones of (high, moderate and low) geomorphic activity.
Windy Glacier shows a predominantly high geomorphic intensity zonation. The proglacial environments of the Baranowski, Tower, Sphinx and Ecology glaciers display three zones of (high, moderate and low) geomorphic activity.
Ecology Glacier has developed new ice-contact lakes at the terminus with meltwater channels supplying the lagoon–Admiralty Bay connection. The analysis of satellite images indicates that, since 1988, a large portion of its frontal sector has terminated on land, with the lagoon becoming partially connected to the central part of the glacier owing to local tidal variations. The landscape displays striated pavements, roche moutonnées, eskers and latero-frontal moraine ridges. Flutings and recessional moraines are observed only in the low geomorphic intensity zone of Sphinx Glacier. The proglacial environment of Tower Glacier displays relatively smaller ice-marginal recessional moraines and a paraglacial sequence at a distance from the glacier margin.
Discussion
The glacial AARs indicate negative mass balances (data acquired in 2018) for the Windy, Sphinx, Baranowski and Ecology glaciers, with AAR values of 0.07, 0.18, 0.35 and 0.45, respectively.
A 10 year running mean of air temperature shows generally colder winters during the 1970s and warmer winters in the 1980s and early 2000s, followed by a cooling trend. However, the annual time series shows high interannual variability in air temperature during these periods. During the 1990s, a retreating trend is observed for all five glaciers.
The differences among the coefficients of determination (0.4–0.7) suggest heterogeneous responses of the glaciers. The glacier retreat patterns for the 1979–2018 period show that the Tower and Windy glaciers present the highest variations in total area (in terms of percentage of surface area loss) compared to the Ecology, Baranowski and Sphinx glaciers, which have lower area losses (Table II).
The Tower and Sphinx glaciers show the lowest areal loss for the 2000–18 period compared with the other three glaciers. This suggests that, on a decadal timescale, glaciers with smaller lengths and areas at the lowest elevation band have been reflecting a cooling trend in the annual air temperature in recent years. Both glaciers have lower areas compared with the other glaciers considered in this study. Sphinx Glacier has lower frontal elevation and higher AAR, length and maximum elevation values than Tower Glacier, but has higher slope values (Table II).
Ecology Glacier presents a high areal loss without variation in frontal elevation and a recent deceleration in retreat (2000–2018) (Table II). The observed variations in area and elevation reveal the influence of the low maximum elevation, AAR value and anchor points on the ice flow. This observation is in good agreement with the results presented by Petlicki et al. (Reference Petlicki, Szillo, Macdonell, Vivero and Bilaik2017) and Pudełko et al. (Reference Pudełko, Angiel, Potocki, Jędrejek and Kozak2018).
Sphinx Glacier shows the lowest change in surface area, which reveals the influences of hypsometric weight, length and AAR on glacier retreat (Table II). Baranowski Glacier displays higher frontal elevation variation (2000–18) than the other glaciers (with the exception of Windy Glacier) and can be influenced by high slope values at the snout.
Some adjacent glaciers with similar maximum elevation, such as Baranowski, Sphinx and Windy, show significant heterogeneous areal loss, possibly owing to differences in AAR, length and topographical or glacio-geomorphological characteristics. Windy Glacier exhibits the highest variation in frontal elevation and higher shrinkage compared with the other glaciers considered in this study. This glacier presents an important change in its environmental conditions, where its classification has changed from a marine-terminating to a land-terminating glacier (non-tidewater). Glasser et al. (Reference Glasser, Scambos, Bohlander, Truffer, Pettit and Davies2011) noted that the dynamics of land-terminating glaciers are related primarily to climatic conditions. Windy Glacier was marine-terminating until approximately the mid-1990s. Pudełko et al. (Reference Pudełko, Angiel, Potocki, Jędrejek and Kozak2018) confirmed that Windy Glacier lost its connection with the lagoon between 2011 and 2018. From this environmental change, it is possible to understand the deceleration in glacier retreat during the 1995–2018 period compared with those in previous years (1988–95).
Windy Glacier's behaviour is impacted by the loss of marine influence and it has anchor points on the ice flow, as Rau et al. (Reference Rau, Mauz, De Angelis, Jana, Arigony-Neto and Skvarca2004) comment. There are differences in terms of frontal retreat rates between terrestrial and marine glaciers, wherein the frontal retreat rates of glaciers are higher for tidewater-terminating glaciers than for land-terminating ones (Sole et al. Reference Sole, Payne, Bamber, Nienow and Krabil2008). Tidewater glaciers present complex dynamics as their mass balance and dynamic behaviour are affected by various elements, such as climate, ocean conditions, form, total precipitation and surface melting (Cook et al. Reference Cook, Murray, Luckman, Vaughan and Barrand2012). Furthermore, the frontal ablation of tidewater glaciers is influenced by wave dynamics and sea surface temperatures (Luckman et al. Reference Luckman, Benn, Cottier, Bevan, Nilsen and Inall2015).
The retreat patterns of land-terminating glaciers (non-marine) in this region are influenced by proglacial as well as subglacial conditions. Eskers, flutings, striated pavements and roche moutonnées indicate a wet-based thermal regime for glaciers and can be influenced by glacial movement owing to bedrock sliding. Tower Glacier does not exhibit eskers and flutings owing to its lower glacier dynamics (decreased ice-flow velocity and glacial sediment transport). The absence of glaciofluvial landforms shows low sediment transport by subglacial meltwater channels owing to stagnated ice flow.
Pudełko et al. (Reference Pudełko, Angiel, Potocki, Jędrejek and Kozak2018) reported that the glacier retreat pattern of land-terminating glaciers in this region is influenced by proglacial ice-contact anchor points on the frontal ice flow and the presence of glacier–lagoon connections. The Ecology and Baranowski glaciers present glacier–lagoon connections different from other land-terminating glaciers. Petlicki et al. (Reference Petlicki, Szillo, Macdonell, Vivero and Bilaik2017) argue that Ecology Glacier had some areas in which the frontal position was stable compared with those of the other glaciers during the 2012–16 period.
Compared with the Collins and Polar Club glaciers (KGI), the five glaciers studied here (Ecology, Sphinx, Baranowski, Tower and Windy) present moderate to high shrinkage rates (0.05, 0.01, 0.01, 0.03 and 0.03 km2 year−1, respectively) and greater percentages of surface area loss since 1979 (70% for Tower Glacier). The retreat rates observed for these five glaciers encompass more area (in terms of percentage) than those of the Collins, Polar Club, Dragon, Professor and Wanda glaciers (which are also located on KGI) in recent decades.
Pudełko et al. (Reference Pudełko, Angiel, Potocki, Jędrejek and Kozak2018) observed variations in the frontal retreat of glaciers, showing that 6.1 km2 of ice-free areas were formed. However, our results show a surface area loss that is 16% lower (5.1 km2) than the estimates of Pudełko et al. (Reference Pudełko, Angiel, Potocki, Jędrejek and Kozak2018) owing to differences in spatial analyses in estimating the total area of Windy Glacier, excluding the Dera Ice Fall sector.
The foreland spatial zonation (high, moderate and low geomorphic intensities) suggests proglacial lake changes in years to decades. The paraglacial sequence is recorded in glacier forelands as an increase in slope stability, decrease in lateral erosion, enhancement in sediment deposition and vegetation establishment with exposition age. The temporal paraglacial adjustment has been suggested by Heckmann & Morche (Reference Heckmann and Morche2019).
Generally, the glacier shrinkage observed in the eastern sector of Warszawa Icefield is related to regional climate variability. Braun & Goßmann (Reference Braun, Goßmann, Beyer and Boelter2002) argue that the significant decline in land-terminating glaciers shows the changing parameters controlling glacier mass balance, particularly atmospheric temperature.
Conclusions
A high retreating trend was observed for the Ecology, Sphinx, Baranowski, Tower and Windy glaciers in the 1990s. The winter air temperature was cooler during the 1970s, with warming trends in the 1980s and early 2000s, followed by cooling to date.
It is observed that glaciers in the same icefield (Warszawa Icefield) exhibit various retreat rates and thus contradictory glacier responses to climate change under the influence of various environmental factors. The glaciers show a deceleration in retreat during the 2000–18 period compared to the 1979–2000 period, demonstrating that glaciers with smaller areas can reflect, on a decadal timescale, a cooling trend, as is seen in the annual air temperature recorded in recent years. It is worth noting that a number of other factors (e.g. oceanic, atmospheric, topographic and inherent glacier systems) influence the temperature trend and fluctuations in glaciers at decadal timescales in addition to topography and atmospheric temperature.
Windy Glacier presented an important change: its terminus position changed from tidewater to land conditions during the 2000–18 period, thus modifying its surrounding conditions, and it has displayed a deceleration in retreat in recent years.
Briefly, the understanding of the dynamic behaviours of land-terminating glaciers in this sub-polar region is relevant to the detection of regional environmental changes through investigations into the geomorphological evolution of ice-free areas.
Acknowledgements
We acknowledge Dr Mathias Braun for the TanDEM-X data and Planet Team, Planet Application Program Interface and the Brazilian National Council for Scientific and Technological Development (CNPq).
Author contributions
All authors analysed the data and wrote the paper.
Financial support
This work is a contribution of the Antarctic Science reviewers, Brazilian Antarctic Program (PROANTAR), and is supported by research grants from the Foundation for Research Support of the State of Rio Grande do Sul (FAPERGS). Cleiva Perondi is thankful to the Brazilian Coordination for the Improvement of Higher Education Personnel (CAPES) for a scholarship.


