

doi: https://doi.org/10.1557/jmr.2017.451, Published by Cambridge University Press, 2 January 2018
In Youssry et al.Reference Youssry, Guyomard and Lestriez1, the incorrect image was provided for Fig. 5. The correct figure is below.
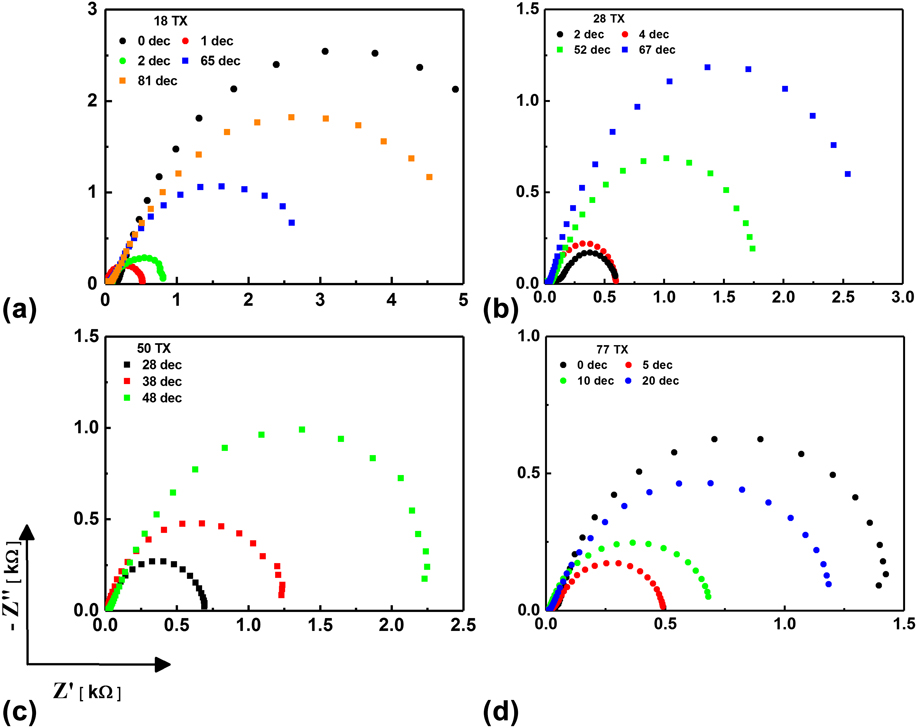
FIG. 5. Impedance spectra, represented by Nyquist plots (imaginary Z” versus real Z’ component of impedance), of 2 wt% KB in L1 (circles) and L2 (squares) microemulsions at rest, at 25 °C (at 100 mV).

