


Introduction
The Mini-Mental State Examination (MMSE) is often used to screen for dementia (Tsoi et al., Reference Tsoi, Chan, Hirai, Wong and Kwok2015). With tens of thousands of scientific publications in the 40 years since its inception, MMSE has become one of the most widely used cognitive tests globally (Folstein et al., Reference Folstein, Robins and Helzer1983). The Modified Mini-Mental State Examination (3MSE, aka 3MS) is an adaptation of MMSE, with four additional test items (long-term memory, semantic fluency, abstract thinking, and one additional verbal memory task), standardized administration and scoring instructions, and an expanded, more interpretable score range (McDowell et al., Reference McDowell, Kristjansson, Hill and Hébert1997; Teng & Chang Chui, Reference Teng and Chang Chui1987; Tombaugh et al., Reference Tombaugh, McDowell, Kristjansson and Hubley1996). Many psychometric studies of MMSE or 3MSE have focused on single populations, with an inclusion bias towards Non-Hispanic Whites (NHW), although some normative score differences comparing racial/ethnic groups have been published (Rapp et al., Reference Rapp, Espeland, Hogan, Jones and Dugan2003; Ryan et al., Reference Ryan, Woods, Britt, Murray, Shah, Reid, Kirpach, Wolfe, Nelson, Lockery, Orchard, Trevaks, McNeil and Storey2019; Sink et al., Reference Sink, Craft, Smith, Maldjian, Bowden, Xu, Freedman and Divers2015). Prior research in American Indians has demonstrated population-wide performance on 3MSE and other cognitive tests is overall low, compared with NHW and other groups, suggesting potential test invalidity for minoritized groups (A. Suchy-Dicey et al., Reference Suchy-Dicey, Oziel, Sawyer, Olufadi, Ali, Fretts, Umans, Shibata, Longstreth and Grabowski2022; A. Suchy-Dicey et al., Reference Suchy-Dicey, Verney, Nelson, Barbosa-Leiker, Howard, Crane and Buchwald2020; Verney et al., Reference Verney, Suchy-Dicey, Cholerton, Calhoun, Nelson, Montine, Ali, Longstreth and Buchwald2019). Socioeconomic disparities account for some of the observed discrepancies in race-associated cognitive performance (Galvin et al., Reference Galvin, Chrisphonte and Chang2021; McCann et al., Reference McCann, McNulty, Rigby, Hughes, Hoey, Molloy, Cunningham, Casey, Tracey, O’Kane, McCarroll, Ward, Moore, Strain and Moore2018; Zahodne et al., Reference Zahodne, Sharifian, Kraal, Zaheed, Sol, Morris, Schupf, Manly and Brickman2021; Zahodne et al., Reference Zahodne, Sol and Kraal2019), indicating race may be a proxy for underlying social and institutional inequities (Avila et al., Reference Avila, Renteria, Witkiewitz, Verney, Vonk and Manly2020). However, incomplete social determinant models maintain race as a convenient, albeit inadequate, substitute for complex, latent constructs driving differences in test performance.
Normative adjustment or standardization for sociodemographic factors – including race – continues to be a common contextualization tool when assessing cognition in diverse populations (Lezak, Reference Lezak2012). Nevertheless, normalization carries key limitations that are easily overlooked, and neuropsychologists are divided on the best methods for comprehensive and equitable cognitive evaluation of minoritized elders (Brickman et al., Reference Brickman, Cabo and Manly2006; Byrd & Rivera-Mindt, Reference Byrd and Rivera-Mindt2022; Fernandes et al., Reference Fernandes, Ayede and Blackmon2022). Furthermore, racial and ethnic representation in neuropsychology research has been critically inadequate. For example, despite heavy lifetime risk for vascular and Alzheimer’s dementias (Kim et al., Reference Kim, Bryant, Goins, Worley and Chiriboga2012; Livingston et al., Reference Livingston, Huntley, Sommerlad, Ames, Ballard, Banerjee, Brayne, Burns, Cohen-Mansfield, Cooper, Costafreda, Dias, Fox, Gitlin, Howard, Kales, Kivimäki, Larson, Ogunniyi, Orgeta, Ritchie, Rockwood, Sampson, Samus, Schneider, Selbæk, Teri and Mukadam2020), population-based psychometrics and normative score estimates have yet to be undertaken among any U.S. Indigenous populations, including American Indians, for most standardized cognitive tests, including 3MSE (Mehta & Yeo, Reference Mehta and Yeo2017; Verney et al., Reference Verney, Suchy-Dicey, Cholerton, Calhoun, Nelson, Montine, Ali, Longstreth and Buchwald2019).
Validity of MMSE and 3MSE scores
Psychometric evaluation of validity is critical to the interpretation of test score distributions as well as for making individual clinical decisions, including claims about cognitive domains or functional status. An integrated method to examine multiple points of validity is the Kane framework (Cook et al., Reference Cook, Brydges, Ginsburg and Hatala2015; Kane, Reference Kane2013), wherein inference for valid interpretation involves evaluation of model fit, including structural components such as sub-scores; generalizability inference covers consistency, reliability, stability; and inference of extrapolation covers differences due to population stratification, for example by sociodemographics. Overall, this framework provides a more integrated, structured view of psychometric validity. Existing points of evidence in this validity framework for 3MSE in the majority population include inter-rater reliability (Pearson’s r = 0.98, (Bassuk & Murphy, Reference Bassuk and Murphy2003; Teng & Chang Chui, Reference Teng and Chang Chui1987)), internal consistency-reliability (Cronbach’s alpha = 0.82 to 0.87, (McDowell et al., Reference McDowell, Kristjansson, Hill and Hébert1997; Tombaugh et al., Reference Tombaugh, McDowell, Kristjansson and Hubley1996)), test-retest reliability or score stability (r = 0.80, (Grace et al., Reference Grace, Nadler, White, Guilmette, Giuliano, Monsch and Snow1995)), and inter-test comparisons (MMSE: MCI threshold < 28/30, ROC 0.74; 3MSE: MCI threshold < 95/100, ROC 0.85 (Van Patten et al., Reference Van Patten, Britton and Tremont2019)). Compared to MMSE, 3MSE explains more variance in overall cognition and domain-specific tasks related to language and memory but not for attention, visuospatial, or executive function (Van Patten et al., Reference Van Patten, Britton and Tremont2019).
Cultural factors in MMSE and 3MSE testing
Intended as a dementia screening and evaluation tool, MMSE and 3MSE sample multiple cognitive domains likely to reflect a range of human experiences common among persons from diverse backgrounds (Teng & Chang Chui, Reference Teng and Chang Chui1987). However, the dearth of formal investigations and adaptations among cultural minorities raises uncertainty about its cross-cultural applications. Differential scores across groups of Canadian native language speakers suggest key, latent linguistic and cultural influences on test performance (Bravo & Hébert, Reference Bravo and Hébert1997). Furthermore, translation concerns have also been raised, in part because of modifying effects of education on bilingualism in test scores (McDowell et al., Reference McDowell, Kristjansson, Hill and Hébert1997). Education is a critical contextual factor in cognitive test performance and score interpretation (Bassuk & Murphy, Reference Bassuk and Murphy2003; Bravo & Hébert, Reference Bravo and Hébert1997; Tschanz et al., Reference Tschanz, Welsh-Bohmer, Plassman, Norton, Wyse and Breitner2002), and is also likely to impact score performance outside of any effect on language. Differences in educational tenure and quality can impact cognitive status and test performance via test familiarity and anxiety. Overall, both linguistic and educational differences appear to influence MMSE and 3MSE test contextualization and adaptation in minoritized populations, with the exclusion of one or the other factor likely to result in information bias and misidentification of case status (Manly et al., Reference Manly, Jacobs, Sano, Bell, Merchant, Small and Stern1998). Thus, to enable valid interpretations for MMSE or 3MSE scores, key educational, linguistic, and sociodemographic factors must be considered.
MMSE and 3MSE testing in American Indian elders
Although normative score ranges in NHW, African American, and Hispanic/Latino populations have been published (Rapp et al., Reference Rapp, Espeland, Hogan, Jones and Dugan2003; Ryan et al., Reference Ryan, Woods, Britt, Murray, Shah, Reid, Kirpach, Wolfe, Nelson, Lockery, Orchard, Trevaks, McNeil and Storey2019; Sink et al., Reference Sink, Craft, Smith, Maldjian, Bowden, Xu, Freedman and Divers2015), there is limited prior information on MMSE or 3MSE scores among American Indian populations. A small study of MMSE in 140 American Indian elders described summary scores, with cross-sectional associations to sex and education but not age (L. L. Jervis et al., Reference Jervis, Beals, Fickenscher and Arciniegas2007), as well as longitudinal determinant associations from age, education, income, and healthcare access (L. L. Jervis et al., Reference Jervis, Fickenscher, Beals, Cullum, Novins, Manson and Arciniegas2010). In that population-based study, MMSE scores were generally low, compared with published scores for other populations, but not consistent with the approximate 11% who had self-identified cognitive impairment, suggesting standard clinical thresholds may need reconsideration (Crum et al., Reference Crum, Anthony, Bassett and Folstein1993). The Women’s Health Initiative also published 3MSE score ranges for N = 26 American Indian or Alaska Native females (age 65–80) out of 7480 (0.3%) total participants (Rapp et al., Reference Rapp, Espeland, Hogan, Jones and Dugan2003), a critical underrepresentation for a group numbering an estimated 10 M and comprising >3% of the US population (Census, 2020). In that study, 3MSE score ranges for American Indians and Alaska Natives were not substantively different from other racial/ethnic groups and did not differ substantively by age group. However, in a much larger, population-based examination from the Strong Heart Study (SHS), with N = 818 American Indian participants from both sexes (aged 65–95), 3MSE score ranges were overall lower than previously published scores, including those of the same-age in the general population as well as those of American Indian and Alaska Native identity in the Women’s Health Initiative; in the SHS report, 3MSE mean scores fall below standard clinical thresholds for mild cognitive impairment and dementia (Ryan et al., Reference Ryan, Woods, Britt, Murray, Shah, Reid, Kirpach, Wolfe, Nelson, Lockery, Orchard, Trevaks, McNeil and Storey2019; Tombaugh et al., Reference Tombaugh, McDowell, Kristjansson and Hubley1996; Verney et al., Reference Verney, Suchy-Dicey, Cholerton, Calhoun, Nelson, Montine, Ali, Longstreth and Buchwald2019).
Further examination of score ranges across SHS population strata detected cross-sectional associations of test performance with age and education but not sex or language use (bilingual). Of key consideration, a majority of living American Indian elders in this age range are survivors of Indian boarding schools, one component of a 300-year U.S. federal policy which resulted in considerable childhood mortality, physical and psychological trauma, cultural inculcation, linguistic alienation, cultural erasure, and poor quality learning experiences (Brave Heart & DeBruyn, Reference Brave Heart and DeBruyn1998; Verney et al., Reference Verney, Bennett and Hamilton2015). Accordingly, educational tenure is likely to be a poor representation of true crystallized intelligence and intellectual achievement in this population (A. Suchy-Dicey et al., Reference Suchy-Dicey, Oziel, Sawyer, Olufadi, Ali, Fretts, Umans, Shibata, Longstreth and Grabowski2022), and many affected elders are likely to have significant test anxiety and other performance considerations. These findings emphasize the importance of independent characterization of psychometric validity and performance factors in cognitive testing in this population.
Theory
This report comprises several psychometric inferences of 3MSE validity in a large, heterogeneous, population-based cohort of American Indian participants aged 65–95 years (Kane, Reference Kane2013; A. M. Suchy-Dicey et al., Reference Suchy-Dicey, Shibata, Best, Verney, Longstreth, Lee, Okin, Devereux, O'Leary, Ali, Jensen, Muller, Nelson, Rhoades, Madhyastha, Grabowski, Beauchamp, Umans and Buchwald2016). First, a scoring inference was assessed by examining 3MSE factor structure to evaluate how responses on the instrument match the underlying theory on which MMSE and 3MSE were constructed. Second, a generalizability inference was examined for internal consistency-reliability, and for test-retest score stability in 3MSE scores. Third, an extrapolation inference examined group differences and differential indicator functioning to evaluate differences in individual tasks across age, sex, education, and bilingual strata. Altogether, this work provides insights into how well 3MSE measures cognitive functioning overall and within specific domains; whether cultural, linguistic, or other test adaptations need to be considered; and whether any cautions or recommendations for clinical interpretation are warranted.
Methods
Setting
In 1989–1991, the Strong Heart Study recruited middle-aged individuals claiming heritage from any of 13 partnering American Indian tribes and communities in the Northern Plains, Southern Plains, and Southwest U.S. (Lee et al., Reference Lee, Welty, Fabsitz, Cowan, Le, Oopik, Cucchiara, Savage and Howard1990). From 2010 to 2013 and again in 2017 to 2019, all surviving Strong Heart Study participants (then aged 65–95) were invited to undergo cognitive testing, brain imaging, and clinical examination as part of the Cerebrovascular Disease and its Consequences in American Indians (CDCAI) study (A. M. Suchy-Dicey et al., Reference Suchy-Dicey, Oziel, Sawyer, Olufadi, Ali, Fretts, Umans, Shibata, Longstreth and Grabowski2022; A. M. Suchy-Dicey et al., Reference Suchy-Dicey, Shibata, Best, Verney, Longstreth, Lee, Okin, Devereux, O'Leary, Ali, Jensen, Muller, Nelson, Rhoades, Madhyastha, Grabowski, Beauchamp, Umans and Buchwald2016; A. M. Suchy-Dicey et al., Reference Suchy-Dicey, Shibata, Madhyastha, Grabowski, Longstreth and Buchwald2017). Every effort was made for complete cohort ascertainment at all phases, with 75–86% successful recruitment rates. In accordance with the Helsinki declaration and with sovereign tribal agreements, all participating tribal review boards, Indian Health Service, and institutional IRBs approved study activities, and all participants provided written informed consent.
Measures
Both CDCAI examination visits (Visit 1, Visit 2) involved similar protocols. Participants completed self-reported history and behavioral questionnaires with measures including sex (male, female), age (years), years of education (12 or fewer; 13 or more), and speaking ability in their Native language (moderately or very well; not at all or a little). Combined with the cohort eligibility requirement that all participants be fluent in English, the language variable represents bilingual or multi-lingual speaking ability. Field center staff trained in administration of neuropsychological examinations conducted cognitive testing interviews, including 3MSE.
The 3MSE consists of 40 individual tasks scored on a summary 100-point scale (Teng & Chang Chui, Reference Teng and Chang Chui1987). The overall score is intended to represent overall or general cognition, with subitems for attention, concentration, long and short-delay verbal memory, orientation to time and place, expressive and receptive language, semantic fluency, constructional praxis, and abstract thinking. In this test, participants were asked to state the place and date of their birth, including town, state, year, month, and day (orientation: 5 points). Registration trials for a verbal memory task involved repeating three words with up to five repetitions for encoding, although only the first trial was scored (registration: 3 points). The mental reversal tasks involved asking participants to count backward from 5, and to spell a five-letter word backward (reversal: 7 points). The first (short delay) recall trial asked participants to repeat the three memory-task words, with semantic and phonemic cues provided as needed (recall1: 9 points). Temporal orientation asked for year, month, date, day of the week, and season (temporal: 15 points). Spatial orientation asked for state, county, city, and specific location/building (spatial: 5 points). Participants were asked to name five body parts, identified by pointing (name: 5 points). A timed task asked participants to name as many four-legged animals as possible in thirty seconds (animals: 10 points). A similarities or abstract thinking task asked participants to provide an expression for how three sets of two items are similar (similarities: 6 points). A verbal repetition task involved repeating a phrase (repetition: 5 points). A written instructional task involved obeying instructions to “close your eyes” (obey: 3 points). A writing task involved writing a five-word sentence within one minute (write: 5 points) and a simple figure was provided for copying within one minute (pentagons: 10 points). A verbal instruction task was given, wherein participants were asked to grasp, fold, and return a sheet of paper (command: 3 points). Finally, the second (long delay) recall trial of the three memory-task words, with cues provided if needed, was administered (recall2: 9 points). Two trained reviewers evaluated item performance and individual task scores for accuracy and consistency over the entire cohort. A panel of neuropsychology and epidemiology experts reviewed any items with scoring inconsistency, disagreement, or uncertainty to reach consensus scoring for those items.
Analysis: Inference of validity in score interpretation
Inference of scoring evaluated whether summary (unifactorial model) or multiple scores (multifactorial models) accurately capture intended test constructs, using confirmatory factor analysis with robust maximum likelihood estimation (Finney & DiStefano, Reference Finney and DiStefano2013). Model fit was evaluated using standard indices and criteria, including Root Mean Square Error of Approximation (RMSEA < 0.08) (Brown, Reference Brown2015), Standardized Root Mean Square Residual (SRMR < 0.05) (Muthén, Reference Muthén1989), and Comparative Fit Index (CFI > 0.90) (Browne & Cudeck, Reference Browne and Cudeck1992). The chi-square test, which is sensitive to sample size, assessed model-data fit with a significant value (p < 0.01), indicating a lack of fit. First, a unidimensional (1-factor) model was examined, based on MMSE/3MSE creator intent and manual instructions (Teng & Chang Chui, Reference Teng and Chang Chui1987). Additionally, 3-and 4-factor models were considered based on secondary findings from other populations. The 3-factor model included factors for learning, recall, and executive functioning (LREF: recall 1, recall 2, animal, repetition, similarities, reversal, registration, temporal tasks); orientation (OA: name, orientation, spatial tasks); and psychomotor ability (PA: command, obey, write, pentagons tasks) (Cappeliez et al., Reference Cappeliez, Quintal, Blouin, Gagne, Bourgeois, Finlay and Robillard1996; Klyce et al., Reference Klyce, Pugh and Perrin2021). The 4-factor model included verbal-episodic memory (VEM: recall 1, recall 2); language and executive function (LEF: animal, command, name, obey, repetition, similarities tasks); psychomotor and working memory (PWM: reversal, write tasks); and orientation and visuo-construction (OVC: orientation, pentagons, registration, spatial, temporal tasks) (Ryan et al., Reference Ryan, Woods, Britt, Murray, Shah, Reid, Kirpach, Wolfe, Nelson, Lockery, Orchard, Trevaks, McNeil and Storey2019). As an extension of the 4-factor model, a second-order model was examined (Petrill et al., Reference Petrill, Luo, Thompson and Detterman1996).
Analysis: Inference of generalizability and reliability
Inference of generalizability assesses whether test scores are a legitimate representation of the assessment universe, in accordance with the larger validity framework (Kane, Reference Kane2013). For inference of generalizability, we used omega (ω) coefficient as an estimate of internal consistency-reliability to quantify the amount of random measurement error that exists in a given score (McDonald, Reference McDonald1999). Omega was used as the reliability estimate because it is more robust than Cronbach’s alpha coefficient against potentially unmet assumptions, such as that all test items have the same relationship with the underlying construct, also called tau equivalence. Omega values >0.9 and >0.8 are considered adequate for valid interpretation in clinical and research evaluation purposes, respectively (Nunnally, Reference Nunnally1994).
Lambda (λ) coefficients, or factor loadings, were estimated to reflect the correlation between an individual item, i.e., a single task on the 3MSE, and its given factor, e.g., one of the four groups of tasks (VEM: verbal-episodic memory, etc.). Lambda ranges from 0 to 1, with higher values representing a greater correlation between an individual item and the overall factor; values of lambda >0.3 are conventionally considered to reflect a moderate degree of correlation (Comrey & Lee, Reference Comrey and Lee1992; Pett et al., Reference Pett, Lackey and Sullivan2003).
Similarly, test-retest reliability or score stability was measured using Pearson’s correlation coefficient (r) to examine whether conditions of observation, or occasion of administration, unduly influence variance across subgroups or, to put it another way, represent samples of the universe of conditions for the domains assessed. Coefficients were estimated across strata for sex, age, language, education, and by examination visit; coefficients above 0.60 are consistent with score stability (Diedenhofen & Musch, Reference Diedenhofen and Musch2015). The mean 6.7-year interval in this study is similarly structured to prior psychometric, stability studies on 3MSE with multi-year intervals (Tombaugh, Reference Tombaugh2005).
Analysis: Inference of extrapolation
Inference of extrapolation examined whether test scores differ across age, sex, language, and education strata using multiple indicator multiple cause (MIMIC; Figure 1) structural equation models. MIMIC is an extension of confirmatory factor analysis with covariates, such as sociodemographics, and is typically used to contextualize latent variable effects on factors of interest by estimating manifest variable effects. The available (e.g., sociodemographic) variables are named “cause” variables in the model name; however, there is no implication of causal effect, so they are sometimes also called exogenous variables. In step 1, a MIMIC regression model is fitted, with each of the four factors included (age, sex: males vs. females, education: ≤12 or 13+ years, and language/bilingual ability: not at all/a little vs. moderately/ very well) to examine group differences in 3MSE scores. Results of this step in MIMIC modeling include the estimation of regression coefficients (γ) or the association of the manifest variable on the latent variable. Group differences are estimated across strata using Cohen’s d statistic, wherein 0.2, 0.5, and 0.8 represent small, medium, and large effect sizes, respectively (Lenhard & Lenhard, Reference Lenhard and Lenhard2016). Benjamini-Hochberg false discovery rate is used to control Type I Error due to multiple comparisons (Benjamini & Hochberg, Reference Benjamini and Hochberg1995). In step 2, differences between bilingual and non-bilingual groups, independent of effects from sex, age, and education, were estimated based on linear regression coefficients (β) of the overall score and each factor sub-score, thus estimating a direct, independent path from language factor to each individual item.
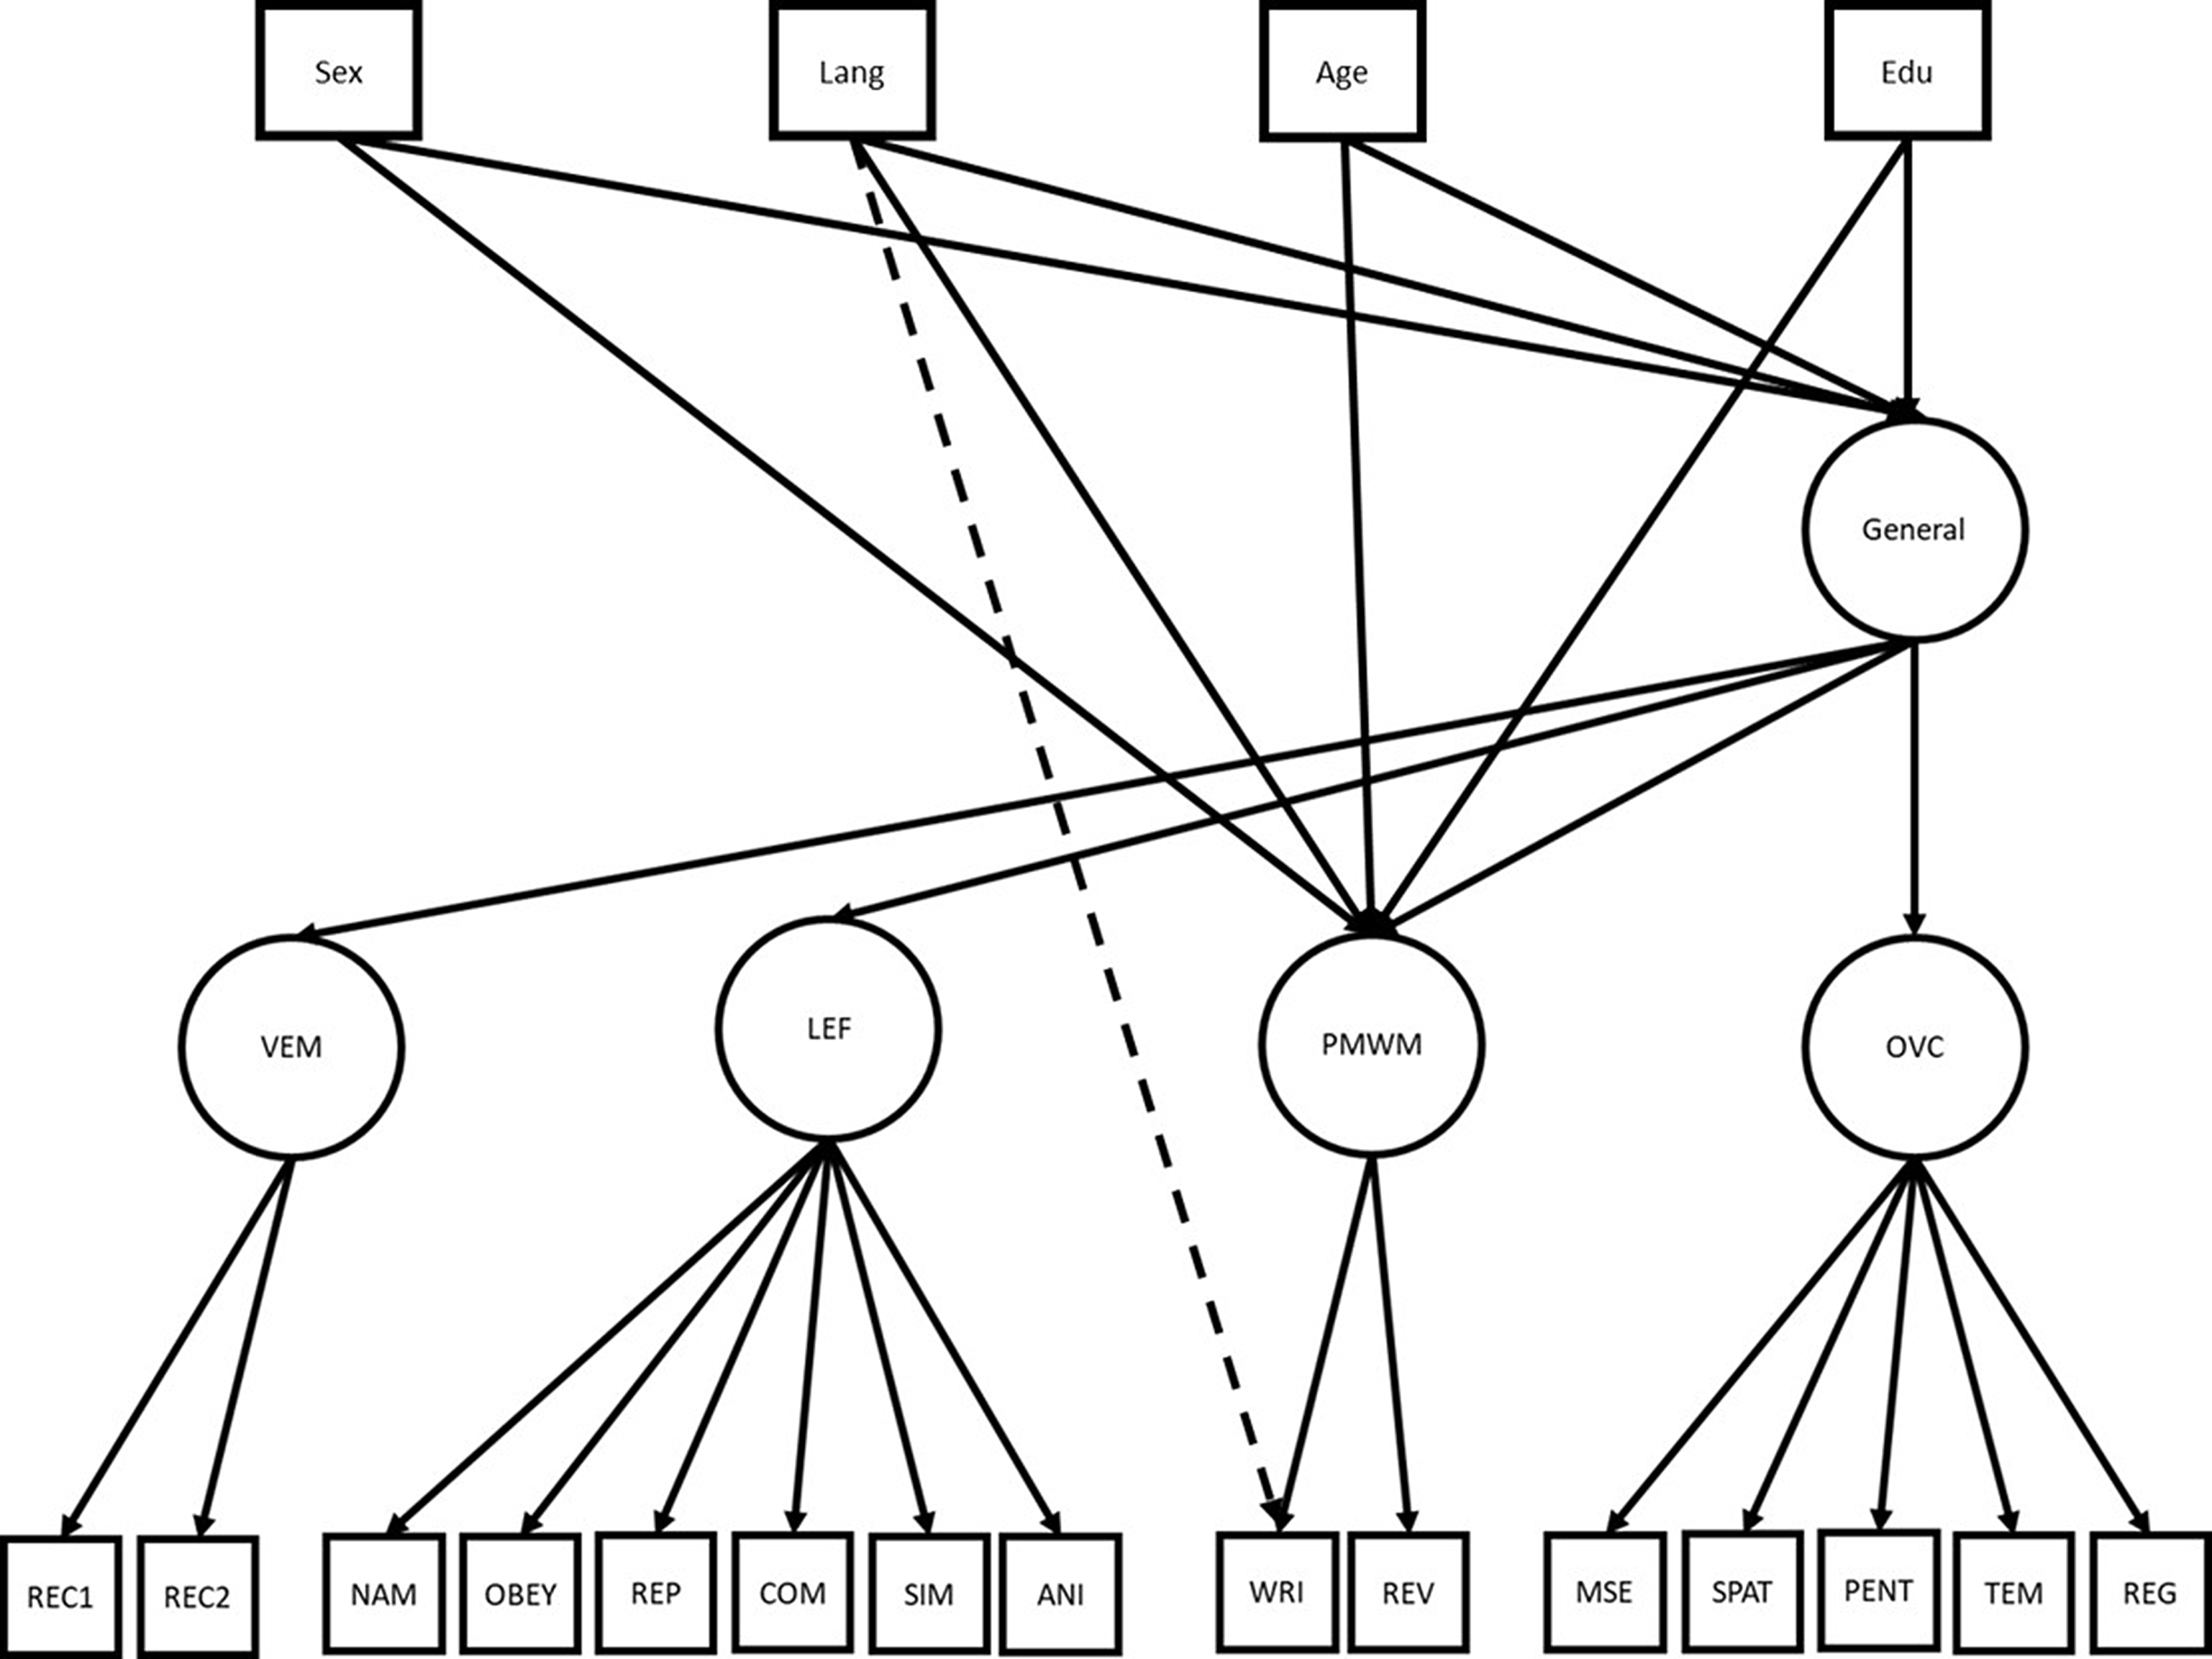
Figure 1. MIMIC Model for detecting subgroup differences in Modified Mini Mental Status Examination (3MSE) scores, with an example given for the tasks “Write” while controlling for Overall (total score) aka “General” and for four first-order factors. Lang represents bilingual speaking ability; Edu: tenure of formal education in years; VEM: Verbal Episodic Memory; LEF: Language and Executive Function; PMWM: Psychomotor & Working Memory; OVC: Orientation & Visuo-construction. Individual items represent single tasks on 3MSE, including Rec1: short-delay word list, Rec2: long delay word list, Nam: name body parts, Obey: written instructional task, Rep: verbal repetition, Com: verbal instructional task, Sim: abstract similarities, Ani: animal naming, Wri: writing task, Rev: mental reversal, Mse: orientation and personal details, Spat: spatial orientation, Pent: figure drawing, Tem: temporal orientation, Reg: registration.
All analyses were conducted using Mplus 2017 (Los Angeles, CA) and SPSS v27 (IBM Corporation, Armonk, NY). Missing or incomplete data affected <1% of cohort participant records, and only complete records were included in analyses. Data from Visit 1 were used for analyses on score interpretation, generalizability, consistency, and stability; data from both Visit 1 and Visit 2 were used for analyses on test-retest score stability, and extrapolation.
Results
Participant characteristics are presented in Table 1. As previously reported, CDCAI recruited N = 818 participants in 2010–2013, then aged 64-95, with 86% recruitment from prior SHS visits (A. M. Suchy-Dicey et al., Reference Suchy-Dicey, Shibata, Best, Verney, Longstreth, Lee, Okin, Devereux, O'Leary, Ali, Jensen, Muller, Nelson, Rhoades, Madhyastha, Grabowski, Beauchamp, Umans and Buchwald2016); in 2017–2019, N = 403 of these participants, then aged 71–93, returned for a follow-up, representing 78% recruitment (A. Suchy-Dicey et al., Reference Suchy-Dicey, Oziel, Sawyer, Olufadi, Ali, Fretts, Umans, Shibata, Longstreth and Grabowski2022). The main causes of attrition between examination visits included mortality and frailty. Very few were missing needed data for these analyses: n = 4 (0.5%) at Visit 1, n = 1 (0.2%) at Visit 2. The majority were female, had approximately 12 years of education, and were at least minimally bilingual, speaking both English fluently (a study requirement) and their Native language either moderately or very well. Scores on the 3MSE total, subscale, and factor item were similar between the two visits.
Table 1. Select sociodemographic and cognitive test score characteristics for American Indian participants from CDCAI Visit 1 (2010–2013) and Visit 2 (2017–2019)
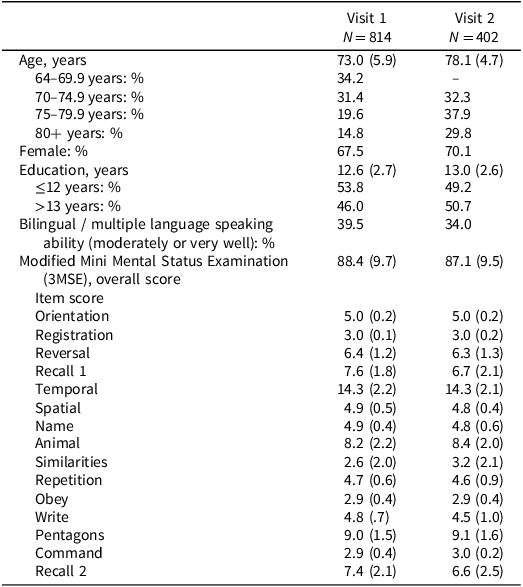
Note: Scores presented as mean (standard deviation) unless otherwise noted. Time between visit 1 and 2 ranged between 7 and 8 years, therefore, there were no participants aged 60–69 at visit 2.
The full range of scores on 3MSE summary scores are presented in Figure 2. The distributions at both Visit 1 and Visit 2 overlap considerably. Of note, although the distribution at both Visit 1 and Visit 2 are both highly left-skewed, as is characteristic of this test, few participants achieved maximum scores, reducing the likelihood of ceiling effect influencing analyses: n = 9 at Visit 1, n = 6 at Visit 2, n = 3 at both visits.
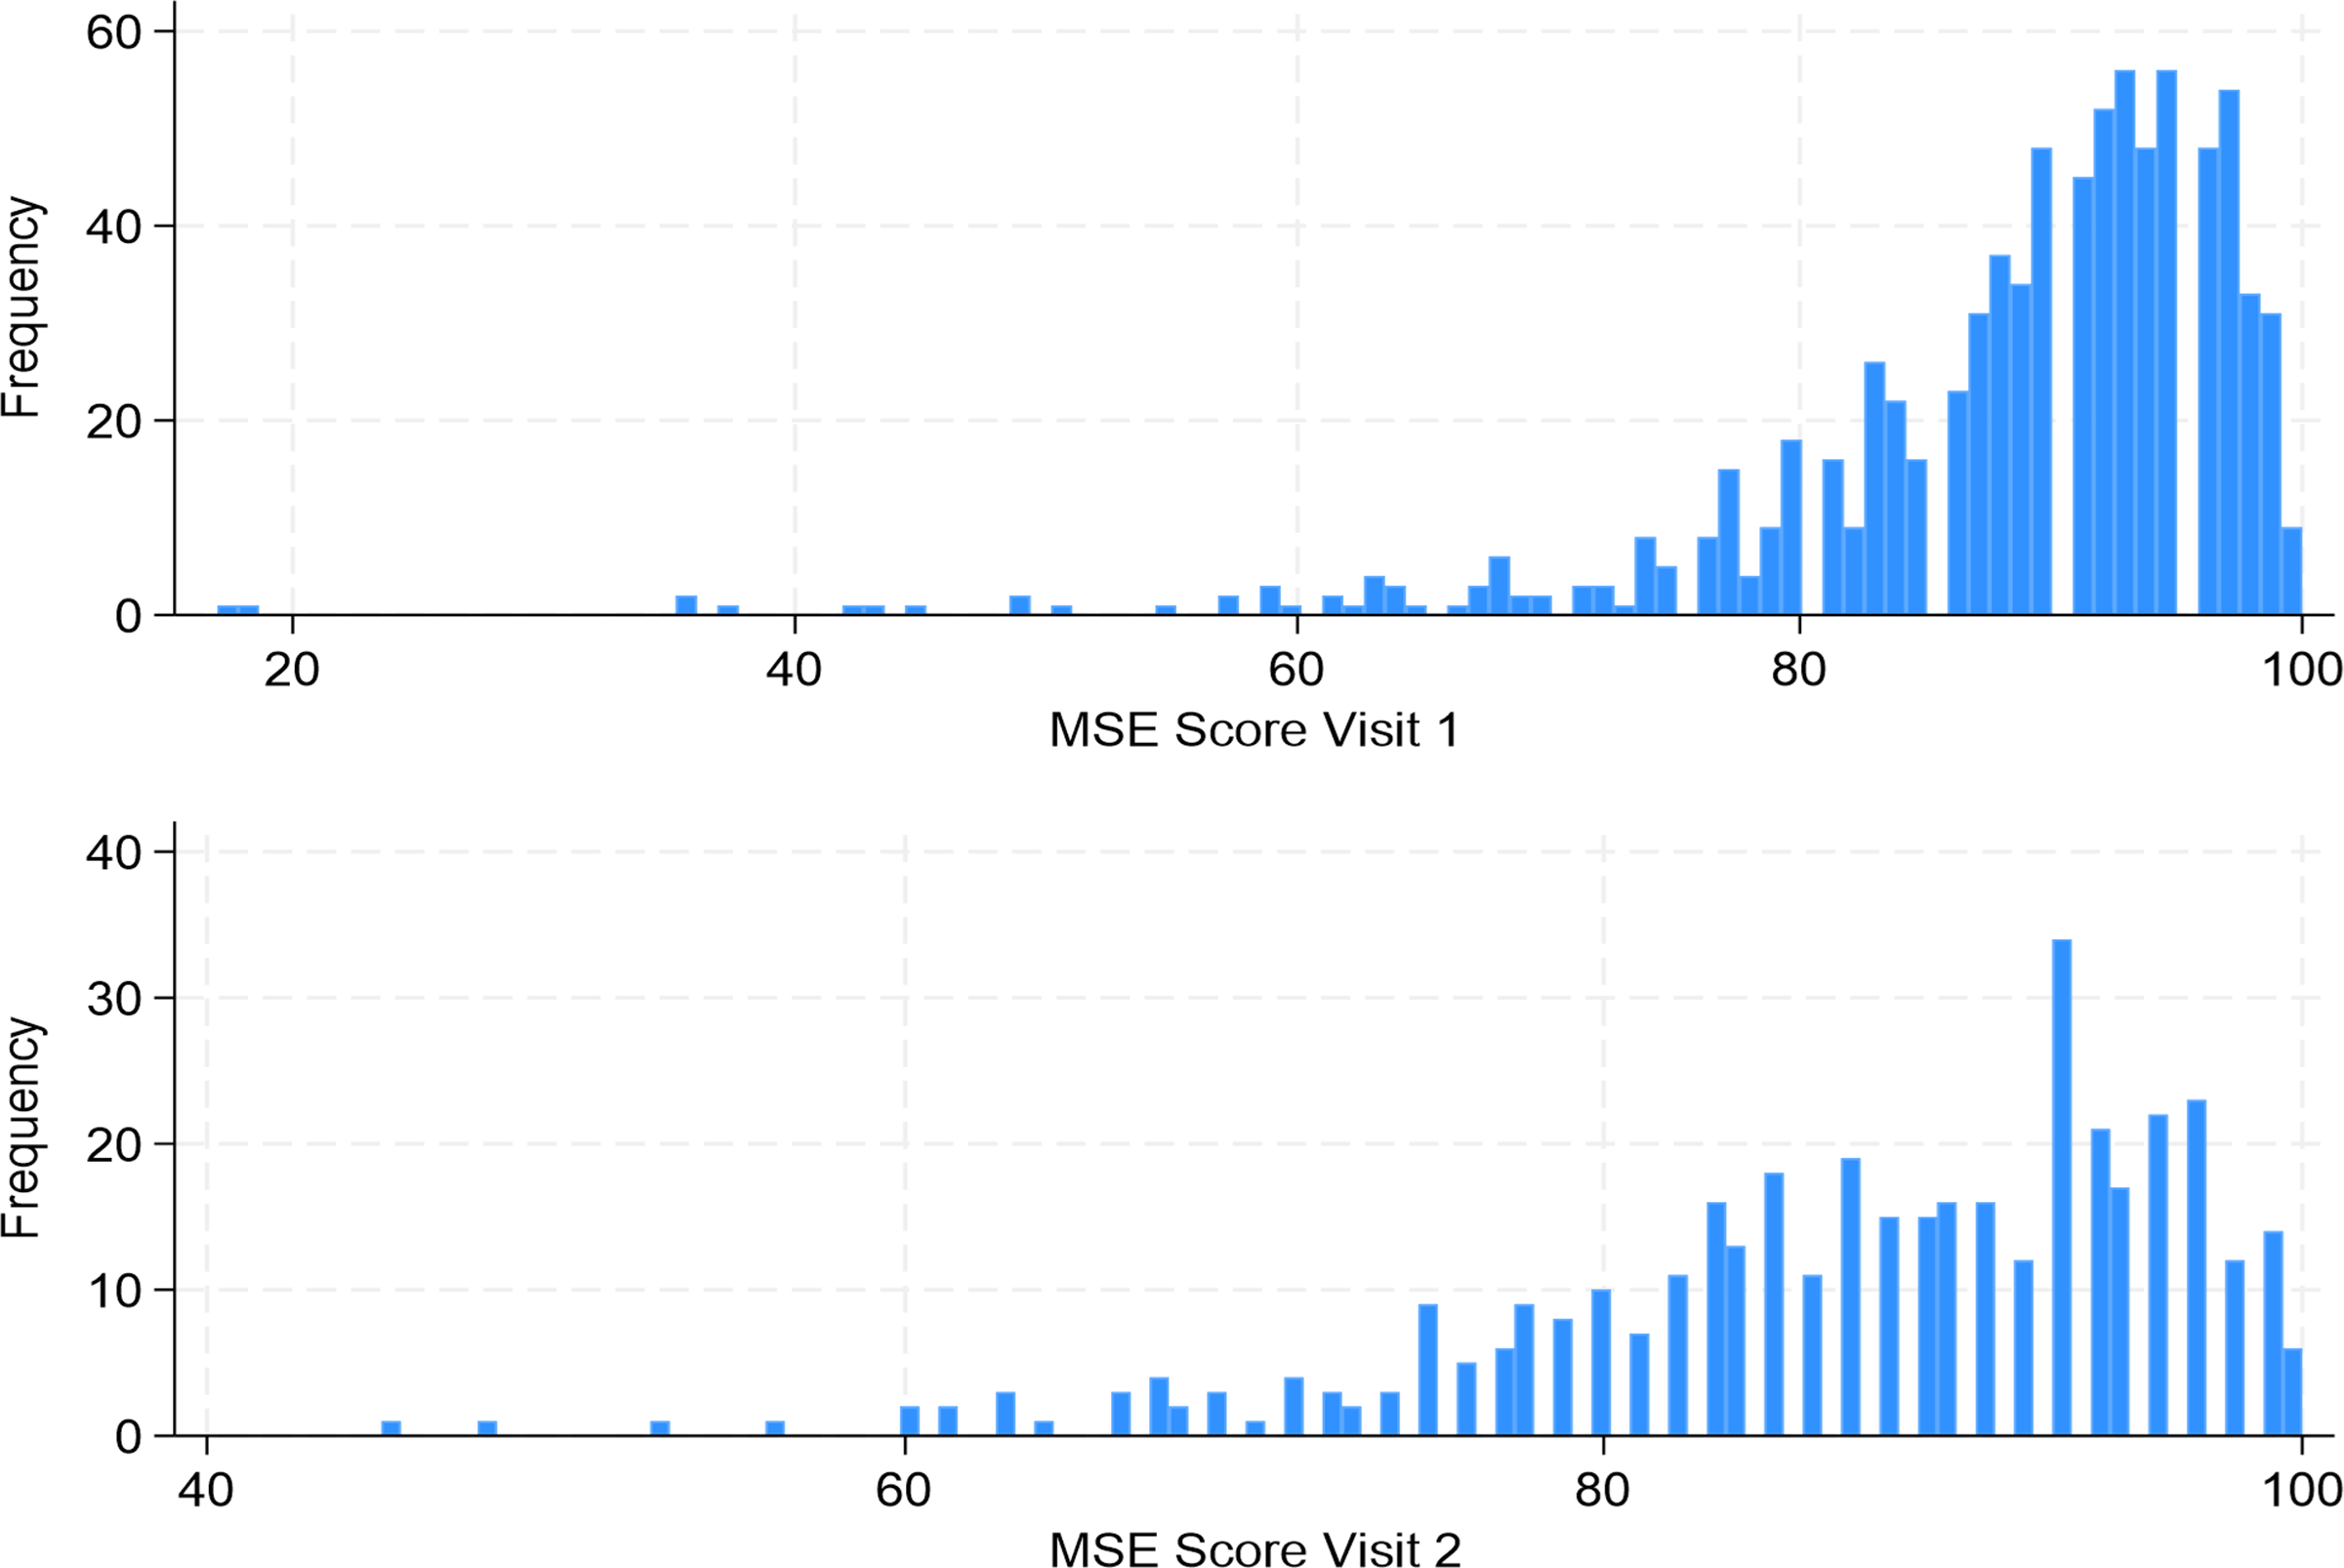
Figure 2. Histogram distributions of Modified Mini Mental Status Examination Scores in American Indian adults (age 65–95) participants of the Strong Heart Study at cognitive examination Visit 1 (2010–2013) and Visit 2 (2017–2019).
Inference for score validity: factor structure
Based on standard model fit criteria (CFI >0.9, SRMR <0.05, and RMSEA <0.08), the unidimensional or single-factor model (CFI = 0.65, SRMR = 0.15, RMSEA 95% CI: 0.06–0.08) and the 3-factor model (CFI = 0.86, SRMR = 0.05, RMSEA 95% CI: 0.04–0.05) did not meet fit criteria (Table 2). On the other hand, the 4-factor model (CFI = 0.91, SRMR = 0.04, RMSEA 95% CI: 0.03–0.04) and the second-order model (CFI = 0.91, SRMR = 0.04, RMSEA 95% CI: 0.03–0.04) both met all three model fit criteria. Furthermore, the difference between the 4-factor and second-order models was not significant ( χ 2 (2) = 7.08; p > 0.05), indicating the model fit is not worse for the more restrictive, second-order model. Because the second-order model has a comparable fit, is more parsimonious, and supports the more interpretable total score, this model is used in subsequent analyses.
Table 2. Model fit indices from exploratory factor analysis of Modified Mini Mental Status Examination (3MSE) scores among American Indian adults, ages 65–95
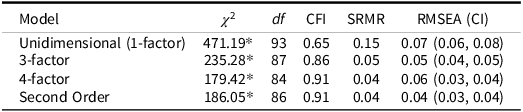
Note: * = p < 0.01. CFI: Comparative Fit Index; SRMR: Square Root Mean Residual; RMSEA (CI): Root Mean Square Estimation Approximation with 95% confidence interval. Note that the second-order model contains the four lower-order factors as well as the primary higher-order factor. Comparison of the nested 4-factor and second-order model χ2 (2) = 7.08, p-value > 0.05.
The lambda (λ) coefficients, or factor loading estimates, for each of the individual 3MSE tasks suggest all except one task (Registration, λ = 0.11) were >0.3, the conventional threshold for at least moderate correlation between the individual item and its factor. The VEM factor had overall high loadings (>0.8); LEF and PMWM moderate loadings (range 0.4–0.65); and OVC low to moderate with high loading variability (range 0.11–0.69). The Overall factor, representing the second-order for the total score, had reasonably high loadings, ranging from 0.65 to 0.98.
Inference for generalizability: Internal consistency and test-retest score stability
Evaluation of the 4-factor model included the following factors: Verbal Episodic Memory (VEM), Language and Executive Function (LEF), Psychomotor & Working Memory (PMWM), Orientation & Visuo-construction (OVC); the second-order factor was the Overall factor, reflecting the total score (Table 3). The omega (ω) coefficient, or internal consistency-reliability estimate, for the Overall factor (total score), was >0.9, the threshold used for valid interpretation in clinical contexts. The only omega coefficient for a sub-factor >0.8 was VEM, consistent with valid interpretation for research applications. The other omega coefficients (LEF, PMWM, OVC) ranged from 0.49 to 0.66.
Table 3. Standardized pattern coefficients (λ) and internal consistency-reliability estimates (ω) from confirmatory factor analysis of the second-order model of Modified Mini Mental Status Examination (3MSE) scores among American Indian adults, ages 65–95
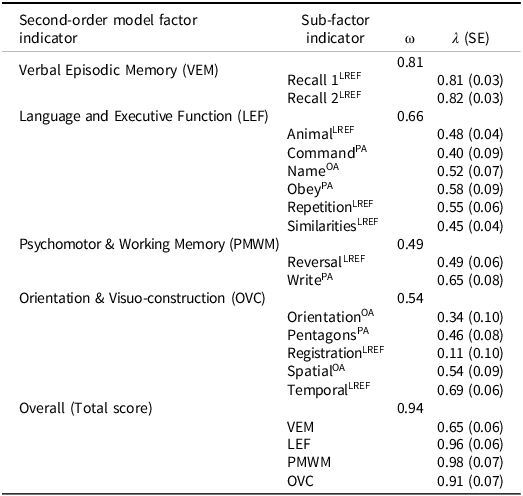
Note: SE = Standard Error. Cross-indexing to 3-factor model item groups noted: LREF = Learning, Recall, and Executive Functioning (recall 1, recall 2, animals, repetition, similarities, reversal, registration, temporal); PA = Psychomotor Ability (command, obey, write, pentagons); OA = Orientation and Awareness (name, orientation, spatial).
Total 3MSE scores were moderate to highly stable between Visit 1 and Visit 2, with Pearson’s reliability-stability coefficients (r) ranging from 0.47 to 0.78 (Table 4). The lowest coefficient (r = 0.47) was identified among participants with >13 years of education, and the highest (r = 0.78) among the oldest group, aged >80 years. All Pearson’s reliability-stability coefficients were statistically different from 0 (p < 0.05), suggesting that 3MSE scores were not dissimilar – i.e., were stable – between Visit 1 and Visit 2 for all subgroups evaluated. Furthermore, all within-group comparisons were not significant (p > 0.05). However, although not significant, males, younger persons, those with more education, and those with lower bilingual ability had poorer reliability-stability coefficients than their counterparts.
Table 4. Modified Mini Mental Status Examination (3MSE) scores, with test-retest score stability (visit-to-visit) correlation coefficients (Pearson’s r) and cross-group comparisons among American Indian adults, ages 65–95
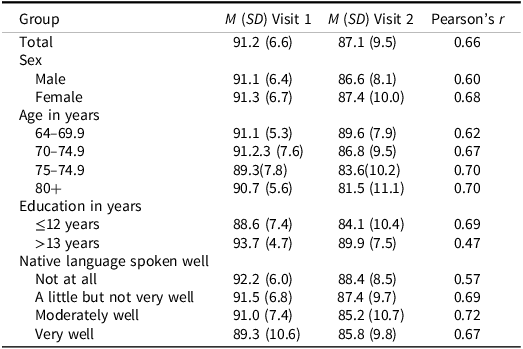
Note: M: Mean, SD: standard deviation. All Pearson’s correlations or test-retest reliability coefficients were significantly different from 0, p < 0.05; all pairwise comparisons of stability coefficients for within-group comparisons were not significant, p > 0.05.
Inference for extrapolation: MIMIC models
In MIMIC models (Table 5), step 1, differences in the second-order (Overall, General, or total score) and each of the 4 first-order factors (VEM, LEF, PMWM, OVC) were evaluated across sex, age, education, and bilingual strata. Collinearity among variables is unlikely to cause undue influence on our estimates, because the range of correlations between features was small: Spearman rho from 0.22 (age and bilingual status) to −0.17 (age and education). After adjustment for multiple statistical tests, significant differences were detected between sexes (male, female) for language and executive functioning (LEF), psychomotor and working memory (PMWM), and orientation visuo-construction (OVC) factors: males scored higher than females on OVC and LEF factors, but lower on PMWM, with low to moderate effect sizes. For education (≤12, 13+ years), differences were detected for LEF and OVC; those with at least 13 years of education scored higher in LEF but lower in OVC than those with up to 12 years of education, with moderate effect sizes. Bilingual ability (not at all/a little, moderately/very well) was also associated with LEF and OVC factors, wherein those who were better at speaking their Native language – and thus represented bi- or multi-lingual speakers – scored lower on LEF but higher on OVC than those who were not bilingual, with moderate and low effects, respectively. Significant associations with the total Overall factor, or total score, were consistently detected for age, wherein older participants scored lower, with high effect estimates (d > 0.6). Sex, education, and language were also associated with the Overall factor, with moderate effect sizes (d = 0.2–0.4).
Table 5. Multiple Indicator Multiple Cause (MIMIC) structural equation model coefficients (γ) and differential item functioning effect size estimates (Cohen’s d) for a second-order, 4-factor structure of Modified Mini Mental Status Examination (3MSE) scores among American Indian adults, ages 65–95 years
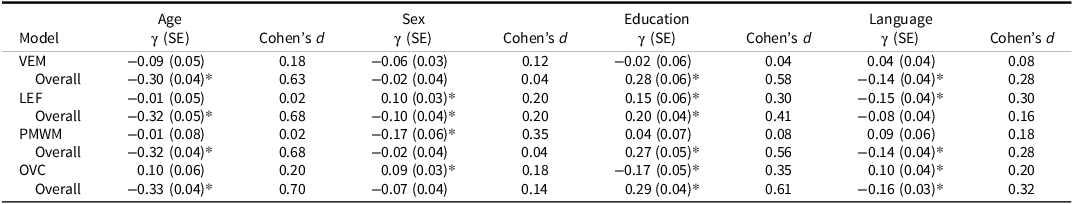
Note: * p < 0.05 after Benjamini-Hochberg adjustment. SE: Standard Error; VEM: Verbal Episodic Memory; LEF: Language & Executive Functioning; PMWM: Psychomotor & Working Memory; OVC: Orientation & Visuo-construction.
In step 2 of MIMIC modeling (Table 6), differences across bilingual ability groups, independent of age, sex, and education, were only significant for the Writing task (p < 0.05). Specifically, participants with higher bilingual speaking ability had lower scores on this task; however, the effect was small (Cohen’s d = 0.24). Bilingual speakers had similar effect sizes with lower scores on the similarities task and a larger effect size but higher scores than non-bilingual individuals on the mental reversal task; however, these differences were not statistically significant.
Table 6. Multiple Indicator Multiple Cause (MIMIC) step 2 regression coefficients (β) for a second-order, 4-factor structure of Modified Mini Mental Status Examination (3MSE) scores with bilingual speaking ability, adjusted for age, sex, and education, among American Indian adults, ages 65–95 years
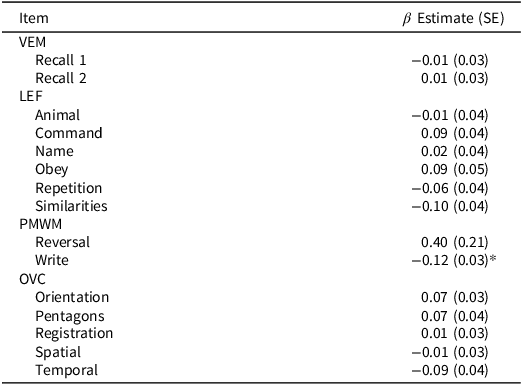
Note: * p < .05 via Benjamini-Hochberg adjustment. VEM = Verbal Episodic Memory, LEF = Language and Executive Function, PMWM = Psychomotor & Working Memory, OVC = Orientation & Visuo-construction.
Discussion
This study presents data supporting some validity inferences for 3MSE scores among American Indian adults aged 65–95. Specifically, these results support the following inferences: (a) 3MSE total score can be used to represent general cognitive functioning as a summary score, a finding consistent with other populations; (b) 3MSE total score has adequate internal consistency-reliability and stability; (c) four sub-factor scores may be used to represent verbal-episodic memory, language and executive function, psychomotor skills and working memory, and orientation and visuo-construction skills, but with caution given low reliability; (d) differences in the total score were observed across strata of sex, age, and language use; in particular (e) the Write task differed by language use, independent of sex, age, and education. Of note, these findings suggest high degree of validity for 3MSE, despite prior reports of generally low distribution for 3MSE scores in this population (A. M. Suchy-Dicey et al., Reference Suchy-Dicey, Oziel, Sawyer, Olufadi, Ali, Fretts, Umans, Shibata, Longstreth and Grabowski2022; S. erney et al., Reference Verney, Bennett and Hamilton2015).
Also of note, our second-order factor structure yielded a better model fit than the unidimensional model. The more complex second-order model offers improved flexibility in test performance, given the multiple domains involved (Klyce et al., Reference Klyce, Pugh and Perrin2021), albeit not consistent with the original test design (Teng & Chang Chui, Reference Teng and Chang Chui1987). Furthermore, our high omega estimates support the inference of generalizability and use of the single summary score for individual-level interpretation of results – however, lower estimates for each of the four sub-factors caution against such interpretations for the multi-level model. Therefore, future research may be needed to justify the use of a 4-factor or other higher-level model in individual-level interpretation in this or other similar populations – such as American Indians from other regions, from urban settings, or Alaska Native peoples.
The moderate-to-strong stability coefficients over the mean 7-year interval suggest consistent score performance over time, including across age, sex, education, and bilingual strata. However, a closer examination of stratum-specific stability estimates suggests a few groups that may warrant closer monitoring, greater score volatility, or higher potential for cognitive variance and decline, is validated for these population strata. For example, those who self-reported not using their Native language at all (i.e., English-only speakers) had the lowest score stability compared with those who spoke both English and their Native language. This finding is consistent with findings from other populations that multi-lingual speakers may have better cognitive function (Bialystok et al., Reference Bialystok, Craik and Luk2008; Costa et al., Reference Costa, Hernandez and Sebastian-Galles2008; Prior, Reference Prior2010) or be protected against cognitive decline (Bialystok et al., Reference Bialystok, Craik and Freedman2007; Costumero et al., Reference Costumero, Marin-Marin, Calabria, Belloch, Escudero, Baquero, Hernandez, de Miras, Costa, Parcet and Avila2020; Craik et al., Reference Craik, Bialystok and Freedman2010; Crane et al., Reference Crane, Gruhl, Erosheva, Gibbons, McCurry, Rhoads, Nguyen, Arani, Masaki and White2010; Guzman-Velez & Tranel, Reference Guzman-Velez and Tranel2015; Ramakrishnan et al., Reference Ramakrishnan, Mekala, Mamidipudi, Yareeda, Mridula, Bak, Alladi and Kaul2017) perhaps via enhanced cognitive reserve,(Liu & Wu, Reference Liu and Wu2021) especially from diseases that preferentially affect the temporal lobe (Schweizer et al., Reference Schweizer, Ware, Fischer, Craik and Bialystok2012)
However, those with more education also had lower score stability than those with less education, which is inconsistent with expectation; however, education in this cohort was strongly confounded by traumatic childhood experiences at Boarding schools, and has been shown to have poor construct validity for baseline cognitive function in this population (A. M. Suchy-Dicey et al., Reference Suchy-Dicey, Oziel, Sawyer, Olufadi, Ali, Fretts, Umans, Shibata, Longstreth and Grabowski2022), altogether emphasizing the need for more research on crystallized cognition and education as contextual factors in cognitive assessments.
MIMIC models found education to have the largest number of significant group differences, independent of other key features (age, sex, and language use); although each of the other features also had significant, mutually-independent findings for both the four factor- and general factor models. These findings suggest that all of these features – age, sex, education, and language use – may be important for interpreting both overall and sub-factor scores on 3MSE. Differential item functioning analysis, looking more deeply at differences across language use categories, identified one item (Write, wherein participants are asked to write a short phrase for up to five points) with a significant, albeit small effect. The impact of language use on test and language-specific skills suggests that score interpretation in culturally and educationally diverse settings may need to carefully consider the scoring impact of items with a language or writing component. More than one-third of our study population self-identifies as at least moderately bilingual, suggesting that test scores could be artificially reduced by up to 5% for a substantial portion of this population. Future analyses should examine whether adaptations or adjustments of the test structure or scoring matrix can improve score accuracy compared to other populations.
Because the 3MSE was not designed with American Indian or other culturally-diverse populations in mind, test validation is vital to score interpretation in these groups. Given that educational, linguistic, socioeconomic, cultural, and historical factors can influence test administration and performance – independent of cognition – extra care must be taken when administering tests to minoritized populations to limit further influences of testing artifacts. As an example, not all participants are able or willing to undergo testing in the office environment; if possible, tests can be given at home or in other secure settings, as long as the test environment is secure, quiet, and free of distractions. Because many participants may have limited access to regular healthcare, vision, and hearing limitations may be inadequately addressed, so a range of reading glasses and basic hearing assistive devices may be needed. Trust and rapport are important in community settings, and many interviewers are younger than the individual Elders being assessed, which can pose a cultural difficulty in correcting errors during testing. Finally, not all American Indian populations and groups are homogeneous or similar in history, language, culture, and other contextual factors, so knowledge of the environment and population of interest, with staff, clinic, and physician training in local perspectives, experiences, and histories may be important to achieving quality elder care.
This work must be evaluated in context with methodological considerations. First, these data comprise a survival cohort, with data from over 800 individuals at Visit 1 but only around 400 at Visit 1 and 2. Thus, inferences related to reliability, internal consistency and stability, were limited to those who could attend both visits and may be biased toward healthier inclusion. In addition, although our results support scoring and interpretation of 3MSE scores, the implications of whether these scores represent normal or impaired cognition and what scores would provide accurate and precise categorization are not yet addressed with these data; future research with physician panel based case review data will address these questions about the utility of 3MSE score use in practice (Cizek et al., Reference Cizek, Rosenberg and Koons2008). Also, our data include a large, heterogeneous cohort of American Indian participants from 11 tribes and communities over 3 geographic regions; however, other groups may not be represented by these groups and may require independent score validity assessments.
Overall, formal psychometric analysis to interpret 3MSE scores, overall and in the context of factors such as age, sex, education, and language use, is needed for valid, appropriate inference. A growing body of evidence suggests that standards from White populations do not generalize to others, suggesting a potential need for independent validations in all peoples. These data confirm the generally valid use of 3MSE scores in American Indian individuals but with a possible need for score contextualization by sex, education, and language use (bilingual) strata.
Acknowledgements
The authors wish to thank all Strong Heart Study staff, participants, and communities. The opinions expressed in this paper are solely the responsibility of the author(s) and do not necessarily reflect the official views of the Indian Health Service or the National Institutes of Health.
Funding statement
This study has been funded in whole or in part with federal funds from the National Institutes of Health, including K01AG057821 (Suchy-Dicey), P50AG005136 (Grabowski), R01HL093086 (Buchwald).
Competing interests
None.


