


Introduction
Electron probe microanalysis (EPMA) is an analytical technique widely used for the characterization of nuclear materials. One example is the study of spent nuclear fuel and its fission products, which aims to assess the distribution of actinides in the fuel before and after irradiation (Walker, Reference Walker1999). The most common fuel types are uranium dioxide (UO2) and the so-called MOX (a mixture of uranium and plutonium oxides). Together with U and Pu, these materials can also contain minor actinides such as Np, Am, and Cm. The latter elements are produced during irradiation by neutron capture and subsequent β− decay of U and/or Pu, or during fuel fabrication in the case of transmutation schemes, which aim to convert them into less long lived and, hence, less problematic nuclides. Other examples are the radioisotope-based energy supply systems, which have been developed for space missions into deep space (where energy from the sun is not available). One such material is uranium-doped americium oxide, which has been shown to offer better properties (e.g., phase stability and resistance against self-irradiation) than pure americium oxide (Vigier et al., Reference Vigier, Freis, Pöml, Prieur, Lajarge, Gardeur, Guiot, Daniel and Konings2018). Uranium-doped americium oxide may also contain a significant amount of Np due to α decay of Am, as well as a small amount of Pu originating from the reprocessing of the Am.
The analysis of ultra-light elements by EPMA is well known to be marred by numerous difficulties (see, e.g., Bastin & Heijligers, Reference Bastin and Heijligers2011). Because of these difficulties, oxygen is usually estimated by stoichiometry. However, in some situations, it may be necessary to determine the oxygen content because of the lack of information on the valences of the accompanying elements. Among the above-mentioned difficulties are the large uncertainties affecting the mass attenuation coefficients (MACs), which are required to correct X-ray absorption effects within the sample. Because X-ray absorption is the dominant correction for ultra-light elements, evaluated concentrations are very sensitive to the MAC uncertainties. In the case of actinide absorbers, the situation is worsened by the fact that most MAC tabulations stop at Z = 92, mainly because experimental measurements for actinides face considerable difficulty. In order to overcome this difficulty, Farthing & Walker (Reference Farthing and Walker1990) extrapolated the MAC scheme developed by Heinrich (Reference Heinrich1986), which is one of the most popular sources of MACs in EPMA, to cover the range of actinide elements. Although Farthing and Walker's tabulation has been widely used in most nuclear laboratories, its accuracy for the X-ray lines of the ultra-light elements has not been yet assessed.
In this study, we have performed measurements of MACs of Th, U, Np, and Pu for O X-rays. The MACs were obtained by measuring O X-rays emitted from ThO2, UO2, NpO2, and PuO2 samples, using a shielded electron microprobe dedicated to the analysis of irradiated nuclear fuel. X-ray measurements were processed with the help of the program XMAC (Pouchou & Pichoir, Reference Pouchou and Pichoir1988; Pouchou, Reference Pouchou1996). This program allows the MAC for a given X-ray line to be obtained by fitting the predictions of the XPP model (Pouchou & Pichoir, Reference Pouchou, Pichoir, Heinrich and Newbury1991) to measurements performed on a sample containing both the emitting and absorbing elements. The results are compared with tabulated MACs and theoretical calculations available in the literature. The use of different MAC schemes for the analysis of a uranium-doped americium oxide sample, which also contains Np and Pu, is discussed.
Material and Methods
Theoretical Background
Consider a homogeneous target with molecular weight  $A_{{\rm w}}=\sum a_i A_{i}$, where a i is the number of atoms per molecule of element i with atomic weight A i. The concentration of element i can be given in terms of the mass fraction:
 $$c_i = {a_i A_{i}\over \sum_j a_j A_{\,j}}.$$
We assume that the sample is bombarded by a beam of electrons of energy E 0 that impinge normally on the sample surface. The intensity of characteristic X-rays I i emitted by element i emerging from the sample surface can be written as follows (Merlet, Reference Merlet1998):
 $$I_i \lpar {E_{\rm 0}}\rpar = {N_{{\rm A}}\over A_i} c_i n_{\rm el} \epsilon {\Omega\over 4\pi} \omega_i p_i \sigma_i\lpar E_{\rm 0}\rpar \int_0^\infty \Phi_i\lpar \rho z\rpar \exp \left[-{\lpar \mu/\rho\rpar \rho z\over \sin\chi} \right]d \rho z\comma\; $$
where N A is Avogadro's number, n el is the number of incident electrons, ε is the spectrometer efficiency, Ω/4π is the solid angle of collection, ωi is the fluorescence yield, p i is the line fraction, σi(E 0) is the ionization cross section of the shell giving rise to the considered X-rays, Φ(ρz) is the ionization depth-distribution, where ρ is the mass density of the material, χ is the take-off angle, and (μ/ρ) is the MAC of the material for the considered X-ray line. The latter quantity is usually calculated as follows:
 $$\left({\mu\over \rho}\right)= \sum_j c_j \left({\mu\over \rho}\right)_j , $$
where (μ/ρ)j is the MAC of the pure element j for the considered X-ray line and j goes from 1 to the number of elements in the material. Here, it should be noted that characteristic X-rays are implicitly assumed to be mono-energetic, therefore, the variation of both μ/ρ and ε over the natural width of the X-ray line, as well as spectrometer broadening effects, are neglected. Note that equation (2) also disregards the contribution from characteristic and continuum X-ray fluorescence as well as that from Coster–Kronig transitions. The latter contribution corresponds to X-rays arising from the relaxation of vacancies created not by direct electron impact but by the migration of vacancies from subshells of the same shell.
Equation (2) is the basis of quantitative analysis: X-ray intensities I i are measured for each element present in the sample (with the exception of those elements estimated by stoichiometry or by other means), and the resulting system of equations is solved for c i. In practice, each measured X-ray intensity is normalized to that obtained from a reference material containing the element of interest (the ratio of X-ray intensities being referred to as k-ratio). By doing so, the instrumental and atomic parameters which appear outside the integral in equation (2) cancel out, and thus, knowledge of these parameters is not required to determine c i. In general, convergence is quickly achieved by using simple iterative procedures (see, e.g., Scott et al., Reference Scott, Love and Reed1995).
Equation (2) can also be used in a reverse way: by measuring the X-ray intensity on a sample of known composition, it is possible to determine μ/ρ by considering it as unknown. In practice, this can be done by minimizing the sum S of the quadratic deviations:
 $$S = \sum_{k=1}^{N} \lsqb \alpha I_{i\comma {\rm exp}}\lpar E_k\rpar - I_{i\comma {\rm th}}\lpar E_k\semicolon\; \mu/\rho\rpar \rsqb ^2, $$
where I i,exp(E k) and I i,th(E k) are the measured and calculated X-ray intensities at incident electron energy E k, respectively, where k goes from 1 to the number of measured electron energies N. α is a normalization constant which eliminates the need of knowing the instrumental and atomic parameters in equation (2). From the practical point of view, this means that only relative X-ray intensities are required. The values of α and μ/ρ are then obtained by solving numerically the equations dS/d α = 0 and dS/d(ρ/μ) = 0.
This is the basis of the XMAC program developed by Pouchou (Reference Pouchou1996), which solves equation (4) iteratively. The X-ray emission model adopted in XMAC is the XPP model of Pouchou & Pichoir (Reference Pouchou, Pichoir, Heinrich and Newbury1991), which is a simplified version of the PAP model developed by the same authors (Pouchou & Pichoir, Reference Pouchou, Pichoir, Heinrich and Newbury1991). Note that corrections for characteristic and continuum fluorescence were not included in XMAC. An earlier version of XMAC was used by Pouchou and Pichoir to obtain the MACs in specific cases where tabulated values at that time were affected by large uncertainties, namely for the X-ray lines of C, N, and O in highly absorbing elements, for some X-ray lines close to an absorption edge and for the L-lines of transition metals (Sc to Cu) which are affected by resonant absorption (see Pouchou & Pichoir, Reference Pouchou and Pichoir1988, for further details). XMAC was also used to determine the MACs for L-lines (Lα + Lβ) of transition metals measured with an energy-dispersive spectrometer (Rickerby & Wachter, Reference Rickerby and Wächter2000), and more recently, it has been used to determine the MACs for metal L-lines of Fe silicides (Gopon et al., Reference Gopon, Fournelle, Sobol and Llovet2013) and of Ni silicides (Llovet et al., Reference Llovet, Pinard, Heikinheimo, Louhenkilpi and Richter2016), where absorption appears to abnormally depend on silicide composition. A similar program was developed and used by Mackenzie (Reference Mackenzie1991) to improve the analysis of the oxygen content of bismuth strontium copper oxide samples.
The sensitivity of the relative X-ray intensity to changes in μ/ρ is illustrated in Figure 1, which compares the O X-ray intensity emitted from UO2 where the MAC is changed by ±10% with respect to a reference value. The calculations have been performed with the XPP model and rescaled to their respective maxima for comparison purposes. From Figure 1, we can see that X-ray intensities measured with an accuracy of ~3–4% allow the MAC to be determined with an accuracy of ±10%. By decreasing the statistical error of measured intensities down to, e.g., 1%, it may be possible to determine the MAC with a much better accuracy. It is worth noting that the beam energy at which the X-ray intensity curve is maximum shifts to higher beam energies when μ/ρ is decreased. This effect had been exploited by Kyser (Reference Kyser1972) for the determination of MACs for L-lines of the transition metals.
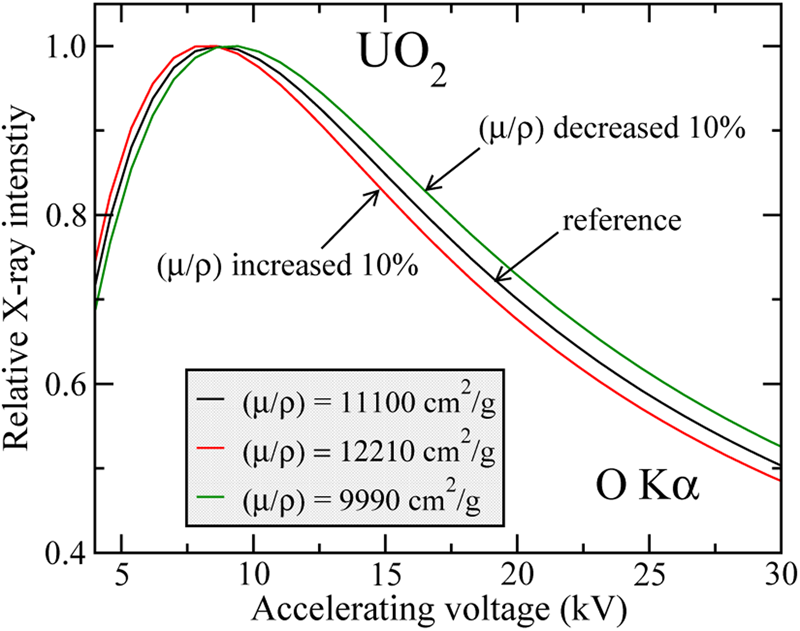
Fig. 1. Sensitivity of energy-dependence of X-ray intensity to mass absorption coefficient. The figure shows the results of modelling the relative X-ray intensity of O Kα X-rays in UO2 using μ/ρ values of 9,990 and 12,210 cm2/g, which correspond to ±10% variation of the theoretical value of 11,100 cm2/g, also shown.
Experimental Method
Measured targets consisted of Al-coated ThO2, UO2, NpO2, and PuO2 samples. The Al coating was obtained by Al evaporation and was required because of the insulating character of the actinide oxides, which generally have a cubic CaF2-type lattice. All measurements were performed on a shielded CAMECA SX100R electron microprobe equipped with four wavelength-dispersive spectrometers, at JRC Karlsruhe, Germany. In the microprobe, the X-ray spectrometers are oriented so as to collect X-rays that emerge in directions forming an angle of 40° with the sample surface, each spectrometer containing up to four different dispersing crystals. After being diffracted by the crystals, X-rays are detected with an Ar–CH4 flow-through proportional counter and are finally recorded with a pulse-height analyzer.
X-ray intensities were recorded at accelerating voltages of 5–30 kV in 5 kV steps, as well as at 7 kV. The accuracy of the acceleration voltage was tested by measuring the Duane–Hunt limit by WDS at 11 keV using a LiF crystal. The energy calibration of the spectrometer was checked on reference X-ray lines. The difference between the nominal and determined accelerating voltage was less than 0.5%. Electron currents were in the range 3–20 nA to avoid detector dead-time issues. For each accelerating voltage, measurements were carried out at, at least, six positions on each sample, with typical counting times of 60 s. The goal was to reach a minimum of at least 100,000, better 200,000–500,000 counts for each sample and accelerating voltage to achieve good counting statistics. The dispersing crystals were a TAP crystal for Al Kα X-rays, a PC1 crystal for O Kα X-rays, and a quartz  $10\bar {1}1$ crystal for the measurement of Th, U, Np, and Pu Mα X-rays, which were also measured for the sake of completeness. The relative standard deviations of measured O Kα intensities were in the range 0.5–1.5%. X-ray spectra around the position of O Kα were acquired for all the samples, and no peak shifts were observed. A comparison of the X-ray spectra for UO2, PuO2, and Al2O3 is shown in Figure 2.

Fig. 2. WDS spectra around the O Kα X-ray line emitted from Al2O3, Al/UO2, and Al/PuO2, recorded with a PC1 crystal.
The thicknesses of the Al coatings were determined by variable-voltage EPMA using the STRATAGEM program (Pouchou, Reference Pouchou1993; Reference Pouchou1996). By using this method, it is possible to determine the thickness and composition of a thin film deposited on a substrate. The k-ratios from the film-substrate composite are compared to the predictions of a theoretical model, where both film thickness and composition are left as free parameters, and by an iterative procedure, values of the thickness and composition that yield k-ratios consistent with those measured are obtained (see, e.g., Llovet & Merlet, Reference Llovet and Merlet2010). Al Kα X-ray intensities were normalized to those emitted from an Al reference standard. Nominal compositions (i.e., pure Al and stoichiometric actinide oxides) were assumed for the coatings and substrates. In STRATAGEM, the PAP model was selected and both characteristic and continuum fluorescence corrections were applied. Figure 3 displays the calculated and measured Al k-ratios from Al/ThO2, Al/UO2, Al/NpO2, and Al/PuO2. The calculated k-ratios are the STRATAGEM predictions that best match the experimental data, which yielded the following thicknesses: 19.6 nm (for ThO2), 20.1 nm (for UO2), 37.5 nm (for NpO2), and 56.8 nm (for PuO2). The uncertainty in the thickness determination was conservatively estimated to be ±10% (Merlet, Reference Merlet2013).

Fig. 3. Calculated and measured Al k-ratios from the Al/ThO2, Al/UO2, Al/NpO2, and Al/PuO2 samples. Symbols represent the experimental data. Continuous lines are the result of STRATAGEM for the indicated thicknesses.
Although the Al coatings have thicknesses in the range 20–60 nm, electrons lose energy within the coatings due to inelastic collisions, and therefore, their energy after traversing the film is smaller than the incident energy. The fractional energy loss of electrons transmitted through a coating can be calculated using Monte Carlo simulation. Table 1 displays the fractional energy loss of electrons transmitted through the Al layers covering the measured targets calculated with the program PENCYL from the PENELOPE distribution (Salvat, Reference Salvat2019). Because the fractional energy loss decreases with increasing incident electron energy, the energy-dependence (relative shape) of the X-ray intensity curve is changed. Electrons also undergo certain scattering within the coating, penetrating into the substrate with an average angle which is slightly different from the assumed normal incidence.
Table 1. Fractional Energy Loss (in %) of Electrons Through Al Films of the Indicated Thickness t. Results from Monte Carlo Simulation Using the Program PENCYL from the PENELOPE Distribution.

To take into account the above-mentioned effects, a correction factor f was applied to the measured X-ray intensities. The correction factor was obtained by taking the ratio of the X-ray intensity emitted from a non-coated sample I i,nc to that emitted from a coated sample  $I_{i\comma \rm c}$, i.e.,
 $$f = {I_{i\comma {\rm nc}}\over I_{i\comma {\rm c}}}.$$
 For consistency,  $I_{i\comma \rm c}$ and I i,nc were calculated using STRATAGEM, for each incident electron energy.
Figure 4 displays the correction factor f corresponding to the Al 37.5 nm/NpO2 sample, rescaled to its value at 30 keV since only the shape (and not the absolute value) of the X-ray curve needs to be corrected. This rescaling process is somehow equivalent to removing the contribution from X-ray absorption within the film in f. Note that the loss of X-ray intensity due to X-ray absorption within the Al coating does not depend on incident electron energy, and therefore, it does not modify the shape of the X-ray intensity curve. The magnitude of the coating correction decreases for increasing beam energies and it is negligible above ~20 keV, the largest correction (~20%) occurring at 5 keV.

Fig. 4. (a) Coating correction factor f for Al 37.5 nm/NpO2. See text for details. (b) Comparison of corrected and uncorrected measured X-ray intensities emitted from Al 37.5 nm/NpO2.
Experimental Uncertainties
The accuracy of the measured MACs is mainly governed by the statistical uncertainties in the X-ray measurements and the systematic uncertainties arising from both the coating correction and the use of the XMAC program. Because of difficulties to determine the latter, the accuracy of measured MACs was estimated as follows.
We simulated the forward experiment (measurement of X-ray intensities) in one of the studied cases (UO2) using the Monte Carlo program PENEPMA (Llovet & Salvat, Reference Llovet and Salvat2017). Simulated X-ray intensities were then corrected for coating effects, and the results were processed with XMAC in order to recover the theoretical MAC used in the simulation. In the simulations, the statistical uncertainties in the X-ray intensities were less than 0.2%. The percentage deviation between the recovered (μ/ρ)rec and the theoretical (μ/ρ)th MAC was calculated as follows:
 $${\lpar \mu/\rho\rpar _{\rm rec}-\lpar \mu/\rho\rpar _{\rm th}\over \lpar \mu/\rho\rpar _{\rm th}} \times 100.$$
The results are summarized in Table 2. A description of each entry follows:
1. Using a non-coated UO2 sample, the deviation of the recovered MAC from the theoretical MAC is approximately −1.8%. This degree of agreement provides evidence that the interaction models implemented in XPP are sufficiently accurate for the purpose of determining MACs from relative X-ray measurements.
2. If the simulation is performed using an Al 19.6 nm/UO2 sample and no coating correction is applied, the deviation of the recovered MAC from the theoretical MAC increases to approximately −5.8%.
3. If the simulation is performed using an Al 19.6 nm/UO2 sample and a correction factor f, calculated by using the same thickness value as that used in the simulations, is applied, the deviation of the recovered MAC from the theoretical MAC is ~3.2%.
4. To estimate the sensitivity of the method to the uncertainty in the layer thickness, the MAC was also recovered from simulated X-ray intensities corrected using a thickness value increased by 10% with respect to that used in the simulations. In this case, the deviation between the recovered and the theoretical MAC is ~4.2%.
5. Simulated X-ray intensities were also corrected by using a thickness value decreased by 10% with respect to that used in the simulations. In this case, the deviation between the recovered and the theoretical MAC is ~2.0%.
6. X-ray intensities corresponding to the Al 19.6 nm/UO2 sample were also processed with XMAC by replacing the incident electron energy by the average energy of electrons transmitted through the Al coating, obtained from Monte Carlo simulations (see above). In this case, the percentage deviation of the recovered MAC from the theoretical MAC is approximately −3.4%.
Table 2. Recovered MACs from Monte Carlo Simulations Using PENEPMA for Different Samples, Thickness Correction Methods, and Thickness Values. The Theoretical MAC Value is 9962 cm2/g. See Experimental Uncertainties Section for Details.

On the basis of the spread of the simulations performed under different conditions, the accuracy of the measured MACs was estimated to be ~5%. This estimate agrees with that reported by Pouchou & Pichoir (Reference Pouchou and Pichoir1988), being higher than the 2% accuracy claimed by Mackenzie (Reference Mackenzie1991).
Sources of MACs for Soft X-Rays
Several sources of MACs are available in the literature, which include numerical databases, semi-empirical schemes, and theoretical calculations.
The most popular source of MACs for EPMA analysis is the semi-empirical approach of Heinrich (Reference Heinrich1986). Heinrich proposed an analytical expression to describe the variation of the MAC with photon energy, which reads
 $${\mu\over \rho}={C Z^4\over A} E^{-n} \left[1 - \exp\left({b-E\over a}\right)\right]\comma\; $$
where C, A, a, and b are parameters that were obtained from fits to the MAC tabulation of Saloman et al. (Reference Saloman, Hubbell and Scofield1988). For X-ray lines with energies below the highest N-edge of the absorber element, Heinrich proposed the following expression:
 $${\mu\over \rho}=1.02 {C Z^4\over A} E^{-n} \left({E-E_{\rm c}\over E_n-E_{\rm c}} \right), $$
where E n is the energy of the highest N-edge, and E c is a cutoff energy below which the model cannot be used. The accuracy of Heinrich's MACs has been estimated to be ~5% for photon energies higher than 1 keV and of ~10–200% for photon energies in the range 0.1–1 keV (Merlet, Reference Merlet1998).
Because of its numerical simplicity (a polynomial expression), many EPMA matrix correction programs were developed using Heinrich's MACs. The widely used PAP and XPP models use Heinrich's MACs for elements with Z > 9, except for specific cases for which Heinrich's MACs were replaced by values obtained experimentally by Pouchou & Pichoir (Reference Pouchou, Pichoir, Heinrich and Newbury1991). These cases included X-ray lines with energies that are within few hundred electron volts of the high-energy side of an absorption edge (e.g., As Lα in Ga, where the energy of the As Lα line and the Ga L3 edge are 1282.0 and 1116.9 eV, respectively; Deslattes et al., Reference Deslattes, Kessler, Indelicato, de Billy, Lindroth and Anton2003), and the Lα lines of transition metals Sc to Cu. For photon energies lower than 1 keV, the PAP and XPP models use the MACs from the tabulation of Henke et al. (Reference Henke, Lee, Tanaka, Shimabuko and Fujikawa1982), except for selected cases where Henke's MACs were replaced by MACs obtained by Pouchou & Pichoir (Reference Pouchou, Pichoir, Heinrich and Newbury1991) and Bastin & Heijligers (Reference Bastin and Heijligers1986). These cases did not include any actinide absorber. Henke's MACs covered the range from 30 eV to 19 keV and Z = 1 to 94 and were obtained from interpolation and extrapolation across Z from experimental measurements often involving gaseous targets available at that time. The data points were averaged by fitting to them, between thresholds, normalized segments of theoretical curves. More recently, Henke et al. (Reference Henke, Gullikson and Davis1993) published a new MAC tabulation for energies 50 eV–30 keV and elements with Z = 1 to 92, but this tabulation appears to be underused in EPMA.
Farthing & Walker (Reference Farthing and Walker1990) extrapolated Heinrich's MACs for actinide elements using the X-ray line energies tabulated by Kleykamp (Reference Kleykamp1981). For the ultra-light elements, where the line energy falls below the highest N-edge of the absorber, Farthing and Walker replaced the multiplying factor 1.02 in equation (8) by 0.727 in order to improve the agreement with the tabulation of Henke et al. (Reference Henke, Lee, Tanaka, Shimabuko and Fujikawa1982) (Farthing et al., Reference Farthing, Love, Scott and Walker1992). Thus, Farthing and Walker's database relies on Henke et al.'s tabulation for soft X-rays. It is worth also mentioning another tabulation of MACs for the ultra-light elements, which was compiled by Ruste & Gantois (Reference Ruste and Gantois1975). The latter tabulation was obtained by modifying the MAC value, in a modified ZAF program, such that systematic EPMA measurements on well-characterized oxide, carbide, nitride, and boride specimens yielded concentrations consistent with the nominal values.
From the theoretical point of view, μ/ρ can be obtained as follows:
 $${\mu\over \rho}={N_{{\rm A}}\over A_{{\rm w}}} \lpar \sigma_{\rm ph} + \sigma_{\rm Co} + \sigma_{\rm Ra}\rpar, $$
where σ ph, σ Co, and σ Ra are the cross sections for photoionization, Compton scattering, and Rayleigh scattering, respectively. At 524.9 eV, which corresponds to the photon energy of the O Kα X-ray line (Bearden, Reference Bearden1967), photoelectric absorption dominates Compton and Rayleigh scattering, thus μ/ρ can be approximated by the so-called photoelectric MAC μ ph/ρ:
 $${\mu\over \rho} \sim {\mu_{\rm ph}\over \rho} ={N_{{\rm A}}\over A_{{\rm w}}} \sigma_{\rm ph}. $$
Indeed, the difference between μ ph/ρ and μ/ρ at 524.9 eV is ~0.01% for U. Note that at a photon energy of 15 keV, the difference between μ ph/ρ and μ/ρ increases to ~5%, and consequently, Compton and Rayleigh scattering should be included in the calculations at such an energy.
There are different sources for photoionization cross sections available in the literature (see, e.g., Han et al. Reference Han, Kim, Pia, Basaglia, Batic, Hoff, Kim and Saracco2016). Numerical tables of theoretical photoionization cross sections are included in the Evaluated Photon Data Library (EPDL) (Cullen et al., Reference Cullen, Chen, Hubbell, Perkins, Plechaty, Rathkopf and Scofield1989), for an energy range from 1 eV to 1 GeV for Z = 1 to 100. The XCOM program (Berger & Hubbell, Reference Berger and Hubbell1987) gives photoionization cross sections essentially equivalent to those in the EPDL. Both the EPDL database and XCOM are based on the calculations performed by Scofield (Reference Scofield1973), initially over the photon energy range between 1 keV and 1 MeV and later extended down to 100 eV (Saloman et al., Reference Saloman, Hubbell and Scofield1988). The XCOM database presents data only for energies above 1 keV.
Chantler (Reference Chantler1995) calculated photoelectric cross sections for Z = 1 to 92 for photon energies over the range from 1–10 eV to 400–1000 keV. The same author tabulated MACs near absorption edges for soft X-rays in the photon range from 100 eV to 10 keV for elements Z = 1 to 89 (Chantler, Reference Chantler2000). Chantler's MACs are available from NIST as the FFAST tabulation (Chantler et al., Reference Chantler, Olsen, Dragoset, Chang, Kishore, Kotochigova and Zucker2005). Note that Chantler's calculation approach is different from the approach used by Scofield (Reference Scofield1973).
More recently, Sabbatucci & Salvat (Reference Sabbatucci and Salvat2016) calculated photoionization cross sections for the inner subshells (up to the N7 subshell) of elements Z = 1 to 99, for photon energies from the ionization threshold up to 1 GeV. These authors used the same theory as in the original calculations by Scofield (Reference Scofield1973) of the EPDL tables, and so their results agree well with Scofield's calculations, but because of the use of a denser grid of energies, Sabbatucci and Salvat cross sections describe more accurately the structure of the cross section near the absorption edges. Sabbatucci and Salvat cross sections were generated using the program PHOTACS, which was developed by the same authors. This program allows excitations to bound levels, finite life effects of the excited states and Pratt's screening normalization correction to be included. The latter correction attempts to account for effects beyond the independent electron approximation (Sabbatucci & Salvat, Reference Sabbatucci and Salvat2016). Note that in the photoelectric effect, a photon is absorbed by the target atom, and an atomic electron is promoted to an empty orbital, which can be bound (excitation) or free (ionization).
The computer program TABLES included in the Monte Carlo simulation package PENELOPE provides a very convenient source of theoretical μ/ρ values. It uses theoretical cross sections for the three interaction processes, interpolating these and combining the results to yield the total μ/ρ. While earlier versions of PENELOPE used the EPDL library to obtain the photoionization cross sections, in recent versions of the program, the EPDL cross sections have been replaced by the more accurate photoionization cross sections of Sabbatucci & Salvat (Reference Sabbatucci and Salvat2016). These cross sections were calculated using Pratt's correction, but they exclude both excitations to bound levels and finite life effects.Footnote 1 In this study, we have used the program TABLES included in version 2018 of the PENELOPE distribution to generate the MACs of actinides for O X-rays.
Results and Discussion
Comparison of Measured MACs with Available Tabulations and Calculations
Figure 5 shows the experimental X-ray intensities, as a function of accelerating voltage, along with the XPP predictions that best match the measurements for the studied samples. The values of the MACs resulting from the use of XMAC are indicated in the legends. In all cases, the relative deviation between the experimental data and the XPP predictions, as reported by XMAC, was less than 0.5%.

Fig. 5. Variation of the O Kα X-ray intensity as a function of accelerating voltage emitted from ThO2, UO2, NpO2, and PuO2, along with the fitted XPP predictions for the indicated MAC values obtained with XMAC.
Although there are no measurements of MACs of actinides for O X-rays, photoabsorption cross-section measurements for metal uranium in the energy range 800 eV–40 keV exist (Grande & Oliver, Reference del Grande and Oliver1981). The accuracy of these measurements was quoted to be of 3%, thus they can be used to asses the reliability of calculations near the energy of the O Kα X-ray line. Figure 6 compares the theoretical PENELOPE and FFAST MACs with the experimental measurements of del Grande & Oliver (Reference del Grande and Oliver1981). It can be seen that both PENELOPE and FFAST MACs show a steep increase at ~400 eV with a broad maximum at ~500 eV, close to the energy of the O Kα line, which lies between the N4 and N5 edges (respectively, at 778.3 and 736.2 eV) and the N6 and N7 edges (respectively, at 388.2 and 377.4 eV). The two theoretical calculations differ both in the shape of the cross section and in the position of the maximum. Our measured value is in good agreement, within the experimental uncertainty, with the PENELOPE MACs.

Fig. 6. Theoretical and experimental MACs of uranium in the photon energy range 200 eV–1.6 keV (a) and 1.6–10 keV (b). Solid curves represent the PENELOPE (red curves) and FFAST (blue curves) MACs. Crosses represent the measurements by Grande & Oliver (Reference del Grande and Oliver1981). The open circle (left panel) is the result of the present study.
In the region 800–1000 eV, the experimental data of del Grande and Oliver lie between both calculated MACs. Above 1000 eV, the differences between the PENELOPE and the FFAST MACs progressively decrease, but they disagree with the experimental data of Grande & Oliver (Reference del Grande and Oliver1981) by ~10%. In the region 1600 eV–10 keV (Fig. 6b), the agreement between the two calculated MACs and the experimental data is excellent, except just above the M4 and M5 edges (respectively, at 3550 eV and 3732 eV) where the experimental data show two peaks. These two peaks, which are known as white lines (Wei & Lytle, Reference Wei and Lytle1979), correspond to transitions of 3d electrons to unoccupied 5f states above the Fermi level and are absent in the PENELOPE and FFAST MACs because both two calculations apply to free atoms. Because of the same reason, the oscillatory behavior of the MAC observed beyond the M4 and M5 edges (commonly referred to as extended fine structure) is not reproduced either (see Fig. 6b).
Figure 7 compares our experimental MACs with the MAC values from the tabulations of Ruste & Gantois (Reference Ruste and Gantois1975), Henke et al. (Reference Henke, Lee, Tanaka, Shimabuko and Fujikawa1982, Reference Henke, Gullikson and Davis1993), Farthing & Walker (Reference Farthing and Walker1990), and the FFAST (Chantler et al., Reference Chantler, Olsen, Dragoset, Chang, Kishore, Kotochigova and Zucker2005) and PENELOPE (Sabbatucci & Salvat, Reference Sabbatucci and Salvat2016; Salvat, Reference Salvat2019) theoretical MACs. The numerical values of the MACs are listed in Table 3. The experimental MACs decrease with increasing Z of the absorbing element and they are in very good agreement, within the experimental uncertainties, with the PENELOPE MACs. The MACs tabulated by Henke et al. (Reference Henke, Lee, Tanaka, Shimabuko and Fujikawa1982) and Farthing & Walker (Reference Farthing and Walker1990) also decrease with increasing Z, but they are systematically higher than our measurements. The MACs tabulated by Ruste and Gantois largely overestimate our measurements, while the MACs tabulated by Henke et al. (Reference Henke, Gullikson and Davis1993) appear to be much lower. The FFAST MACs agree with our measured value for Th but underestimate by ~10% the experimental result for U.

Fig. 7. Comparison of tabulated MACs of actinide elements for O Kα X-rays. Solid lines are MAC tabulations as indicated in the legends; open circles are the experimental results of the present study.
Table 3. Comparison Tabulated and Measured MACs for O Kα in Actinide Absorbers (in cm2/g).

The decreasing behavior of the MACs for oxygen with increasing Z is illustrated in Figure 8, which displays the PENELOPE MACs for all actinide elements around the O X-ray line energy. Our initial intention was to obtain the MACs of Am and Cm by extrapolating the values measured for Th, U, Np, and Pu. However, the nonlinear dependence of the MAC on Z makes it difficult to perform such extrapolation. Because of the steep increase of the curves in the N-edge region, the MACs of U, Np, Pu, Am, and Cm for O X-rays are expected to be more sensitive to the accuracy of calculations than those for C and N X-rays (except perhaps in the case of Th for N X-rays). The theoretical PENELOPE MACs can be used to estimate the variation of the MAC over the width of the X-ray line of interest. Assuming that the natural width of the O Kα line can be approximated by that of the Ne Kα line,Footnote 2 which according to Krause & Olivier (Reference Krause and Olivier1979) is 0.24 eV, the variation of the MAC over the O Kα linewidth ranges from 0.01% for Th to 0.5% for Am, which is much below the uncertainty of the present measurements. Much larger MAC variations are expected over X-ray lines located close to an absorption edge smeared out by a white line, such as the Fe Lα line in metallic Fe (see, e.g., Moy et al., Reference Moy, Fournelle and von der Handt2019).

Fig. 8. PENELOPE MACs of actinide elements as a function of photon energy.
Application to the Analysis of Uranium-Doped Americium Oxide
The results obtained in the previous section have been used to improve the analysis of a uranium-doped americium oxide sample, which consisted of a large ceramic pellet prepared as a small-scale radioisotope heater unit prototype (Vigier et al., Reference Vigier, Freis, Pöml, Prieur, Lajarge, Gardeur, Guiot, Daniel and Konings2018). The Am used to prepare the sample had been aged for approximately 40 years, and therefore, it contained a significant amount of 237Np due to α decay of 241Am. It also contained a small amount of Pu originating from the initial reprocessing of the americium.
Table 4 compares the concentrations obtained using Farthing and Walker's MACs for O Kα X-rays in U, Np, Pu, and Am with those obtained using PENELOPE MACs. In both cases, k-ratios were processed using Farthing and Walker's MACs for the rest of the X-ray lines (U Mα, Np Mα, Pu Mα, and Am Mα) and absorber elements (U, Np, Pu, Am, and O). The k-ratios were processed using the software suite “Probe for EPMA,” which allows using different MAC tabulations as well as defining new values. It is seen that the use of the two different MAC tabulations give significantly different estimates of the oxygen content, differing nearly by ~50%. Judging from the analytical total, however, the PENELOPE MACs provide a more satisfactory estimate of the oxygen content because of the closeness of the total to 100%. The formula of the analyzed uranium-doped americium oxide sample was written as (Am0.80 U0.12 Np0.06 Pu0.02 )O1.8 and was found to be in good agreement with the thermogravimetric analysis reported by Vigier et al. (Reference Vigier, Freis, Pöml, Prieur, Lajarge, Gardeur, Guiot, Daniel and Konings2018).
Table 4. EPMA Analysis of a U-Doped Am Oxide Sample Using Different MACs for O Kα X-Rays. For the Rest of Elements and Lines, the Tabulation of Farthing & Walker (Reference Farthing and Walker1990) Has Been Used.

Conclusions
The mass attenuation coefficients of Th, U, Np, and Pu for oxygen Kα Xrays implemented in the Monte Carlo simulation program PENELOPE, which are based on the photoionization cross-section calculations of Sabbatucci & Salvat (Reference Sabbatucci and Salvat2016), provide the best agreement with our measurements. These MACs consistently yielded accurate electron microbe analysis of a uranium-doped americium oxide sample, which also contained small amounts of Np and Pu. The methodology presented can be used to obtain the MACs of actinides for C and N X-rays, which are also needed in the study of nuclear materials, or of other cases for which attenuation coefficients are poorly known.
Acknowledgments
We are very grateful to J. Himbert (JRC) for technical help with the EPMA measurements. We thank F. Salvat for fruitful discussions and C.T. Walker for critically reading the manuscript.


 Open access