


Non-communicable diseases, including CVD, type 2 diabetes and cancer, have increased worldwide and are the main cause of global mortality(1). An unhealthy lifestyle, which includes physical inactivity, an unhealthy diet and overweight/obesity, can cause imbalanced blood sugar and high blood pressure and cholesterol levels, increasing the risk of non-communicable diseases. However, a healthy diet based on plant foods can help maintain a healthy weight and reduce pre-existing metabolic risk factors, and consequently the metabolic syndrome(Reference Arts and Hollman2–4).
The intake of meals with a high simple sugar and low fibre content quickly promotes postprandial increases in blood glucose and insulin levels, progressing to oxidative stress and inflammatory challenges(Reference de Vries, Klop and Janssen5,Reference Derosa, D’Angelo and Salvadeo6) . If this metabolic dysregulation persists for a long period, the risk of metabolic syndrome may rise, by increasing hunger, reducing insulin sensitivity and promoting low-grade inflammation and abnormal blood vessel function(Reference Törrönen, Sarkkinen and Tapola7–Reference Hopkins and Blundell10).
Berries are excellent food choices in a healthy diet, since they are rich in nutrients and bioactive phytochemicals(Reference Lavefve, Howard and Carbonero11). Evidence shows that berries present beneficial effects on postprandial glucose metabolism(Reference Lappi, Raninen and Väkeväinen12–Reference Castro-Acosta, Smith and Miller18). These beneficial effects can be attributed to the phenolic compounds, especially anthocyanins present in dark-coloured fruits, such as blueberry, grape, pomegranate and jabuticaba, which came to be called superfruits(Reference Wu, Long and Kennelly19). Polyphenols may reduce oxidative stress(Reference Del Bo’, Martini and Porrini20) and modulate inflammatory status(Reference Joseph, Edirisinghe and Burton-Freeman21). These compounds have been shown to inhibit digestive enzymes and intestinal transporters, slowing low glucose absorption into the blood(Reference Coe and Ryan22). It is also known that polyphenols can modulate gut microbiota and immunological and metabolic processes(Reference Man, Zhou and Xia23,Reference Mithul Aravind, Wichienchot and Tsao24) . Another recently proposed mechanism is the modulation of gut hormones, such as glucagon-like peptide 1 (GLP-1). GLP-1 is an incretin hormone secreted by L intestinal epithelial cells in response to food intake(Reference Holst25). It is known to induce metabolic actions by stimulating glucose-dependent insulin secretion(Reference Lorenz, Evers and Wagner26), delaying gastric emptying(Reference Holst27), increasing satiety(Reference Punjabi, Arnold and Geary28) and affecting the gut–brain axis(Reference Geloneze, de Lima-Júnior and Velloso29).
Jabuticaba (Plinia jabuticaba) is a native Brazilian berry that produces spherical fruits with purple peel, white pulp and sweet, astringent and slightly acid flavour(Reference Clerici and Carvalho-Silva30,Reference Alezandro, Dubé and Desjardins31) . Jabuticaba has been reported to contain anthocyanins, tannins, phenolic acids and flavonoids and is also rich in dietary fibre. Anthocyanins are the major polyphenols found in jabuticaba(Reference Alezandro, Dubé and Desjardins31–Reference Plaza, Batista and Cazarin34). Chronic and acute supplementation of foods rich in anthocyanins can promote beneficial changes in health markers(Reference Fairlie-Jones, Davison and Fromentin35). Thus, anthocyanin-rich berry meals (made of bilberries, blackcurrants, cranberries and strawberries) have been beneficial for GLP-1 response after sucrose ingestion(Reference Törrönen, Sarkkinen and Niskanen13).
This study aimed to obtain more scientific knowledge about the effect of the whole-fruit jabuticaba juice, ingested as a 250 ml portion, on the postprandial glucose metabolism induced by intake of a carbohydrate meal. The primary outcomes in the study were incremental glucose and insulin peaks (the area under the glucose and insulin curves), which were derived from blood glucose and insulin concentrations measured at 0–120 min. The secondary outcome was the investigation of effects on postprandial C-peptide, GLP-1, antioxidant status and appetite response. Based on the beneficial effects of jabuticaba peel intake previously researched(Reference Plaza, Batista and Cazarin34,Reference Dragano, Marques and Cintra36) , the hypothesis is that jabuticaba juice can attenuate the increase of glucose and insulin concentrations. This preliminary clinical trial will help to understand the impact of jabuticaba on postprandial glycaemia, enabling its use in association with metabolic changes in future studies.
Methods
Ethical aspects
This research was conducted according to the Declaration of Helsinki and approved by the Human Research Ethics Committee of the University of Campinas, Brazil (CAAE: 79825517.4.0000.5404). This was a controlled, crossover, randomised and simple-blinded clinical trial, approved by the Research Ethics Committee of UNICAMP (CAAE: 79825517.4.0000.5404) and enrolled in the Brazilian Clinical Trials Registry (ReBEC) (ID: RBR-5NXQY2). Written informed consent was obtained from all participants, and they were aware of the possibility of withdrawing from the study at any time.
Participants, recruitment and randomisation
Participants for the study were recruited by an announcement via social media and email of the University of Campinas. The inclusion criteria for the participants were as follows: healthy men and women, aged between 18–40 years, and with normal weight (BMI 18–25 kg/m2). Exclusion criteria included: age <18 years old; allergy, hypersensitivity or intolerance to any foods/food ingredients; smoking; a vegetarian or vegan diet; taking a dietary supplement or receiving any drug treatment; pregnancy or breast-feeding; diagnosis of diabetes mellitus, hypertension or reported medical history of CVD, cancer, liver, kidney or bowel disease.
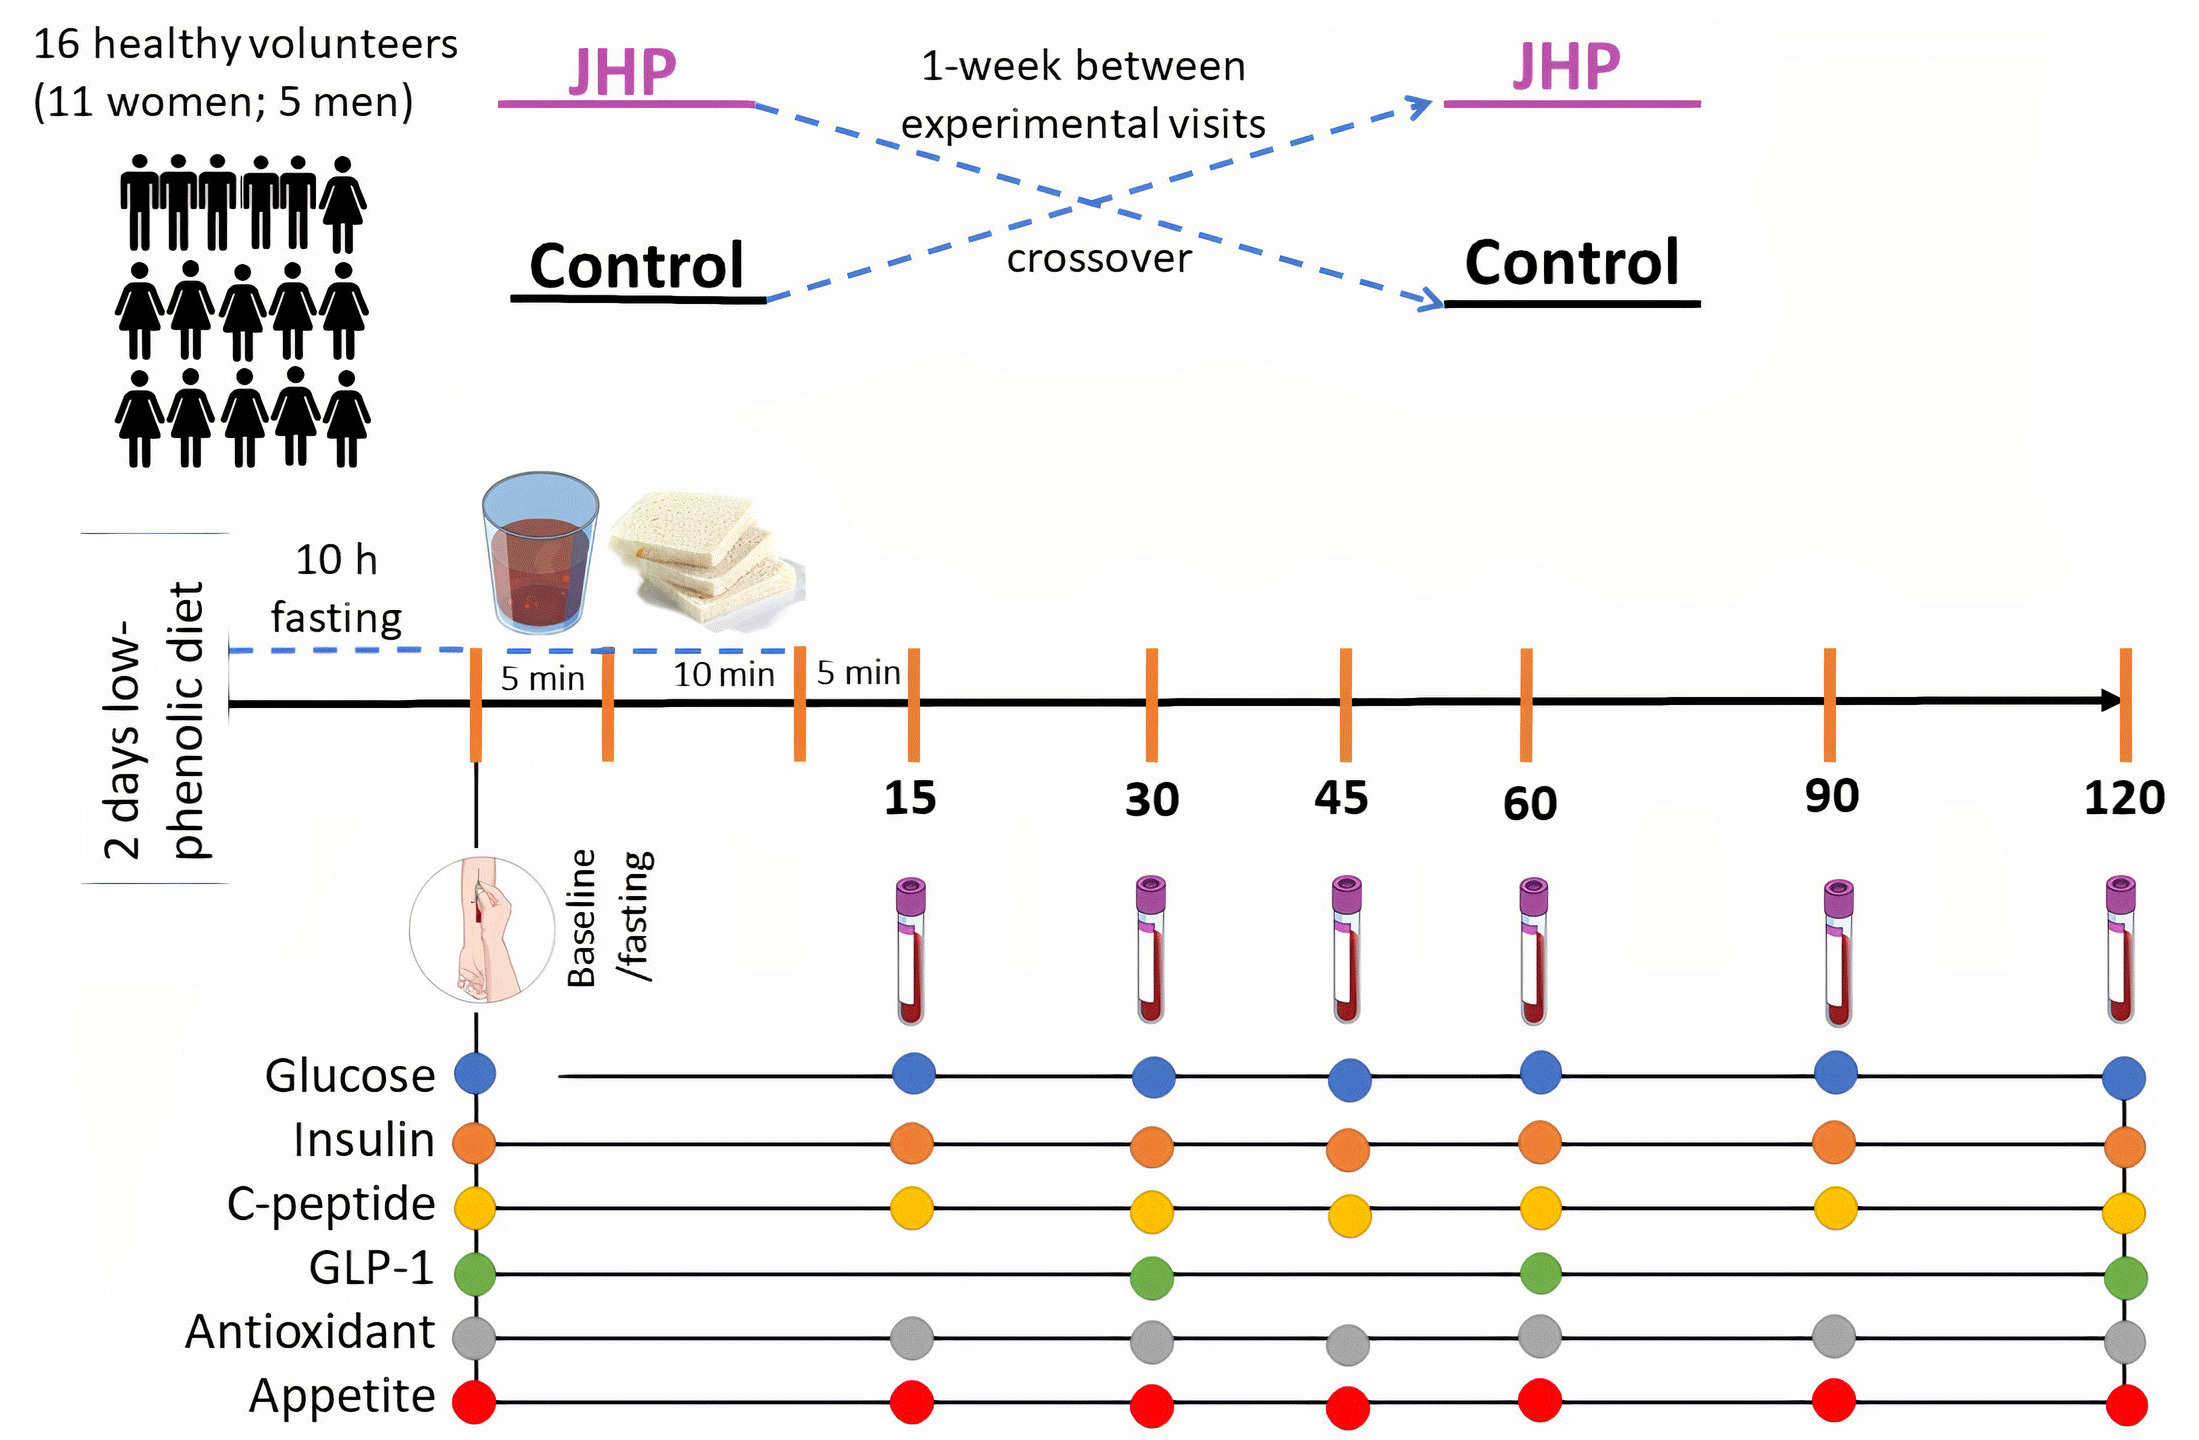
On the recruitment, the participants contacted the study researcher, who interviewed them to assess whether they fit the inclusion criteria (Fig. 1). Sixteen volunteers (eleven women; five men) were randomly assigned in a crossover design intervention. Each volunteer conducted two visits, receiving bread along with jabuticaba juice and bread along with control beverage. One week after the washout period, treatments were crossed for the participants and allocated by the order of receiving beverages (1:1): those receiving control – test and those receiving test – control. Volunteers did not know in which order they were receiving the drink. Block randomisation was carried out by a computer-generated random number list prepared by a researcher with no clinical involvement in the trial.

Fig. 1. Flow diagram of the progress through the phases of the randomised trial.
Study design and intervention
The study had a randomised, simple-blinded, controlled, crossover design with two separate study visits at least 1 week apart between experimental visits. One week was standardised to be enough time for polyphenol elimination from the human body. The study was carried out at the Laboratory of Investigation on Metabolism and Diabetes, Gastrocentro, University of Campinas, Brazil.
To better observe the effect of the acute consumption of jabuticaba juice on antioxidant activity, subjects were instructed to follow a low-phenolic diet and to avoid alcohol and excessive physical exercise 2 d before each intervention. The low-phenolic diet consisted of unflavoured dairy products, white bread, red meat, pork, chicken, fish, eggs, pasta (not whole grain), potatoes and white rice. Participants were asked to avoid phenolic-rich foods or beverages: fruits, vegetables, fruit juices, tea, coffee, nuts, seeds, chocolate, whole-grain products and alcohol in general. During cooking, the use of butter rather than vegetable oils was encouraged, and onions and garlic were avoided. A list of foods that could be eaten and those that should be avoided was given to volunteers. These guidelines and a 48-h dietary record to be filled out by the participants were delivered at recruitment. The food records were verified and participants who did not adhere to the low-phenolic diet were excluded from the study.
Each test visit was conducted with the following procedure: the test was carried out in the morning after 10–12 h fasting. When arriving at the laboratory, participants were weighed and then stood in a supine position for 10 min, before having their blood pressure measured by auscultatory technique(Reference Londe and Klitzner37). Subsequently, a catheter (BD Insyte™ Autoguard™; Becton Dickinson and Company) was placed in the forearm, and venous fasting blood samples were taken for baseline measurement. Afterwards, the jabuticaba juice or the placebo beverage was served and consumed within 5 min. After 10 min, a portion of white wheat bread was served and requested to be consumed in its entirety within 10 min. The 15 min given since the first sip of juice would allow the liquid to reach the small bowel, thus favouring the interaction of the drink components with the digestive system(Reference Mudie, Murray and Hoad38). Blood samples were taken at 15, 30, 45, 60, 90 and 120 min after the start of white wheat bread consumption. Appetite ratings were assessed using standard subjective 100-mm visual analogue scales immediately after each blood sampling.
Intervention beverage and standard bread
Jabuticaba fruits (Plinia jabuticaba) were obtained from a producer in the city of Casa Branca/SP, Brazil, in November 2017. The fruits were selected, washed in tap water, sanitised with a 150 mg/l chlorine solution for 10 min, rinsed in potable water and frozen at –18°C. Jabuticaba juice was produced by homogenisation of whole fruit (pulp, seed and peel) with the addition of water in a proportion of 1:1 (w/w). Then, the juice was subjected to processing by high isostatic pressure at 600 MPa for 5 min at 25°C. The total polyphenol concentration was estimated from a direct analysis by the Folin–Ciocalteu method and expressed as mg of gallic acid equivalent(Reference Swain and Hillis39). The total monomeric anthocyanin content(Reference Lee, Durst and Wrolstad40) was expressed in cyanidin-3-glucoside equivalent. The nutritional compositions were analysed using standard methods of the Association of Official Analytical Chemists(41) in triplicates. The placebo beverage was formulated to have the same energy content as the jabuticaba juice, but lacking phytonutrients such as phenolic compounds and dietary fibres. It was composed by adding the sugars in a similar concentration to that found in jabuticaba juice composition (1·6 % glucose and 2·2 % fructose, as analysed by HPLC(Reference Pereira, Arruda and Molina42)) and coloured with artificial non-energetic green and red food colourings to resemble the jabuticaba juice. Both drinks were served cold in dark cups to minimise visual comparisons. The two meals consisted of 118·0 (sd 5·7) g white wheat bread (50 g available carbohydrate as analysed by the method of McCleary et al. (Reference McCleary, McNally and Rossiter43)). The nutrient composition of the test meals is shown in Table 1.
Table 1. Nutrient composition of jabuticaba juice, control beverage and white wheat bread
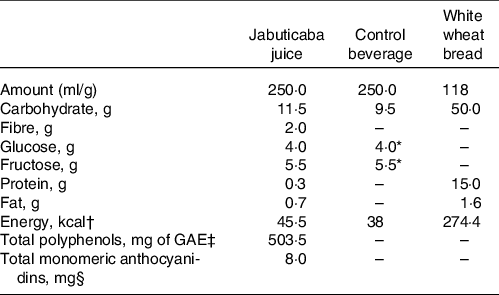
* Analysed in the jabuticaba juice and added it to the control beverage.
† Total energy content was calculated by multiplying the grams of each energy source and the amount of energy per gram of each energy source (fat = 9 kcal/g; carbohydrate = 4 kcal/g and protein = 4 kcal/g).
‡ Total polyphenols were determined with the Folin–Ciocalteu method and expressed as mg of gallic acid equivalent (GAE).
§ Total monomeric anthocyanidins were defined by the Lee et al. (Reference Lee, Durst and Wrolstad40) method.
Anthropometric, biochemical and appetite sensation measurements
Anthropometric characteristics (weight (kg), height (cm) and waist circumference (cm)) were measured. The tetrapolar bioelectrical impedance method was used to assess body composition (Biodynamics 450, TBW). To obtain serum, venous blood samples were collected in an SST™ BD Vacutainer® (Becton Dickinson) and allowed to stand for clotting before undergoing centrifugation (3000 rpm for 10 min). Also, blood samples were collected into K2-EDTA to obtain plasma (3000 rpm for 10 min). An inhibitor of dipeptidyl peptidase-4 (DPP-4; Diprotin A/ile; Sigma-Andrich) was added to the plasma collection tubes for later determination of GLP-1. Aliquots were immediately stored at –80°C until further analysis.
The blood glucose levels were measured with the Glucose Analyzer YSI 2700. Serum insulin (chemiluminescence), serum C-peptide (electrochemiluminescence) and plasma GLP-1 (GLP-1 Total ELISA kit; Thermo-Fisher Scientific) were measured. The antioxidant capacity of the serum was measured according to the hydrophilic oxygen radical absorbance capacity (ORAC) assay(Reference Ou, Chang and Huang44). Absorbance readings for the respective biomarkers were performed on the Biothek HT microplate reader.
Insulin resistance index (HOMA-IR), insulin sensitivity index (OGIS), insulinogenic index (IGI), estimated first phase (FP-ISest) and second phase (SP-ISest) insulin secretion were used as a measure of β-cell function. These indices are based on statistical models using stepwise linear regression analysis. The variables in the model assumed the availability of determinations at 0, 30, 60, 90 and 120 min. The HOMA-IR index was calculated using the following formula: HOMA-IR = ((insulinfasting mU/l) × (glucosefasting mg/dl)/405)(Reference Matthews, Hosker and Rudenski45). OGIS was used as a measure of insulin sensitivity calculated with the formula: OGIS = f (glucosefasting, glucose90 min, glucose120 min, insulinfasting, insulin90 min, D), using the available spreadsheet (http://webmet.pd.cnr.it/ogis/)(Reference Mari, Pacini and Murphy46). IGI was calculated with the following formulas: IGI = (insulin30 min – insulinfasting/glucose30 min – glucosefasting), FP-ISest = (728 + 3·537 × insulinfasting − 120·3 × glucose60 min + 1·341 × insulin60 min + 21·27 × BMI) and SP-ISest = (208 + 0·335 × insulin60 min − 26·33 × glucose60 min + 0·887 × insulinfasting + 3·933 × BMI)(Reference Stumvoll, Van Haeften and Fritsche47).
Subjective appetite profile was measured using 100-mm visual analogue scales(Reference Flint, Raben and Blundell48). The appetite profiles measured include ratings of ‘hunger’ (How hungry do you feel?), ‘desire to eat’ (How strong is your desire to eat?), ‘satiety’ (How satiated (i.e., pleasantly satisfied) are you?), ‘fullness’ (How full do you feel?) and ‘prospective consumption’ (How much food do you think you could eat right now?), all anchored by the terms ‘not at all’ and ‘extremely’(Reference Flint, Raben and Blundell48,Reference Blundell, De Graaf and Hulshof49) .
Statistical analysis
A sample size of fifteen subjects was calculated to provide >80 % power to detect any significant differences of the main effect on blood glucose considering a type I error of 0·05 (2-tailed). Each participant served as his or her control(Reference Zanzer, Plaza and Dougkas50,Reference Kreidler, Muller and Grunwald51) . Thus, the aim was to recruit eighteen participants, allowing for a 15 % drop-out rate.
Data analysis was performed using the SPSS Statistics Software, version 24 (SPSS Inc.). Statistical significance was considered at a P-value ≤ 0·05. Two-way repeated-measures ANOVA was used for treatment and treatment × time interactions using GraphPad Prism software (GraphPad Software Inc.). The Kolmogorov–Smirnov test was applied to assess the normality of the data. Parameters with normally distributed data were analysed by paired t-test and presented by mean values and standard deviations. All non-normal variables including insulin (nmol/l), C-peptide (nmol/l), ORAC (mmol TE/ml) and IGIest (µmol/kg per min per pmol) (variables that did not follow a normal distribution curve) were transformed before parametric testing and presented by least squares means and standard deviations. The incremental peaks for GLP-1 values were calculated by subtracting the fasting value from the highest value. The incremental peak was calculated for each participant and test product. The AUC was calculated for the test and control group, on each subject, using the trapezoid model(Reference Brouns, Bjorck and Frayn52).
Results
Subjects’ characteristics
The subjects’ characteristics are presented in Table 2. A total of twenty-two eligibility subjects were enrolled after a screening questionnaire. Four subjects did not meet the study criteria, and two declined to take part in the study, due to morning unavailability (n 1) and withdrawal of consent (n 1) (Fig. 1). Thus, sixteen subjects recruited had completed the study from June to August 2018. The volunteers reported no adverse effects of jabuticaba or placebo consumption.
Table 2. Characteristics of healthy subjects who completed the study*
(Mean values and standard deviations)

HOMA-IR: insulin resistance index.
* Data are shown as mean values with their standard error.
† 16 Subjects: n 5 males (31.3 %) and n 11 females (68.7 %).
Postprandial glucose, insulin, insulin sensitivity and C-peptide response
Baseline concentrations of glucose, insulin and C-peptide did not differ between the two treatments (P > 0·05). There was no statistical difference in glucose AUC (P = 0·5) and insulin AUC (P = 0·81). There were no treatment and time × treatment interactions (P > 0·05). The postprandial changes in blood glucose, serum insulin and C-peptide after the intake of jabuticaba juice and control beverage are shown in Fig. 2(a, b, and c), respectively. No significant differences were found for insulin sensitivity (OGIS, P = 0·99) or β-cell function (IGI, P = 0·18; FP-ISest, P = 0·91; SP-ISest, P = 0·98) between the jabuticaba juice and the control beverage (P > 0·05; Table 3).

Fig. 2. Postprandial blood glucose (a), insulin (b) and C-peptide (c) concentrations in healthy weight men and women at baseline and after consumption of the jabuticaba juice meal and the control beverage meal. Values represent the mean values and standard deviations of raw data. *P < 0·05 v. control at respective time intervals; n 16. (a) Glucose response: time effect, P < 0·001; treatment effect, P = 0·61; time × treatment interaction, P = 0·63. (b) Insulin response: time effect, P < 0·0001; treatment effect, P = 0·98; time × treatment interaction, P = 0·51. (c) C-peptide response: time effect, P < 0·0001; treatment effect, P = 0·63; time × treatment interaction, P = 0·65.  , control;
 ![]() , jabuticaba juice.
, jabuticaba juice.
Table 3. Metabolic parameters; AUC for glucose, insulin, pep-C, GLP-1 and ORAC responses; and GLP-1 incremental peak after the test meals
(Mean values and standard deviations; percentages)

FP-ISest, estimated first-phase insulin secretion; GLP-1, glucagon-like peptide-1; IGI, insulinogenic index; iPeak, incremental peaks; OGIS, insulin sensitivity index; SP-ISest, estimated second-phase insulin secretion.
* Values are least-squares means (LSM) and standard deviations.
† Indicate percentage difference in mean concentration compared with control as reference.
Variables with normal distribution were presented by mean values and standard deviations and nonparametric values, by LSM and standard deviations.
Postprandial plasma glucagon-like peptide-1 response
The GLP-1 increased after jabuticaba juice intake, peaking at 60 min (P = 0·019). The overall difference in the mean AUC of GLP-1 concentrations between beverages was statistically significant (P = 0·03) (Table 3). Postprandial plasma GLP-1 is shown in Fig. 3.

Fig. 3. Postprandial plasma glucagon-like peptide-1 (GLP-1) (a) and AUC GLP-1 (b) concentrations in healthy weight men and women at baseline and after consumption of the jabuticaba juice meal and the control beverage meal. Values represent the mean values and standard deviations of raw data. *P < 0·05 v. control at respective time intervals; n 16. Time effect, P < 0·23; treatment effect, P = 0·06; time × treatment interaction, P = 0·75. , control; ![]() , jabuticaba juice.
, jabuticaba juice.
Postprandial serum antioxidant capacity by oxygen radical absorbance capacity response
The serum ORAC increased after jabuticaba juice consumption, peaking at 90 min (P = 0·04). The postprandial AUC antioxidant capacity measured by ORAC 120 min after jabuticaba juice intake was 17·2 % higher compared with the intake of the control beverage (P = 0·005). The serum antioxidant capacity remained similar to the baseline after control beverage ingestion (Fig. 4; Table 3).

Fig. 4. Postprandial ORAC (a) and AUC ORAC (b) concentrations in healthy weight men and women at baseline and after consumption of the jabuticaba juice meal and the control beverage meal. Values represent the mean values and standard deviations of raw data. *P < 0·05 v. control at respective time intervals; n 16. **P < 0·001. ORAC response: time effect, P < 0·32; treatment effect, P = 0·03; time × treatment interaction, P = 0·23. , control; ![]() , jabuticaba juice.
, jabuticaba juice.
Subjective appetite ratings
Jabuticaba juice did not significantly change the postprandial subjective appetite responses in ‘hunger’, ‘desire to eat’, ‘satiety’, ‘fullness’ and ‘prospective consumption’ compared with the control beverage. There were no treatment and time × treatment interactions (P > 0·05; Fig. 5) for all five appetite ratings.

Fig. 5. Postprandial subjective appetite response in ‘hunger’ (a), ‘desire to eat’ (b), ‘satiety’ (c), ‘fullness’ (d) and ‘prospective consumption’ (e) at baseline and after consumption of the jabuticaba juice meal and the control beverage meal. Values represent the mean values and standard deviations of raw data. *P < 0·05 v. control at respective time intervals; n 16; Data expressed as mean values with their standard errors. The analysis was employed to evaluate time, treatment, time × treatment interaction effects. (a) ‘Hunger’ response: time effect, P < 0·0001; treatment effect, P = 0·78; time × treatment interaction, P = 0·36. (b) ‘Desire to eat’ response: time effect, P < 0·0001; treatment effect, P = 0·77; time × treatment interaction, P = 0·93. (c) ‘Satiety’ response: time effect, P < 0·0001; treatment effect, P = 0·42; time × treatment interaction, P = 0·95. (d) ‘Fullness’ response: time effect, P < 0·0001; treatment effect, P = 0·63; time × treatment interaction, P = 0·99. (e) ‘Prospective consumption’ response: time effect, P < 0·0001; treatment effect, P = 0·44; time × treatment interaction, P = 0·99. , control; ![]() , jabuticaba juice.
, jabuticaba juice.
Discussion
This study hypothesised that jabuticaba juice could inhibit the rise in blood glucose and insulin concentration following a high carbohydrate meal in healthy volunteers. However, no effects were observed in these primary outcomes. The main findings of the study are that the consumption of the jabuticaba juice increased serum antioxidant capacity and GLP-1 response after a white wheat bread meal consumption. This is the first study to examine the effect of jabuticaba juice on postprandial glucose metabolism, subjective appetite and incretin GLP-1.
Quercetin 3-(2'',3'',4''-triacetylgalactoside), quercetin 3-(6''-acetylgalactoside)-7-rhamnoside, quercetin-3-o-glucoside, quercimeritrin, rutin, kaempferol, syringin, jaboticabin, cyanidin-3-o-glucoside, HHDP-galloylglucose and ellagic acid pentose were identified in the jabuticaba juice, according to a previous study(Reference Geraldi, Betim Cazarin and Dias-Audibert56). The jabuticaba juice intake increased the AUC of antioxidant capacity (ORAC, AUC), probably due to the presence of polyphenols and their metabolites in the blood of the test subjects(Reference Jensen, Wu and Patterson57). After 120 min of jabuticaba juice intake, ORAC values slightly decreased compared with 60 min but were still higher than the control drink ones. Jabuticaba fruit is a source of polyphenols and fibres and has a recognised function in metabolic parameters in non-clinical reports(Reference Leite-Legatti, Batista and Dragano53–Reference Batista, Lenquiste and Cazarin55). In addition, a pilot clinical trial indicated that jabuticaba peel (27·6 g offering 1·25 g polyphenols) might be beneficial by decreasing insulin and glucose levels and increasing antioxidant status after the second meal in healthy volunteers(Reference Plaza, Batista and Cazarin34).
The jabuticaba juice increased AUC and incremental peak of plasma GLP-1 concentrations compared with the control beverage. Total GLP-1 was greater in the jabuticaba juice meal, as shown by an increase in the AUC throughout the 2-h dynamic test. Similar results in GLP-1 concentration have been reported in previous studies with polyphenol-rich foods, such as a berry-mix puree (800 mg polyphenols)(Reference Törrönen, Sarkkinen and Niskanen13), cinnamon(Reference Hlebowicz, Hlebowicz and Lindstedt58) and coffee (∼200 µmol chlorogenic acids)(Reference Johnston, Clifford and Morgan59) in healthy volunteers. The elevation in plasma GLP-1 concentration may be due to the direct effects of total dietary fibre and polyphenols. The presence of dietary fibre seems to promote the modulation of GLP-1(Reference Goff, Repin and Fabek60). Human studies have highlighted the acute impact of dietary fibre on increasing the postprandial GLP-1 responses and prolonging their postprandial peaks(Reference Lafond, Greaves and Maki61). Polyphenols, such as anthocyanins, flavonols, phenolic acids, proanthocyanidins and ellagitannins, may affect L cells in the intestine or inhibit the enzyme DPP-4, which rapidly hydrolyses GLP-1 into a shorter and inactive molecule(Reference Craddy, Palin and Johnson62,Reference Lacroix and Li-Chan63) . Over the past decade, synthetic inhibitors of the DPP-4 enzyme have emerged as an effective approach for treating type 2 diabetes. These inhibitors exert their effect by preventing the inactivation of incretin hormones by DPP-4 in the gut so that they can play their role in glycaemic regulation(Reference Craddy, Palin and Johnson62). More recently, food components have been suggested as sources of DPP-4 inhibition, with the potential to help control blood glucose levels(Reference Lacroix and Li-Chan63). Recent research suggests that the ability of its constituents to inhibit the enzyme DPP-4 could be one of the mechanisms of action underlying the antidiabetic effect of various foods(Reference Lacroix and Li-Chan64). Experimental protocols and clinical trials have shown that phenolic compounds can help regulate blood glucose levels(Reference Lacroix and Li-Chan63,Reference Lacroix and Li-Chan64) . Polyphenol-modulating GLP-1 is a field of growing interest when considering type 2 diabetes and obesity management, since it stimulates insulin secretion, but experimental evidence is scarce and limited. Overall, polyphenols have been reported to increase rodent plasma incretin levels, promote their release into enteroendocrine cell cultures and inhibit DPP-4 enzyme activity(Reference Pinent, Blay and Serrano65).
No significant differences in primary outcomes, blood glucose regulation, insulin level, insulin sensitivity and C-peptide were found between the jabuticaba juice and the control beverage. In this study, the increase in GLP-1 concentrations after jabuticaba juice intake did not stimulate insulin secretion nor reduced blood glucose or postprandial feeling of hunger. The stimulation of insulin secretion by GLP-1 depends on the amount of glucose and other macronutrients ingested(Reference Holst25); besides that, all the volunteers in the study are healthy and have a good regulation of glycaemic homoeostasis. The jabuticaba meal contained 61·5 g of glucose from the fruit and bread, and probably was too small to evoke GLP-1 mediated insulin release. A glucose challenge providing a higher dose of available carbohydrates may be necessary to induce postprandial hyperglycaemia, which would stimulate insulin secretion resulting in hyperinsulinaemia in the healthy volunteers of this study. GLP-1 has beneficial effects on glycaemic homoeostasis in the presence of high glycaemic values. Nevertheless, this was not the case for the healthy and insulin-sensitive volunteers of the study, which explains the same insulinaemia and C-peptide between test and control beverages. The effect of jabuticaba to control blood glucose and insulin secretion in patients with diabetes has not yet been evaluated. The antioxidant effect of the acute consumption of jabuticaba juice and simultaneous incretin effect observed in non-diabetic subjects in this study could be a potential ancillary approach to promote better glucose control among subjects with type 2 diabetes. A long-term clinical trial involving diabetes patients is needed to evaluate the effects of jabuticaba supplementation in this condition.
GLP-1 is known to delay gastric emptying mainly of solid food, increasing satiety(Reference Holst27,Reference Punjabi, Arnold and Geary28) . The present results showed that ingestion of 250 ml jabuticaba juice increased GLP-1 AUC and incremental peak concentrations but had no differences in ‘hunger’, ‘desire to eat’, ‘prospective consumption’, ‘satiety’ and ‘fullness’ compared with the control beverage. This finding could be due to the liquid consistency of the juice, which may have been affected by fasting gastric emptying. The volume and content of available carbohydrates were adjusted to be similar in both beverages. The amounts of fat and protein in the jabuticaba juice were very small (less than 1 g), and fibre content was 2·0 g, not affecting the appetite results.
This study has some limitations. Based on this study, it is not known whether the effect of jabuticaba is due to dietary fibre or polyphenols, or both. Also, the number of male participants was rather small. The intervention was not performed in the same menstrual cycle period for female volunteers; hormonal influences may have affected the results. Ad libitum energy intake at the subsequent meal was not measured, which could have shown whether the glycaemic and insulinaemic responses were affected by the intervention. Moreover, perceived palatability was not measured in beverages, and this may have influenced appetite assessments. Further experiments in obese or pre-diabetic/diabetic subjects are necessary to draw a bigger picture of the effects of jabuticaba on glycaemic homoeostasis, appetite and GLP-1.
Despite the limitations, a significant increase was observed in secondary outcomes: GLP-1 concentrations and antioxidant capacity after acute consumption of jabuticaba juice. This result contributes to the limited research investigating the effects of jabuticaba. Furthermore, the findings open possibilities for applications in food science and nutrition areas. Since GLP-1 is intrinsically linked to the maintenance of postprandial glucose homoeostasis, and its increase may benefit people with altered glucose metabolism, future studies with obese or diabetic volunteers will provide clarification about the effects of jabuticaba on energy balance in these conditions. Clinical trials on jabuticaba supplementation in the Brazilian population have never been previously performed.
In summary, despite the results not supporting the hypothesis of the study, the findings show that ingestion of 250 ml of jabuticaba juice with 503 mg of gallic acid equivalent and 2·0 g of dietary fibres increased serum antioxidant capacity and GLP-1 response after a carbohydrate meal. Further studies in obese or pre-diabetic/diabetic subjects may shed light on the effects of jabuticaba on glycaemia, appetite and energy balance in these metabolic conditions.
Acknowledgements
The authors thank Daniela Regiani Fragoso for the assistance in taking care of the volunteers and data collection, and Soely Maria Pissini Machado Reis for the technical assistance.
This study was supported by the Coordination for the Improvement of Higher Education Personnel – CAPES (MRMJ, finance Code 001); The National Council for Scientific and Technological Development – CNPq (MRMJ, grant numbers 403328/2016-0 and 301108/2016-1) and the São Paulo Research Foundation – FAPESP (MRMJ, grant number 2015/50333-1 and MVG, grant number 2019/12244-8).
The authors state that they have read and approved the final version of the article. The specific contributions of each author are described below: M. V. G., C. B. B. C., M. R. M. J., M. C. and B. G. designed the research; M. V. G. and A. C. V. carried out the study; M. V.G., C. B. B. C., A. C. V. and B. G. analysed the data; M. V. G., A. C. V. and B. G. interpreted the findings. All authors have contributed to the writing of the manuscript and approved the final article.
The authors have no financial or personal conflicts of interest to declare.


