


1. Introduction
The synthetic jet (James, Jacobs & Glezer Reference James, Jacobs and Glezer1996; Smith & Glezer Reference Smith and Glezer1998) is a new type of active flow control technique developed over the past two decades. Due to their advantages of no external air source, simple actuator structure and enhanced entrainment characteristics, synthetic jets have been applied in flow control fields such as fluid mixing (Zhang et al. Reference Zhang, Liu, Li, Liu and Dong2021a), suppression of flow separation (Feng & Wang Reference Feng and Wang2012; Zong, van Pelt & Kotsonis Reference Zong, van Pelt and Kotsonis2018) and enhancement of heat transfer (Krishan, Aw & Sharma Reference Krishan, Aw and Sharma2019; Xu et al. Reference Xu, Moon, Wang, Penyazkov and Kim2019). Therefore, revealing the entrainment mechanism of synthetic jets can help to optimise the design and arrangement of synthetic jet actuators in engineering applications.
The behaviour of synthetic jets has been extensively studied through experimental and numerical methods, and the insights into the entrainment mechanism of synthetic jets have been proposed. Mallinson, Reizes & Hong (Reference Mallinson, Reizes and Hong2001) studied the flow produced by a synthetic jet actuator with a circular orifice. It was found that the synthetic jet establishes self-similarity much more rapidly than the continuous jet, primarily because of turbulent dissipation. They suggested that the ‘flow oscillations introduced by the synthetic jet’ cause a greater entrainment in contrast to the case of the continuous jet. Cater & Soria (Reference Cater and Soria2002) conducted experimental studies on round synthetic jets and continuous jets. They found that the synthetic jet has a cross-stream velocity distribution similar to that of the continuous jet, but has a larger spreading rate and a more rapid centreline velocity decay. They believed that the ‘large-scale structure’ is responsible for a peak in the radial entrainment in the near field of the synthetic jet, and the difference of near-field flow structure between the two jets is the reason for the difference of streamwise velocity gradients, spreading rate and centreline velocity decay. Similar results were found in the experimental study of two-dimensional synthetic jets and continuous jets with the same Reynolds number by Smith & Swift (Reference Smith and Swift2003). The results indicated that the synthetic jet has a larger growth rate of volumetric flow in the near field, which is attributed to the fact that the ‘rollup of the synthetic jet vortex pair’ entrains much more fluid. Krishnan & Mohseni (Reference Krishnan and Mohseni2009) modelled the synthetic jet using both the Schlichting solution to boundary-layer equations in cylindrical polar coordinates and the Landau–Squire solution to the Navier–Stokes equations in polar coordinates, and found that the eddy viscosity of the synthetic jet is larger than an equivalent continuous jet. They attributed the enhanced eddy viscosity to the additional mixing caused by the initial introduction of the periodic vortex structures and their subsequent breakdown and transition to turbulence. In summary, these earlier studies attributed the enhanced entrainment of synthetic jets to the effect of vortex rings or strong velocity fluctuations.
With the development of experimental techniques and computational power, turbulent/non-turbulent interfaces (TNTIs) in jets (Westerweel et al. Reference Westerweel, Fukushima, Pedersen and Hunt2005, Reference Westerweel, Fukushima, Pedersen and Hunt2009; Mistry et al. Reference Mistry, Philip, Dawson and Marusic2016; Breda & Buxton Reference Breda and Buxton2019; Mistry, Philip & Dawson Reference Mistry, Philip and Dawson2019), wakes (Kankanwadi & Buxton Reference Kankanwadi and Buxton2020, Reference Kankanwadi and Buxton2022; Chen & Buxton Reference Chen and Buxton2023), turbulent boundary layers (Chauhan et al. Reference Chauhan, Philip, de Silva, Hutchins and Marusic2014; Borrell & Jimenez Reference Borrell and Jimenez2016; Long, Wang & Pan Reference Long, Wang and Pan2022; Zhang, Watanabe & Nagata Reference Zhang, Watanabe and Nagata2023), mixing layers (Jahanbakhshi & Madnia Reference Jahanbakhshi and Madnia2016, Reference Jahanbakhshi and Madnia2018; Balamurugan et al. Reference Balamurugan, Rodda, Philip and Mandal2020) and other flows (Zhang, Rival & Wu Reference Zhang, Rival and Wu2021b; Li, Long & Wang Reference Li, Long and Wang2022) have been studied to understand the turbulent entrainment process. The TNTI is a very thin fluid layer that separates turbulent and non-turbulent flows (da Silva et al. Reference da Silva, Hunt, Eames and Westerweel2014). The TNTI contains a viscous superlayer dominated by viscous diffusion and a turbulent sublayer dominated by enstrophy production. The boundary between the viscous superlayer and the non-turbulent region is the irrotational boundary. From the perspective of an instantaneous snapshot, entrainment is the process by which irrotational fluid from the environment enters the turbulent region through the TNTI, visually divided into two parts: nibbling and engulfment (Jahanbakhshi & Madnia Reference Jahanbakhshi and Madnia2016; Mistry et al. Reference Mistry, Philip, Dawson and Marusic2016). Nibbling refers to the vorticity propagation process along the TNTI and is related to the small-scale structure near the TNTI. The small-scale structure near the TNTI influences the entrainment process by modifying the strain field near the TNTI (Mistry et al. Reference Mistry, Philip and Dawson2019) and the production of the TNTI area (Neamtu-Halic et al. Reference Neamtu-Halic, Krug, Mollicone, van Reeuwijk, Haller and Holzner2020). Engulfment refers to the process where irrotational fluid from the environment is drawn into the turbulent region by the inviscid motion associated with large-scale structures. Despite the presence of large-scale vortex rings in the near field of the synthetic jet, it has been confirmed that the engulfment process is not the dominant entrainment process (Xu, Long & Wang Reference Xu, Long and Wang2023). The contribution of engulfment to the entrainment process in the synthetic jet does not exceed 4 %, consistent with previous studies on continuous jets (Mathew & Basu Reference Mathew and Basu2002; Westerweel et al. Reference Westerweel, Fukushima, Pedersen and Hunt2005, Reference Westerweel, Fukushima, Pedersen and Hunt2009; Taveira et al. Reference Taveira, Diogo, Lopes and da Silva2013).
Therefore, it is necessary to reconsider what causes the enhanced entrainment in synthetic jets. In recent years, it has been observed that enhanced entrainment of synthetic jets occurs in the transition region between the near field dominated by vortex rings and the far field where the flow is fully developed (Xia & Mohseni Reference Xia and Mohseni2018; Xu et al. Reference Xu, Long and Wang2023). Xia & Mohseni (Reference Xia and Mohseni2018) suggested that the enhanced spreading rate and the centreline velocity decay in the transition region are caused by the enhanced mode of mixing related to the forced instability of the pulsed large vortices. Xu et al. (Reference Xu, Long and Wang2023) suggested that the ‘breakdown of the vortex ring’, instead of the vortex ring, enhances the entrainment in the synthetic jet based on the experimental data of a single case. However, to the best of our knowledge, studies on the origin of enhanced entrainment in the transition region of synthetic jets are still insufficient, and the mechanism remains unclear.
This paper aims to achieve quantitative determination of the position of vortex ring breakdown and the peak position of the entrainment coefficient while simultaneously establishing their correlation. Additionally, the mechanism of vortex ring breakdown leading to entrainment enhancement is revealed from the perspective of an instantaneous snapshot of the vortex evolution near the TNTI.
2. Experimental methods
2.1. Apparatus
A brief description of the synthetic jet actuator is provided here, and detailed information about the device can be found in previous work (Xu et al. Reference Xu, Long and Wang2023). In the present experiment, the synthetic jet is produced by an actuator based on a piezoelectric ceramic diaphragm. A sinusoidal signal is generated by the Tektronix AFG1062 signal generator, amplified by the Aigtek ATA-214 voltage amplifier and then applied to the piezoelectric ceramic diaphragm to generate a synthetic jet at the orifice with diameter  $D=5$ mm. The flow at the orifice of the synthetic jet actuator is measured by the HangHua CTA-02A hot-wire anemometer. The uncertainty of the hot-wire measurement is approximately 0.2 %. The hot-wire probe measures the flow velocity at the orifice at a sampling frequency of $40$ kHz. A sinusoidal function is used to fit the velocity of the blowing period to obtain the maximum velocity $U_{max}$ during the excitation period. The frequency and voltage characteristics of the synthetic jet actuator are shown in figure 1. According to Smith & Swift (Reference Smith and Swift2003), the time-averaged blowing velocity $U_0$ at the synthetic jet actuator orifice can be calculated from
 \begin{equation} U_0=\frac{1}{T} \int_{0}^{T/2} u_0(t)\,{\rm d}t , \end{equation}
where the velocity  $u_0(t)$ at the synthetic jet actuator orifice can be described by the sinusoidal function $u_0(t)=U_{max}\sin (2{\rm \pi} f_d t)$; $T=1/f_d$ is the excitation period. Reynolds number and dimensionless stroke length are two important parameters to characterise synthetic jets (Smith & Swift Reference Smith and Swift2003; Shuster & Smith Reference Shuster and Smith2007). The jet Reynolds number $Re_j$ based on the time-averaged blowing velocity $U_0$ and the orifice diameter $D$ is defined as
 \begin{equation} Re_j=\frac{U_0D}{\nu } , \end{equation}
where  $\nu$ is the kinematic viscosity. The stroke length $L_0$ is normalised by the orifice diameter $D$ and the dimensionless stroke length can be denoted by
 \begin{equation} L_0/D=\frac{U_0T}{D} . \end{equation}
In the present experiment, the driving frequency  $f_d$ of the piezoelectric ceramic diaphragm is set at the resonance frequency of $500$ Hz, and the time-averaged blowing velocity $U_0$ at the orifice is adjusted by changing the driving voltage $V_{pp}$. Therefore, both the jet Reynolds number $Re_j$ and the dimensionless stroke length $L_0/D$ are proportional to $U_0$. The jet Reynolds numbers for the three synthetic jets studied in the present experiment are 1050, 3150 and 4200, respectively. The corresponding dimensionless stroke lengths are 1.27, 3.82 and 5.09, respectively, which conform to the formation criteria $L_0/D>0.5$ for axisymmetric synthetic jets (Holman et al. Reference Holman, Utturkar, Mittal, Smith and Cattafesta2005). Hereafter, the three synthetic jets mentioned above will be referred to as Case 1, Case 2 and Case 3, respectively.

Figure 1. (a) Frequency characteristics of the synthetic jet actuator at  $V_{pp}=100$ V. (b) Voltage characteristics of the synthetic jet actuator at $f_d=500$ Hz. Here $f_d$ and $V_{pp}$ are the driving frequency and driving voltage of the actuator, respectively.
2.2. Particle image velocimetry measurement
Time-resolved two-dimensional particle image velocimetry (TR-2DPIV) experiments are conducted in a container of size  $0.5\,{\rm m} \times 0.5\, {\rm m}\times 1\, {\rm m}$. The coordinate system is defined in figure 2, and the centre of the orifice is taken as the origin. A laser sheet produced by the Beamtech Vlite-Hi-527 Nd:YAG dual-cavity laser illuminates the $x$–
$x$– $y$ plane through the jet centreline. The particle images are captured by the Photron Nova R2 high-speed camera with a Nikon $50$ mm lens and processed by the multipass iterative Lucas–Kanade algorithm (Champagnat et al. Reference Champagnat, Plyer, Le Besnerais, Leclaire, Davoust and Le Sant2011; Pan et al. Reference Pan, Xue, Xu, Wang and Wei2015) to obtain the velocity field. For each jet, the experiments are conducted in three fields of view (FOV), as detailed in table 1. The uncertainty of particle displacement is approximately 0.1 pixels. The relative uncertainties of flow velocity are no more than 1 % for the three FOV, calculated by the flow velocity uncertainty relative to the maximum velocity in the flow.

Figure 2. Schematic of the (i) container, (ii) laser head connected to a light arm, (iii) high-speed camera and (iv) synthetic jet actuator.
Table 1. Particle image velocimetry experiment details.

3. Results and discussion
3.1. Velocity triple-decomposition
The velocity  $u$ in the flow field can usually be decomposed into a time-averaged velocity $\bar {u}$ and a fluctuation velocity $u'$. For periodic or quasiperiodic flows, the fluctuation velocity $u'$ can be further decomposed into a periodic fluctuation velocity $\tilde {u}$ and a random fluctuation velocity $\hat {u}$, i.e. velocity triple-decomposition (Reynolds & Hussain Reference Reynolds and Hussain1972; Feng & Wang Reference Feng and Wang2010)
 \begin{equation} u=\bar{u}+\tilde{u}+\hat{u} . \end{equation}
The periodic fluctuation velocity  $\tilde {u}$ and the random fluctuation velocity $\hat {u}$ are, respectively, defined as
 \begin{align} \tilde{u}={\left\langle u \right\rangle}_{phase}-\bar{u} , \end{align}
 \begin{align} \hat{u}=u-{\left\langle u \right\rangle}_{phase} , \end{align}
where  $\langle \cdot \rangle _{phase}$ represents phase average. The periodic fluctuation velocity $\tilde {u}$ reflects the contribution of large-scale coherent structures, while the random fluctuation velocity $\hat {u}$ reflects the influence of small-scale turbulent structures.
The classical Reynolds stress can be obtained based on the total fluctuation velocity  $u'$. Similarly, the coherent Reynolds stress and the random Reynolds stress can be obtained based on the periodic fluctuation velocity $\tilde {u}$ and the random fluctuation velocity $\hat {u}$, respectively. The three mentioned above have the following relationship (Feng & Wang Reference Feng and Wang2010):
 \begin{equation} \overline{s'q'}=\overline{\tilde{s}\tilde{q}}+\overline{\hat{s}\hat{q}} , \end{equation}
where  $s$ and $q$ represent arbitrary combinations of the velocity components $u$ and $v$. In addition, the turbulent kinetic energy $TKE$ can be decomposed into coherent turbulent kinetic energy $\widetilde {TKE}$ and random turbulent kinetic energy $\widehat {TKE}$, and there is a relation
 \begin{equation} TKE=\widetilde{TKE}+\widehat{TKE}=\tfrac{1}{2}\overline{\tilde{u}_i\tilde{u}_i}+\tfrac{1}{2}\overline{\hat{u}_i\hat{u}_i}. \end{equation}
 The phase information of the periodic or quasiperiodic flows can be extracted from the proper orthogonal decomposition (POD) time coefficient. Details of this method have been provided in previous work (Pan, Wang & Wang Reference Pan, Wang and Wang2013; Xu et al. Reference Xu, Long and Wang2023). The phase angle  $\theta$ of the snapshot can be obtained from the limit cycle formed by the time coefficients $a_1$ and $a_2$ corresponding to the first and second modes of the POD, respectively, as shown in figure 3(a). The mean value of the snapshots with $\theta \pm 5^{\circ }$ is taken as the phase average, and the velocity triple-decomposition is applied to the flow field. It has been checked that the variation of the bin width for $\theta$ from $\theta \pm 1^{\circ }$ to $\theta \pm 10^{\circ }$ does not influence the conclusions in this paper. The coherent turbulent kinetic energy $\widetilde {TKE}$ and random turbulent kinetic energy $\widehat {TKE}$ along the jet centreline are shown in figure 3(b). The coherent turbulent kinetic energy $\widetilde {TKE}$ associated with the large-scale vortex ring dominates the region near the orifice, and gradually decreases to zero as the vortex ring breaks down downstream. In contrast, the random turbulent kinetic energy $\widehat {TKE}$ gradually increases, reaches a peak value when the coherent turbulent kinetic energy $\widetilde {TKE}$ is dissipated, and then gradually decreases to a constant value in the far field. This indicates the process of vortex ring breakdown and the transition of turbulent kinetic energy from large-scale to small-scale.

Figure 3. (a) Limit cycle formed by time coefficients  $a_1$ and $a_2$ that correspond to the first and second modes of the POD, respectively. (b) Variations of the turbulent kinetic energy $TKE$, coherent turbulent kinetic energy $\widetilde {TKE}$ and random turbulent kinetic energy $\widehat {TKE}$, normalised by the local mean jet centreline velocity $\bar {u}_{cl}$.
3.2. Fourier mode decomposition
To determine the dominant region of the vortex ring, Fourier mode decomposition (FMD) (Ma et al. Reference Ma, Feng, Pan, Gao and Wang2015) is applied to the synthetic jet flow field. This method decomposes the flow field data containing multifrequency information into a series of modes according to the characteristic frequency, with each mode corresponding to a specific frequency coherent structure. The following is a brief introduction to FMD.
In the experiment, a time discrete signal  $f_n=f(n \Delta t)$ at a certain point in space is obtained, where $0\leq n \leq N$, $\Delta t=1/f_s$. Here $N$ is the sampling number; $f_s$ is the sampling frequency. The discrete Fourier transform of the signal is as follows:
 \begin{equation} f_n=\sum_{k = 0}^{N-1} c_k {\rm e}^{\mathrm{i} ({2 {\rm \pi}k}/{N}) n} , \end{equation}
where
 \begin{equation} c_k=\frac{1}{N} \sum_{n = 0}^{N-1} f_n {\rm e}^{-\mathrm{i} ({2 {\rm \pi}k}/{N}) n} . \end{equation}
A series of two-dimensional slice data for snapshots are arranged in the temporal dimension to form a three-dimensional matrix  $\boldsymbol{\mathsf{F}}_{\boldsymbol{\mathsf{n}}}$. Applying the Fourier transform to each grid point in space extends the single-point Fourier transform to the entire flow field, yielding a matrix
 \begin{equation} \boldsymbol{\mathsf{c}}_{\boldsymbol{\mathsf{k}}}=\frac{1}{N} \sum_{n = 0}^{N-1} \boldsymbol{\mathsf{F}}_{\boldsymbol{\mathsf{n}}} {\rm e}^{-\mathrm{i} ({2 {\rm \pi}k}/{N}) n} \end{equation}
that contains the spectral information of the entire flow field. Matrix  $\boldsymbol{\mathsf{c}}_{\boldsymbol{\mathsf{k}}}$ can also be written as
 \begin{equation} \boldsymbol{\mathsf{c}}_{\boldsymbol{\mathsf{k}}}=\tfrac{1}{2} \boldsymbol{\mathsf{A}}_{\boldsymbol{\mathsf{k}}} {\rm e}^{-\mathrm{i} \boldsymbol{\varphi}_{\boldsymbol{\mathsf{k}}}} = \tfrac{1}{2} \boldsymbol{\mathsf{A}}_{\boldsymbol{\mathsf{k}}} (\cos{\boldsymbol{\varphi}_{\boldsymbol{\mathsf{k}}}} - \mathrm{i}\sin{\boldsymbol{\varphi}_{\boldsymbol{\mathsf{k}}}}) , \end{equation}
where  $\boldsymbol{\mathsf{A}}_{\boldsymbol{\mathsf{k}}}=2\lvert \boldsymbol{\mathsf{c}}_{\boldsymbol{\mathsf{k}}} \rvert$, $\boldsymbol {\varphi }_{\boldsymbol{\mathsf{k}}}=-\arg {\boldsymbol{\mathsf{c}}_{\boldsymbol{\mathsf{k}}}}$. $\boldsymbol{\mathsf{A}}_{\boldsymbol{\mathsf{k}}}$ is referred to as the global amplitude spectrum, $\boldsymbol {\varphi }_{\boldsymbol{\mathsf{k}}}$ is referred to as the global phase spectrum and $\boldsymbol{\mathsf{c}}_{\boldsymbol{\mathsf{k}}}$ is referred to as the dynamic mode or the Fourier mode. The Frobenius norm of $\boldsymbol{\mathsf{A}}_{\boldsymbol{\mathsf{k}}}$, namely $\lVert \boldsymbol{\mathsf{A}}_{\boldsymbol{\mathsf{k}}} \rVert = \sqrt {\sum a_{ij}^2 }$ ( $a_{ij}$ is the element of the matrix $\boldsymbol{\mathsf{A}}_{\boldsymbol{\mathsf{k}}}$), is defined as the global power spectrum.
The global power spectra based on the streamwise fluctuation velocity  $u'$ are shown in figure 4. The global power spectra for the three cases have clear peaks at $f/f_d=1$ and $f/f_d=2$, corresponding to the driving frequency of the actuator and its harmonics. It indicates that the vortex ring generated by the actuator dominates the near field of the synthetic jet. The periodic evolution of the vortices is accompanied by the periodic variations of the velocities, and the FMD method can trace or map the vortex behaviours with the specified characteristic frequency (Ma et al. Reference Ma, Feng, Pan, Gao and Wang2015). Figure 5 presents the amplitude of the Fourier mode at the characteristic frequency of
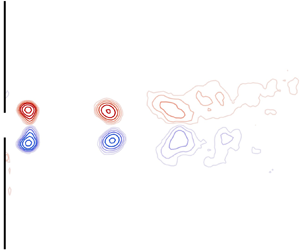
  $f/f_d=1$. The region with high-amplitude represents the region dominated by the vortex ring. The low-amplitude regions on both sides of the centreline in figure 5(a–c) can be considered as the trajectory of the vortex core, since the streamwise fluctuation velocity in this region is less affected by the vortex. The presence of some low-amplitude regions near the centreline of the near field in figure 5(a) may be due to the short stroke in this case, causing these locations to be affected by both the formed vortex ring and the suction cycle, producing a state similar to the node of the standing wave. Similarly, the low-amplitude region on the centreline in figure 5(d–f) can be considered as the centre of the vortex ring, and the radial fluctuation velocity in this region is less affected by the vortex. As the flow develops, the vortex rings break down, accompanied by the disappearance of the high-amplitude region. To determine the vortex ring breakdown position, the amplitudes of the Fourier mode based on the radial fluctuation velocity $v'$ at the characteristic frequency of $f/f_d=1$ along the lines around the edge of the orifice (i.e. $y/D=0.5$) are plotted in figure 6. The approximate linear decreasing parts of the curve are fitted linearly, and the position where the curve decline rate suddenly becomes smaller is taken as the position where the vortex rings break down. It can be determined that the synthetic jet vortex rings break down at approximately $x/D=4.9$, $10.1$ and $14.4$ for Case 1, Case 2 and Case 3, respectively.

Figure 4. Global power spectra based on the streamwise fluctuation velocity  $u'$ for (a) Case 1, (b) Case 2 and (c) Case 3. The red circle marks the peak position.

Figure 5. Amplitude of the Fourier mode for (a,d) Case 1, (b,e) Case 2 and (c,f) Case 3 at the characteristic frequency of  $f/f_d=1$, based on the (a–c) streamwise fluctuation velocity $u'$ and (d–f) the radial fluctuation velocity $v'$.
$v'$.

Figure 6. Amplitude of the Fourier mode for (a) Case 1, (b) Case 2 and (c) Case 3 at the characteristic frequency of  $f/f_d=1$ along the line $y/D=0.5$, based on the radial fluctuation velocity $v'$. The red dashed lines and circles represent the fitting lines and the intersection points of the fitting lines, respectively.
The imaginary part of the complex eigenvalue pair of the velocity gradient tensor, denoted as  $\lambda _{ci}$, can be referred to as the local swirling strength of the vortex (Zhou et al. Reference Zhou, Adrian, Balachandar and Kendall1999), and is used to identify vortices for visually examining the vortex ring breakdown. The phase-averaged $\lambda _{ci}D/U_0$ field is shown in figure 7, with the same contour levels selected in the three cases to plot the vortex evolution. It can be found that the vortex rings maintain a longer streamwise distance as the dimensionless stroke length increases, and their breakdown positions are consistent with those obtained by FMD.

Figure 7. Phase-averaged  $\lambda _{ci}D/U_0$ field of the synthetic jet over a period: (a–d) Case 1; (e-h) Case 2; (i–l) Case 3. Here $\lambda _{ci}$ is normalised by the orifice diameter $D$ and the time-averaged blowing velocity $U_0$. The sign of $\lambda _{ci}$ is identical to the local vorticity.
3.3. Entrainment coefficient
The entrainment coefficient is used to measure the entrainment capacity of jets and plumes, and a detailed description can be found in previous studies (van Reeuwijk & Craske Reference van Reeuwijk and Craske2015; Breda & Buxton Reference Breda and Buxton2018; Xu et al. Reference Xu, Long and Wang2023). The entrainment coefficient in a pure jet can be calculated using the following equation:
 \begin{equation} \alpha=-\frac{{\delta}_m}{2{\gamma }_m}+\frac{Q}{2M^{1/2}}\frac{\partial}{\partial x}(\ln {\gamma }_m)=\alpha_1+\alpha_2 . \end{equation}
The terms in (3.10) are given in table 2. The integral boundary  $r_0$ is selected at the radial position of $\bar {u}=0.02\bar {u}_{cl}$, which is the smallest possible threshold in the present study. A smaller threshold will cause the integral boundary to be outside the FOV or affected by experimental noise at the edge, making it impossible to calculate the entrainment coefficient. It has been checked that the choice of integral boundary $r_0$ from $\bar {u}=0.02\bar {u}_{cl}$ to $\bar {u}=0.1\bar {u}_{cl}$ has little effect on the entrainment coefficient, and does not influence the conclusions in this paper. In (3.10), the first term $\alpha _1$ is related to the production of turbulent kinetic energy, and the second term $\alpha _2$ is related to the shape of the velocity profile. According to the velocity triple-decomposition, the Reynolds stress term in $\alpha _1$ can be further decomposed into the coherent Reynolds stress term and the random Reynolds stress term. Correspondingly, $\alpha _1$ is decomposed into $\tilde {\alpha }_1$ and $\hat {\alpha }_1$, representing the contributions of the coherent turbulent kinetic energy production and the random turbulent kinetic energy production to the entrainment coefficient, respectively.
Table 2. The terms in (3.10) (Breda & Buxton Reference Breda and Buxton2018).

The variations of the entrainment coefficient  $\alpha$ and its components for the three cases are shown in figure 8. The entrainment coefficient shows the same trend for all three cases, increasing to a peak value and then decreasing to a constant value in the far field. The entrainment coefficient in the far field is close to the value of $0.057$– $0.109$ found in previous studies for continuous jets (van Reeuwijk & Craske Reference van Reeuwijk and Craske2015). The entrainment coefficient component $\alpha _2$ is virtually zero, and the components $\tilde {\alpha }_1$ and $\hat {\alpha }_1$ dominate the variation of the entrainment coefficient. Similarly to the variations of the coherent turbulent kinetic energy and random turbulent kinetic energy along the jet centreline, $\tilde {\alpha }_1$ gradually decreases to zero, while $\hat {\alpha }_1$ reaches a peak at the vortex ring breakdown position and completely dominates the entrainment coefficient. Here $\tilde {\alpha }_1$ decreases to zero before the vortex ring breakdown, especially for Case 3, but it is expected that it should decrease to zero at the vortex ring breakdown position. This may be due to the phase identification error caused by the prevalence of multiscale structures in the flow field at large Reynolds number (Pan et al. Reference Pan, Wang and Wang2013), which leads to part of the coherent component being classified as the random component. By identifying the maximum points with zero growth rate of entrainment coefficient, the peak positions of entrainment coefficient are determined, which are located at $x/D=4.9$, $9.1$ and $13.9$ for Case 1, Case 2 and Case 3, respectively. The peak positions of the entrainment coefficient for the synthetic jets in the three cases are consistent with the vortex ring breakdown positions determined above. It is suggested that the enhanced entrainment of the synthetic jet is due to the increase of the random turbulent kinetic energy term caused by the random small-scale turbulent structure.

Figure 8. Variations of the entrainment coefficient  $\alpha$ and its components for Case 1, Case 2 and Case 3.
3.4. Mechanism of entrainment enhanced by vortex ring breakdown
The plots of the random turbulent kinetic energy peak positions and the vortex ring breakdown positions versus the entrainment coefficient peak positions are shown in figure 9. As shown in figure 9(a), the random turbulent kinetic energy peak positions and the entrainment coefficient peak positions are approximately the same for Case 1 and Case 2. For Case 3, the random turbulent kinetic energy peak position shifts to the upstream, which may be due to the increase of phase identification error at large Reynolds number (Pan et al. Reference Pan, Wang and Wang2013). As shown in figure 9(b), the vortex ring breakdown positions match well the entrainment coefficient peak positions. In addition, it should be emphasised that the effect of the Reynolds number and the dimensionless stroke length on the vortex ring breakdown position can be complex and has not been investigated here. Nevertheless, the above results show the correlation between vortex ring breakdown and enhanced entrainment, and the mechanism of how vortex ring breakdown enhances entrainment will be discussed below.

Figure 9. (a) Random turbulent kinetic energy peak positions ( $x_{{peak} \widehat {TKE}}$) versus entrainment coefficient peak positions ( $x_{{peak}\ \alpha }$). (b) Vortex ring breakdown positions based on the amplitudes of the Fourier mode ( $x_{{vortex\ breakdown}}$) versus entrainment coefficient peak positions ( $x_{{peak}\ \alpha }$). The black dashed line has a slope of 1.
Figure 10(a) shows the vortices near the TNTI and the irrotational boundary of the TNTI in the instantaneous snapshot. The irrotational boundary of the TNTI is detected by the vorticity criterion, whose threshold is determined in the plateau region, where the area of the turbulent region decreases with the threshold with a small slope. It ensures that minor changes in the threshold do not affect the results. A detailed description of this procedure can be found in previous studies (Xu et al. Reference Xu, Long and Wang2023). Vortex structures are identified by  $\lambda _{ci}$, whose threshold is selected to be 10 % of the maximum $|\lambda _{ci}|$ value in the flow field. It has been checked that varying the threshold from 5 % to 15 % does not affect the results. Figure 10(b) shows the variations of vorticity magnitude at the centre of the vortex near the TNTI. Here, only those vortices whose centres are less than $15\eta$ away from the irrotational boundary are included in the statistics, where $\eta$ is the local Kolmogorov scale, and $15\eta$ as the thickness of TNTI has been confirmed by previous studies (Zecchetto & da Silva Reference Zecchetto and da Silva2021; Xu et al. Reference Xu, Long and Wang2023). The vorticity magnitude at the centre of the vortex near the TNTI reaches peak value at $x/D=5.1$, $9.3$ and $11.7$ for Case 1, Case 2 and Case 3, respectively, which corresponds to the vortex ring breakdown position. The vortex ring breakdown results in the transfer of turbulent kinetic energy from the coherent large-scale structure to the random small-scale structure, enhancing the vortices near the TNTI. The vortex near the TNTI will induce a counterflow velocity field which implies that fluid from both sides of the TNTI is transported towards the TNTI, resulting in a compressive strain normal to the TNTI and an extensive strain parallel to the TNTI (Watanabe et al. Reference Watanabe, Sakai, Nagata, Ito and Hayase2014; Mistry et al. Reference Mistry, Philip and Dawson2019). The alignment of the extensive strain and the vorticity vector results in a larger enstrophy production, allowing more environment irrotational fluid to gain vorticity, thereby enhancing local entrainment.

Figure 10. (a) Vortices near the TNTI. The black curve represents the irrotational boundary of the TNTI. The green and red circles mark vortices whose centres are less than and greater than  $15\eta$ away from the irrotational boundary, respectively. (b) Variations of vorticity at the centres of vortices with distance of less than $15\eta$ from the irrotational boundary. The conditional average of the vortices over all snapshots is denoted by $\langle \cdot \rangle$.
4. Conclusion
In the present study, the synthetic jets with different Reynolds numbers and dimensionless stroke lengths are measured using the TR-2DPIV technique. The results of velocity triple-decomposition show that the coherent turbulent kinetic energy gradually decreases to zero, while the random turbulent kinetic energy reaches a peak value when the vortex ring breaks down and then decreases to a constant value in the far field, indicating that a transition of turbulent kinetic energy from large-scale to small-scale. The global power spectrum shows that the near field of the synthetic jet is dominated by the vortex ring generated by the actuator. The high-amplitude region in the Fourier mode at the characteristic frequency of  $f/f_d=1$ highlights the region dominated by the vortex ring. According to the streamwise position where the high-amplitude region disappears, it can be determined that the synthetic jet vortex ring breaks down at approximately $x/D=4.9$, $10.1$ and $14.4$ for the three cases, respectively. In addition, the process of vortex ring breakdown is visually examined by the phase-averaged $\lambda _{ci}D/U_0$ field. The entrainment coefficient $\alpha$, which measures the entrainment capacity of jets, is decomposed into three components: ${\tilde {\alpha }}_1$; ${\hat {\alpha }}_1$; $\alpha _2$. These components represent the contribution of the coherent turbulent kinetic energy production term, the random turbulent kinetic energy production term and the shape of the velocity profile to the entrainment coefficient, respectively. The contribution of component $\alpha _2$ is almost negligible. Here ${\tilde {\alpha }}_1$ decreases to zero as the flow develops, while ${\hat {\alpha }}_1$ reaches a peak value at the vortex ring breakdown position and completely dominates the entrainment coefficient. The entrainment coefficient peak positions for the three cases are consistent with the vortex ring breakdown positions determined above. Based on the analysis of the vortices near the TNTI, it is found that the strength of the vortex near the TNTI is enhanced by the vortex ring breakdown, which will lead to the enhancement of the enstrophy production, and thus increase local entrainment.
Funding
This work was supported by the National Natural Science Foundation of China (grant numbers 91852206, 11721202).
Declaration of interests
The authors report no conflict of interest.


