Introduction
General circulation models suggest climate warming will be rapid and pronounced in the Arctic, leading to large reductions in sea ice and other components of the Arctic (Reference Maxwell, Watson, Zinyowera and MossMaxwell and others, 1998). Consistent with the projected warming, passive-microwave derived sea-ice concentrations in the Arctic have decreased in extent (Reference Gloersen and CampbellGloersen and Campbell, 1991; Reference Johannessen, Miles and BjorgoJohannessen and others, 1995; Reference Bjorgo, Johannessen and MilesBjorgo and others, 1997; Reference Cavalieri, Gloersen, Parkinson, Comiso and ZwallyCavalieri and others, 1997), while the passive-microwave derived summer melt season has increased (Reference ParkinsonParkinson, 1992; Reference SmithSmith, 1998b). Nonetheless, it is possible these reductions could be related to naturally occurring local variations in atmospheric or oceanic circulation (Reference WalshWalsh, 1991). A regional assessment of climatically influenced Arctic components would therefore be a valuable addition to understanding spatial and temporal trends in the Arctic. The objectives of this paper are therefore to examine the spatial and temporal variability in passive-microwave-derived snowmelt-onset dates over Arctic sea ice from 1979 to 1998. For the purposes of this study, "snowmelt onset" is defined as the point in time when microwave brightness temperatures first react to the appearance of liquid water in the snowpack. It coincides with the "early melt" season discussed by Reference Livingstone, Singh and GrayLivingstone and others (1987), and it is important to note that melt/freeze cycles may occur after the snowmelt-onset date. An accompanying paper (Reference Drobot and AndersonDrobot and Anderson, 2001) examines how variability in the atmosphere explains some of the spatial and temporal variability observed in this paper.
Computation of Regional Snowmelt-Onset Dates
Snowmelt-onset dates are derived with 25 km2 daily-averaged brightness-temperature data from Scanning Multichannel Microwave Radiometer (SMMR) and Special Sensor Microwave/Imager (SSM/I) radiometers, for the years 1979−98. Since brightness-temperature data originated from four different radiometers, all data were converted to be consistent with the F8 SSM/I data using regression analysis obtained during overlap periods. Brightness temperatures at 18 and 37 GHz horizontal polarizations from the SMMR were converted to F8 data using slope and intercept values provided byReference JezekJezek and others (1991), while brightness temperatures at 19 and 37 GHz from the Fll SSM/I were converted to F8 with values from Reference Abdalati, Steffen, Otto and JezekAbdalati and others (1995). Brightness temperatures from the F13 SSM/I were first converted to Fll using values from Reference Stroeve, Maslanik and XiaomingStroeve and others (1998), and then converted from Fll to F8 with values from Reference Abdalati, Steffen, Otto and JezekAbdalati and others (1995). The conversion of brightness temperatures to a consistent data record is especially important in determining temporal variability in the snowmelt-onset dates. If the data are not consistent, it is possible that temporal trends in the snowmelt-onset dates could be attributed to instrument differences, rather than real-world conditions.
Variations in the snowpack alter the emissivity of the emitting snow-covered sea-ice surface during snowmelt onset, so that the difference between 18 GHz and 37 GHz horizontal polarizations decreases to near zero or below zero (Reference Kunzi, Patil and RottKünzi and others, 1982). The Advanced Horizontal Range algorithm (AHRA; Reference DrobotDrobot, 2000), an updated version of the Horizontal Range algorithm developed by Reference AndersonAnderson (1997), exploits changes in the difference between 18 GHz (19 GHz on SSM/I) and 37 GHz brightness temperatures over a 20 day period to derive snowmelt-onset dates over Arctic sea ice from 1979 to 1998. The AHRA tracks the 18 or 19 GHz horizontal-polarization brightness temperature minus the 37 GHz horizontal-polarization brightness temperature for each data point on each day. If the difference is >4 K at a given point, winter conditions are assumed to exist, and the algorithm continues on to the next day for that point. Conversely, if the difference is −10 K or less (i.e. the 37 GHz horizontal-polarization brightness temperature is 10 K or more greater than the 18/19 GHz horizontal-polarization brightness temperature), then liquid water is assumed to be present in the snowpack, and the AHRA classifies that day as the snowmelt-onset date. In the intermediate phase, when the difference is less than 4 K and greater than −10 K, the AHRA determines if snowmelt onset occurred based upon a 20 day time-series analysis of brightness temperatures. A difference is computed by subtracting the minimum TB(19H) −TB(37H) from the maximum TB(19H) −TB(37H) for the 10 days prior to the potential melt-onset date, as well as for the period from the potential melt-onset date to 9 days later. The former number is subtracted from the latter number, and if this difference is >7.5 K the algorithm assigns melt to that particular pixel. A large difference indicates the pattern in the time series of TB(19H) −TB(37H) has changed, meaning much larger variability in the TB(19H) −TB(37H) range is noticed after the potential melt-onset date. The appearance of liquid water in the snowpack is a likely mechanism to cause this type of change. If the difference remains <7.5 K, then it is unlikely that liquid water is present in the snowpack, and the algorithm moves on to the next day. Additional details on AHRA development and verification are provided in Reference DrobotDrobot (2000). Although the AHRA was developed with 30 case sites spread over Arctic sea ice, it cannot be guaranteed that the AHRA provides an accurate estimate of snowmelt onset at each point in every year.
In order to examine the spatial and temporal variability in snowmelt onset, the snowmelt-onset dates are averaged into 13 regions (Fig. 1), roughly based upon geography. The four regions north of 80° N closely resemble regions developed by Reference SmithSmith (1998a), but the regions in this study are shifted 45° from Reference SmithSmith (1998a) in order to keep snowmelt-onset dates in the Lincoln Sea in one region.

Fig. 1. Regional study sites: 1. east central arctic; 2 mid central arctic; 3 west central arctic; 4. lincoln sea; 5. beaufort sea; 6. canadian arctic archipelago; 7. hudson bay; 8. baffin bay; 9. sea of okhotsk; 10. barents sea; 11. kara sea; 12. laptev sea; 13. east siberian sea.
Spatial variations in the regional snowmelt-onset dates are examined with quartile plots, and Pearson and simple matching binary correlations on median annual snowmelt-onset dates. In order to utilize simple matching binary correlations for spatial analysis, median annual regional snowmelt-onset dates are converted to binary data, with a value of 1 indicating the melt-onset date is one of the ten earliest median melt-onset dates, and a value of 0 indicating the melt date is one of the ten latest median melt-onset dates. The simple matching binary-similarity matrix produces a percentage of the time where the melt anomalies of both regions agree (e.g. an earlier median snowmelt-onset date in one region and an earlier median snowmelt-onset date in another). The higher the value for the simple matching binary statistic, the better the correlation between the two regions. The advantage of the simple matching binary-correlation technique is that comparisons can be made between the regions to highlight whether the timing of earlier (later) snowmelt in one region corresponds with the timing of earlier (later) snowmelt in another region.
Temporal variations in the snowmelt-onset dates are analyzed with regression analysis on the median annual snowmelt dates. Trends in the median, rather than mean, annual snowmelt-onset dates are examined in this study because (a) spatial variability is examined with the median, (b) the median is a more robust measure of central tendency than the mean, and (c) the median is more resistant to outliers (Reference WilksWilks, 1995).
Spatial Variability in the Regional Snowmelt Dates
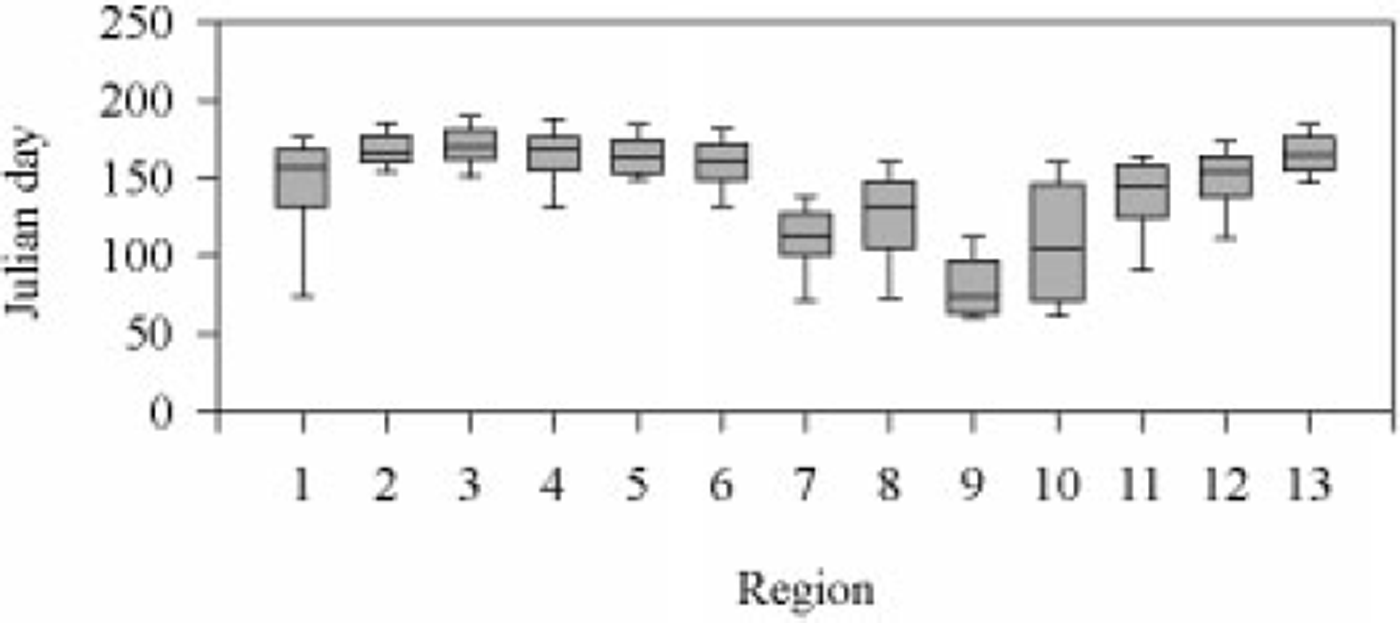
Timing of the median annual snowmelt-onset dates roughly follows latitude, with the most northerly regions generally reaching melt onset later than southerly regions (Fig. 2). For instance, the latest median annual melt-onset date is day 170 in the West Central Arctic, closely followed by day 168 in the Lincoln Sea and day 167 in the Mid Central Arctic. However, the fourth-latest median annual snowmelt-onset date is day 165 in the East Siberian Sea, and not the East Central Arctic, even though the East Central Arctic is at a much higher latitude than the East Siberian Sea. The median annual melt-onset date in the East Central Arctic (day 157) is only the seventh-latest date, behind the aforementioned regions as well as the Beaufort Sea (day 163) and the Canadian Arctic Archipelago (day 160). Presumably, land-/ice-locked and ice-free areas upwind of a particular region create different climate regimes which subsequently hinder or enhance early arrival of snowmelt.

Fig. 2. Spatial variability in regional snowmelt-onset dates as illustrated by quartile plots.
A more dynamic climate associated with the presence of ice-free ocean could also account for the larger variability in snowmelt-onset dates, expressed as the interquartile range (gray shaded areas in Fig. 2), observed in areas such as the Barents Sea. In contrast, the interquartile range in the Beaufort Sea and the Canadian Arctic Archipelago is much smaller, possibly because the land-/ice-locked areas lead to a more stable climate regime.
Pearson correlation analysis implies that median regional annual melt-onset dates are largely independent of one another (Table 1), as only 17% (13 of 78) of the correlations are statistically significant. While many of the significant correlations are found between neighboring regions, the lack of many strong correlations between non-adjacent regions suggests that factors influencing snowmelt onset, such as atmospheric conditions, are regional in scale. Accordingly, Reference Drobot and AndersonDrobot and Anderson (2001) explore relationships between atmospheric conditions and regional snowmelt-onset dates. The abundance of non-significant correlations also implies that many of the regions are independent of one another, and therefore an examination of temporal trends in snowmelt-onset dates should be performed on a regional basis.
Table 1. Pearson correlations between regions. significant relationships at a = 0.05 indicated by bold text

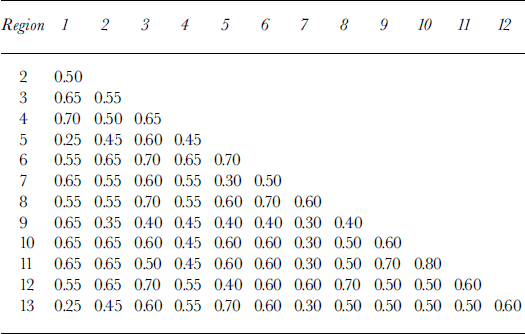
Correlation analysis based on the simple matching binary statistic also indicates that there are regional differences in snowmelt onset (Table 2). For instance, earlier (later) median snowmelt-onset dates in the East Central Arctic correspond with earlier (later) median snowmelt-onset dates in the Beaufort and East Siberian Seas in only 5 of the 20 years (25% of the time). Additionally earlier snowmelt-onset dates in Hudson Bay are associated with earlier snowmelt-onset dates in the Beaufort, Barents, Kara and Laptev Seas and the Sea of Okhotsk only 30% of the time. An examination of these regions (Fig. 1) indicates they are generally located on opposite sides of the Northern Hemisphere, suggesting a hemispheric dichotomy in snowmelt-onset dates is present. Temporal variations in snowmelt dates should therefore be monitored on regional scales, since a positive trend in the East Central Arctic and a negative trend in the Beaufort Sea, for example, could average into no trend when analyzed at the hemispheric scale.
Table 2. Simple matching binary-similarity matrix correlations

Temporal Variability in the Regional Snowmelt Dates
Temporal variations in regional snowmelt-onset dates are illustrated with box plots constructed for each region (Fig. 3). Interannual variability in snowmelt-onset dates is prominent in several regions, in terms of both the interquartile range and the median annual melt-onset date. In regions such as the East Central Arctic, Baffin Bay and the Barents Sea, large fluctuations are noticeable in the interquartile range, while in regions such as the Mid Central Arctic, West Central Arctic and the Beaufort Sea the interquartile range is consistently small. Additionally, the median melt-onset date in some regions, such as the East Central Arctic, is fairly consistent from year to year, while in other regions, such as the East Siberian Sea, the median melt-onset date varies considerably from year to year. Reference Drobot and AndersonDrobot and Anderson (2001) discuss how variations in atmospheric conditions may be responsible for some of the large fluctuations noted in these regions.

Fig. 3. Temporal variability in median annual melt-onset dates for each region. gray lines indicate linear regression slopes. slope values and significance indicated in table 3
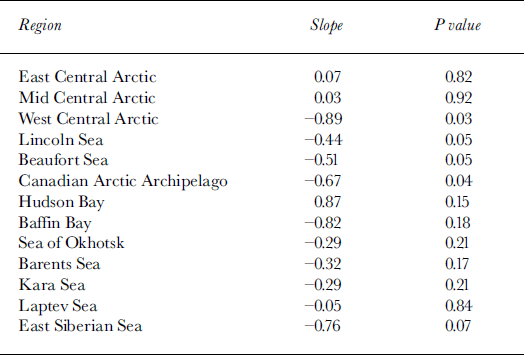
Temporal trends in regional snowmelt-onset dates are shown with regression analysis. Regression slopes for each region (Table 3) indicate trends towards earlier snowmelt onset are present (a = 0.05) in the West Central Arctic, Lincoln Sea, Beaufort Sea and the Canadian Arctic Archipelago. Considering that these regions are located adjacent to one another (Fig. 1), it is clear that there is a statistical trend towards earlier snowmelt across much of the western Arctic. These results contrast with the findings of Reference SmithSmith (1998a), who noted no significant trends in his regional analysis of snow-melt onset. There are, however, several factors that might explain the differences between the studies. One possibility is the difference in spatial coverage. In two of the regions where statistically significant trends are noted in this study, Reference SmithSmith (1998a) has limited coverage (Beaufort Sea) or no coverage (Canadian Arctic Archipelago), because Reference SmithSmith (1998a) does not analyze first-year ice regions. Additionally, the regions above 80° N in this study are offset 45° from the Reference SmithSmith (1998a) study. As previously mentioned, this was done to ensure snowmelt dates from the Lincoln Sea are grouped together. It is feasible that the differences in spatial coverage could lead to contrasting results.
Table 3. Regression slopes by region

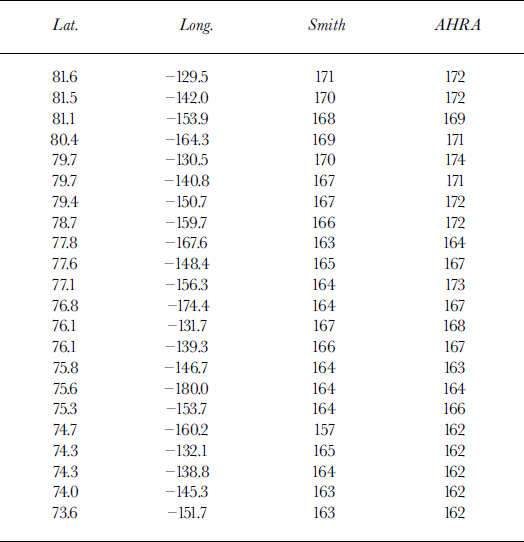
Another possibility is the differences in the calculation of snowmelt-onset dates. Although a comparison of snowmelt-onset dates between the two studies shows good agreement over selected case sites in 1992 (Table 4), Reference SmithSmith (1998a) did not create a consistent brightness-temperature record between the SMMR and SSM/I radiometers. Therefore, Reference SmithSmith (1998a) may not show statistically significant trends because of sensor bias.
Table 4. Comparison of ahra snowmelt-onset dates with smith (1998a) snowmelt-onset dates in 1992

A third possibility is the difference in temporal coverage between the studies, since the present study examined snowmelt dates from 1979 to 1998, while the Reference SmithSmith (1998a) study examined snowmelt dates from 1979 to 1996. However, regression slopes run for each of the regions in this study from 1979 to 1996 still indicate significant trends towards earlier snowmelt onset (a = 0.05) in the West Central Arctic, Beaufort Sea and the Canadian Arctic Archipelago. It therefore seems unlikely that the temporal differences between the studies could account for the contrasting results.
Although these findings disagree with results from Reference SmithSmith (1998a), they do agree with a study by Reference ParkinsonParkinson (1992) concerned with variability in the length of the sea-ice season. Using passive-microwave data, Reference ParkinsonParkinson (1992) noted a shortening of the sea-ice season in the Kara and Barents Seas, the Sea of Okhotsk and part of the Arctic Ocean. While quantitative studies have not examined the fink between snowmelt onset and the length of the sea-ice season, it is reasonable to hypothesize earlier snowmelt onset could lead to greater energy absorption into the sea-ice volume, leading to earlier ablation, and shortening the sea-ice season. It is hoped the results presented here will stimulate future research into snowmelt-sea-ice interactions.
Summary
Utilizing brightness-temperature data from SMMR and SSM/I radiometers, snowmelt-onset dates were computed over Arctic sea-ice surfaces, and subsequently stratified in 13 regions. An examination of the spatial variability in snow-melt onset suggested the timing of snowmelt onset in a given region within a given year is largely independent of the timing of snowmelt onset in most other regions. A reasonable hypothesis is that the spatial variations in snowmelt onset are influenced by local atmospheric conditions.
An examination of temporal variability in regional snowmelt onset further demonstrated large interannual variations in median snowmelt-onset dates and interquartile ranges for most of the regions. Variations in atmospheric conditions are again a likely explanation for the observed variability. In addition, regression analysis illustrated significant trends towards earlier snowmelt onset in the West Central Arctic, Lincoln Sea, Beaufort Sea and Canadian Arctic Archipelago regions. These findings contrast with the results of an earlier study by Reference SmithSmith (1998a), but are in rough agreement with decreases in the sea-ice season noted by Reference ParkinsonParkinson (1992). While the trends in snowmelt-onset dates support climate-model projections of surface temperature warming in the Arctic, a longer temporal record would be valuable to ascertain whether the observed trends are indeed an indication of a changing climate, or whether they are simply part of a long-term oscillation.
Acknowledgements
This work was supported by NASA grant NGT5−30175. Brightness-temperature data were obtained from the U.S. National Snow and Ice Data Center in Boulder, CO. The authors would also like to thank the reviewers for their useful comments.


