


Vitamin D is a fat-soluble nutrient with steroid-like actions in the body, and is essential for calcium homeostasis and bone metabolism. Vitamin D is also involved in immune function and glucose metabolism, and low vitamin D status is associated with an increased risk of several diseases including diabetes, cancer, CVD and multiple sclerosis(Reference Autier, Boniol and Pizot1–Reference Wang3). Vitamin D has two vitamers, ergocalciferol (vitamin D2) and cholecalciferol (vitamin D3). Vitamin D2 and D3 are metabolised in the same way, undergoing a two-step hydroxylation in the liver and kidneys to produce 25-hydroxyvitamin D (25(OH)D) and then 1,25-dihydroxyvitamin D(Reference Bikle4). Vitamin D3 is synthesised in the skin following UVB ray exposure. Endogenous vitamin D3 synthesis does not always meet physiological needs due to location, age, skin-protective practices or skin pigmentation(Reference Reddy and Gilchrest5). Therefore, dietary vitamin D is important to meet minimum requirements. Vitamin D status is measured via circulating 25(OH)D concentrations and the Institute of Medicine define 25(OH)D >50, <50 and <30 nmol/l as vitamin D sufficient, insufficient and deficient, respectively(Reference Ross, Manson and Abrams6). Countries at northern latitudes tend to have higher rates of vitamin D insufficiency. In Ireland, 27 % of older adults are vitamin D insufficient during the summer months, increasing to 59 % during the winter months when UVB exposure is low(Reference Laird, O'Halloran and Carey7). In addition, the mean daily intake of vitamin D for older adults in Ireland is 6⋅9 ± 10⋅5 μg, with 87 % of men and 77 % of women having intakes below the RDA of 15–20 μg(8,9) .
Dairy products, bread and breakfast cereals are the most commonly vitamin D fortified foods. In countries with no mandatory fortification policy, data modelling shows that vitamin D food fortification can improve vitamin D intakes(Reference Hirvonen, Sinkko and Valsta10). In Finland, for example, data modelling studies led to a mandatory vitamin D food fortification policy which increased population 25(OH)D concentrations by 18 nmol/l(Reference Hirvonen, Sinkko and Valsta10,Reference Jaaskelainen, Itkonen and Lundqvist11) . However, food matrix and composition may alter vitamin D absorption and bioavailability(Reference Goncalves, Gleize and Roi12,Reference Itkonen, Skaffari and Saaristo13) , thus proposed fortification strategies may not be as successful as documented in data modelling studies. Therefore, before mandatory vitamin D food fortification policies are implemented, we need a more complete understanding of vitamin D absorption and how we can manipulate fortified foods to maximise vitamin D absorption. Increasing mandatory vitamin D food fortification policy effectiveness will increase population 25(OH)D concentrations and potentially lead to other health benefits for older adults. This review will synthesise the literature describing data modelling exercises to determine the impact of vitamin D fortification scenarios, the potential to manipulate fortified foods to improve vitamin D absorption and randomised controlled trials (RCT) that compare the effect of different types of fortified foods on the vitamin D status in an attempt to evaluate the potential of using vitamin D fortification to improve vitamin D bioaccessibility, intakes and status.
Increasing vitamin D intakes using food fortification
Increasing dietary vitamin D intakes is most effective at improving vitamin D status as UVB exposure varies across countries and seasons and carries skin cancer risk. However, supplement compliance and dietary vitamin D intake from natural food sources are low(Reference Laird, O'Halloran and Carey7,14) . Therefore, policy makers, researchers and manufacturers must look to commonly consumed foods when considering vitamin D fortification. Vitamin D2 or D3 can be added to foods using traditional fortification or biofortification. Traditional fortification usually involves the addition of a vitamin D premix to foods during processing in controlled amounts(Reference Hayes and Cashman15). Premixes are a blend of vitamins and minerals in a carrier, which may be an oil blend, dried dairy powder or dried grains, depending on the food product. Biofortification typically involves increasing the vitamin D content of animal products, such as eggs, meat or fish, by supplementing animal diets with vitamin D, or by animal or mushroom UV exposure(Reference Hayes and Cashman15,Reference Dunlop, Kiely and James16) . This review will focus on traditional vitamin D food fortification and will indicate vitamin D2 or D3. Vitamin D fortification policies vary worldwide and can be classified into three groups: mandatory fortification (implemented in Canada and Finland), voluntary fortification (implemented in Ireland and the UK) and limited fortification (remainder of Europe and Asia)(Reference Calvo, Whiting and Barton17). Mandatory vitamin D fortification policies are implemented as few foods are naturally vitamin D rich, supplement compliance is low and mandatory food fortification does not require behaviour change(Reference Tylavsky, Lyytikäinen and Cheng18,Reference Lamberg-Allardt, Outila and Karkkainen19) . Vitamin D fortification policies successfully increase vitamin D intakes, and countries with mandatory fortification policies have intakes that are about 2–3 μg greater than those with voluntary food fortification(Reference Jaaskelainen, Itkonen and Lundqvist11,14,Reference Moore, Radcliffe and Liu20,21) .
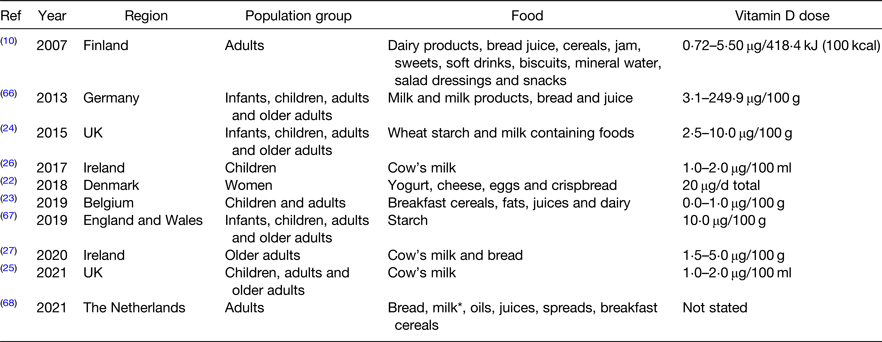
Vitamin D food fortification data modelling studies have resulted in successful national fortification policies(Reference Hirvonen, Sinkko and Valsta10,Reference Jaaskelainen, Itkonen and Lundqvist11) . Finland introduced mandatory vitamin D fortification of liquid dairy products (1 μg/418⋅4 kJ (100 kcal)) and fat spreads (20 μg/100 g) following a modelling study reporting a potential increase in vitamin D intakes of about 21 μg/d when several foods were fortified simultaneously(Reference Hirvonen, Sinkko and Valsta10). A subsequent study using nationally representative data reported that vitamin D intakes doubled as a result of mandatory fortification(Reference Jaaskelainen, Itkonen and Lundqvist11). Several other countries without a mandatory vitamin D fortification policy are now examining the potential impact of fortification across different population subgroups (Table 1)(Reference Gronborg, Tetens and Ege22,Reference Moyersoen, Devleesschauwer and Dekkers23) . For example, a Danish study modelled seven strategies with a combination of fish, vitamin D3 fortified foods and dietary supplements(Reference Gronborg, Tetens and Ege22). With fortified foods alone, the 5th and 99th percentiles for vitamin D intake were 21⋅0 and 23⋅6 μg, respectively(Reference Gronborg, Tetens and Ege22). Similarly, a Belgian data modelling study using national survey data examined the effect of sixty-three fortification combinations including breakfast cereals, bread, fruit juice, fats and oils, milk and milk beverages, yogurt and cream cheese(Reference Moyersoen, Devleesschauwer and Dekkers23). All six food groups fortified at 0⋅47 μg/4⋅184 kJ (1 kcal) were safest and most effective for all population groups(Reference Moyersoen, Devleesschauwer and Dekkers23). Fortification above 0⋅47 μg/4⋅184 kJ (1 kcal) resulted in intakes above the tolerable upper limit in children, highlighting the importance of fortification modelling across all cohorts before implementation(Reference Moyersoen, Devleesschauwer and Dekkers23).
Table 1. Characteristics of vitamin D food fortification data modelling studies
* Milk type not stated.
Although mandatory folic acid fortification was recently announced in the UK, a vitamin D policy does not yet exist. Therefore, Allen et al. modelled milk and starch vitamin D2 and vitamin D3 fortification using UK National Diet and Nutrition Survey data(Reference Allen, Dangour and Tedstone24). Vitamin D fortification of starch was modelled at a concentration of 5–30 μg/100 g and milk in a range of 0⋅5–7 μg/100 g(Reference Allen, Dangour and Tedstone24). Fortifying wheat starch with 10 μg/100 g was most effective at increasing population vitamin D intakes whilst keeping the entire sample below the tolerable upper limit; increasing the mean daily intake from 3⋅7 to 10⋅8 μg and reducing the proportion of the population not meeting intake recommendations from 93 to 50 %(Reference Allen, Dangour and Tedstone24). Contrary to other studies that fortified multiple foods(Reference Hirvonen, Sinkko and Valsta10,Reference Gronborg, Tetens and Ege22) , fortifying milk and starch together at a lower concentration was not as effective as fortifying starch only at a higher concentration(Reference Allen, Dangour and Tedstone24). Another very recent study also using National Diet and Nutrition Survey data reports that cow's milk vitamin D3 fortification in the UK would increase the proportion meeting intake recommendations by about 12 %(Reference Weir, Johnston and Lowis25). Lastly two studies have modelled the effect of fortification on vitamin D intakes in preschool children and older adults in Ireland(Reference Kehoe, Walton and McNulty26,Reference McCourt, McNulty and Walton27) . In preschool children, low-dose cow's milk fortification increased intakes by 1⋅9–4⋅3 μg(Reference Kehoe, Walton and McNulty26). Similarly in older adults, mandatory cow's milk vitamin D3 fortification would increase intakes by 2–4 μg and bread vitamin D3 fortification would increase intakes by 3–9 μg(Reference McCourt, McNulty and Walton27). While the results from these studies are promising, modelling has not been completed in school-aged children, teenagers or adults in Ireland, thus the results are not applicable to the entire population. Regardless, these studies provide evidence that vitamin D food fortification could effectively increase vitamin D intakes in Ireland. Although modelling studies are promising, an ineffective ‘blanket’ approach is often used and targeting foods such as dairy products does not account for non-consumers or lower consumption rates in certain population groups(Reference Gronborg, Tetens and Christensen28). Before fortification is implemented, modelling studies should assess the potential of fortifying multiple foods groups, and RCT should demonstrate their effectiveness on vitamin D status over time.
Increasing vitamin D bioaccessibility and bioavailability
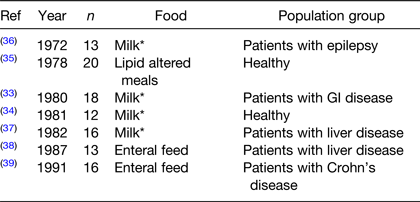
Older in vitro and radiolabelled studies suggest that vitamin D absorption from a usual diet is about 80 %, but beyond that very little is known about vitamin D absorption from fortified foods(Reference Borel, Caillaud and Cano29–Reference Reboul32). Most of the published literature dates to the 1970s and 1980s and most studies compare vitamin D absorption in disease cases where absorption might be compromised (Table 2)(Reference Davies, Mawer and Krawitt33–Reference Leichtmann, Bengoa and Bolt39). One of the first studies describing vitamin D3 absorption in healthy participants reported the importance of the lipid component of the food/meal for vitamin D absorption(Reference Barragry, France and Corless35). However, there is a significant gap in the literature until very recently when results from two postprandial studies were published(Reference Dawson-Hughes, Harris and Lichtenstein40,Reference Guo, Jackson and Che Taha41) . Dawson-Hughes et al. showed that consuming a vitamin D3 supplement with a lipid-containing meal increases absorption by about 32 %(Reference Dawson-Hughes, Harris and Lichtenstein40). The second study compared the effects of 25(OH)D or vitamin D3 fortification in a high-lipid dairy drink(Reference Guo, Jackson and Che Taha41). Postprandial 25(OH)D concentrations were significantly higher after the 25(OH)D drink compared to the vitamin D3 drink. The results from this study suggest that vitamin D3 absorption and/or hydroxylation is incomplete when added in a traditional form and provides evidence that 25(OH)D fortification could be considered as an alternative(Reference Guo, Jackson and Che Taha41). Although limited, this research suggests that lipids are important for vitamin D absorption and that dairy drinks are an effective delivery system.
Table 2. Characteristics of postprandial radiolabelled vitamin D studies
* Milk type not stated.
Building on the human evidence, recent in vitro studies examined the impact of different fatty acids (FA) and combinations of FA on vitamin D3 absorption(Reference Goncalves, Gleize and Roi12,Reference Ozturk, Argin and Ozilgen42,Reference Fratter and Pellizzato43) . For example, based on previous cholesterol work and the fact that vitamin D is derived from cholesterol, Goncalves et al. hypothesised that vitamin D3 micelle formation could be altered by different dietary lipids(Reference Goncalves, Gleize and Roi12). Using Caco-2 cells, the authors examined the effect of single FA, mixed FA mimicking dietary oils, and micelles produced in vitro on vitamin D3 uptake and efflux from cells(Reference Goncalves, Gleize and Roi12). Results showed that long-chain FA and PUFA decreased vitamin D3 absorption in this model, whilst MUFA, particularly oleic acid, increased absorption(Reference Goncalves, Gleize and Roi12). There were no negative effects on uptake when long-chain FA were given in combination with other FA(Reference Goncalves, Gleize and Roi12). Oleic acid also improved vitamin D3 secretion from the enterocyte which was in line with previous findings, and the authors hypothesised that this is due to increased chylomicron synthesis(Reference Goncalves, Gleize and Roi12,Reference Reboul, Goncalves and Comera44) . MUFA decreased mRNA expression of NPC1L1, which is essential for cholesterol (and potentially vitamin D3) transport across the brush border membrane of the intestine, but oleic acid had no effect(Reference Goncalves, Gleize and Roi12). As a result, the authors suggest that pre-formed micelles comprised of oleic acid would improve vitamin D3 absorption(Reference Goncalves, Gleize and Roi12).
Another study examined vitamin D3 bioaccessibility from lipid emulsions(Reference Ozturk, Argin and Ozilgen42). The authors used long-chain TAG and medium-chain TAG oils rather than free FA, and an in vitro digestion model rather than a cell model(Reference Ozturk, Argin and Ozilgen42). Despite these differences, results were similar to that of Goncalves et al.(Reference Goncalves, Gleize and Roi12), suggesting that a chain length of 16–18 carbons is optimal for vitamin D3 absorption(Reference Ozturk, Argin and Ozilgen42). The authors hypothesised that this is due to long-chain TAG forming mixed micelles that can accommodate large molecules, such as vitamin D3, and have a higher solubility(Reference Ozturk, Argin and Ozilgen42,Reference Qian, Decker and Xiao45) . A more recent in vitro study examined the effects of pre-formed oleic acid vitamin D3 micelles or vitamin D3 in oil mixtures on vitamin D3 bioaccessibility in a Caco-2 model(Reference Fratter and Pellizzato43). The results support those of Goncalves et al.(Reference Goncalves, Gleize and Roi12), reporting higher vitamin D3 bioaccessibility and cellular uptake from the pre-formed micelle compared to the oil mixture(Reference Fratter and Pellizzato43). To date, only one human study has examined how different lipids effect vitamin D3 absorption(Reference McCourt, Mulrooney and O'Neill46). This cross-over postprandial study examined changes in 25(OH)D following a vitamin D3 fortified olive oil, fish oil or non-lipid dairy drink compared to a preformed vitamin D3 micelle dairy(Reference McCourt, Mulrooney and O'Neill46). The vitamin D3 olive oil dairy drink increased 25(OH)D in vitamin D-insufficient participants, but there was no change in 25(OH)D following other fortified drinks(Reference McCourt, Mulrooney and O'Neill46). This research suggests that the lipid/FA composition of fortified foods will impact vitamin D3 absorption, and that the effect is different depending on vitamin D status(Reference McCourt, Mulrooney and O'Neill46). Although these results show potential for improving vitamin D absorption by manipulating the lipid delivery system within a food, they also highlight the gap in the literature; as currently no studies have examined these effects using an RCT design. Therefore, before these in vitro results can inform food fortification, we must perform more well-designed human postprandial studies and RCT.
Vitamin D food fortification randomised controlled trials
A large body of high-quality work reports the effects of vitamin D supplementation on 25(OH)D(Reference Tripkovic, Lambert and Hart47,Reference Zhang, Fang and Tang48) ; however, this review focuses on vitamin D food fortification specifically. Most vitamin D food fortification trials focus on a single food group like some modelling studies(Reference Weir, Johnston and Lowis25,Reference Kehoe, Walton and McNulty26) . In 2012, Black et al.(Reference Black, Seamans and Cashman49) updated a systematic review and meta-analysis on the efficacy of vitamin D fortified foods published by O'Donnell et al. in 2008(Reference O'Donnell, Cranney and Horsley50). The updated meta-analysis reports a treatment effect of 19⋅4 nmol/l and an increase of 1⋅2 nmol/l per 1 μg vitamin D in fortified foods(Reference Black, Seamans and Cashman49). However, there was significant study heterogeneity due to different population groups, vitamin D fortification concentrations and study durations. Since 2012, several vitamin D fortification studies have been published. The next section of this review examines the more recent studies and summarises the available evidence to support vitamin D food fortification strategies in non-pregnant adults (Tables 3 and 4).
Table 3. Characteristics of vitamin D fortification randomised controlled trials
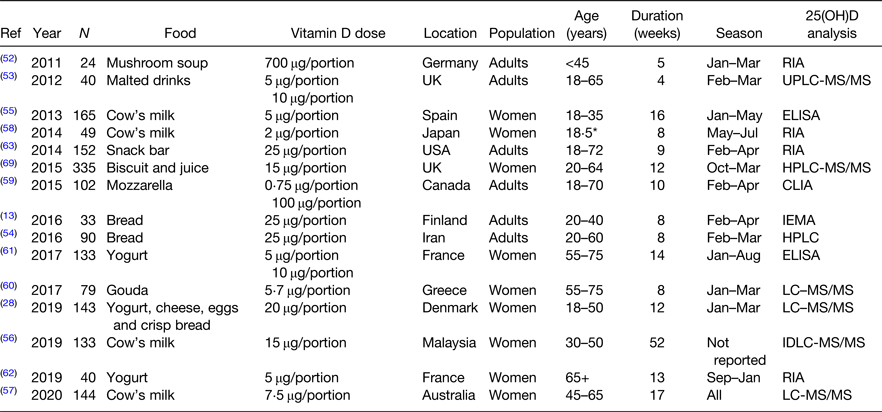
Ref, reference; LC-MS/MS, liquid chromatography tandem MS; IDLC-MS/MS, isotope dilution liquid chromatography tandem MS.
* Mean age.
Table 4. Circulating 25(OH)D in vitamin D fortification randomised controlled trials
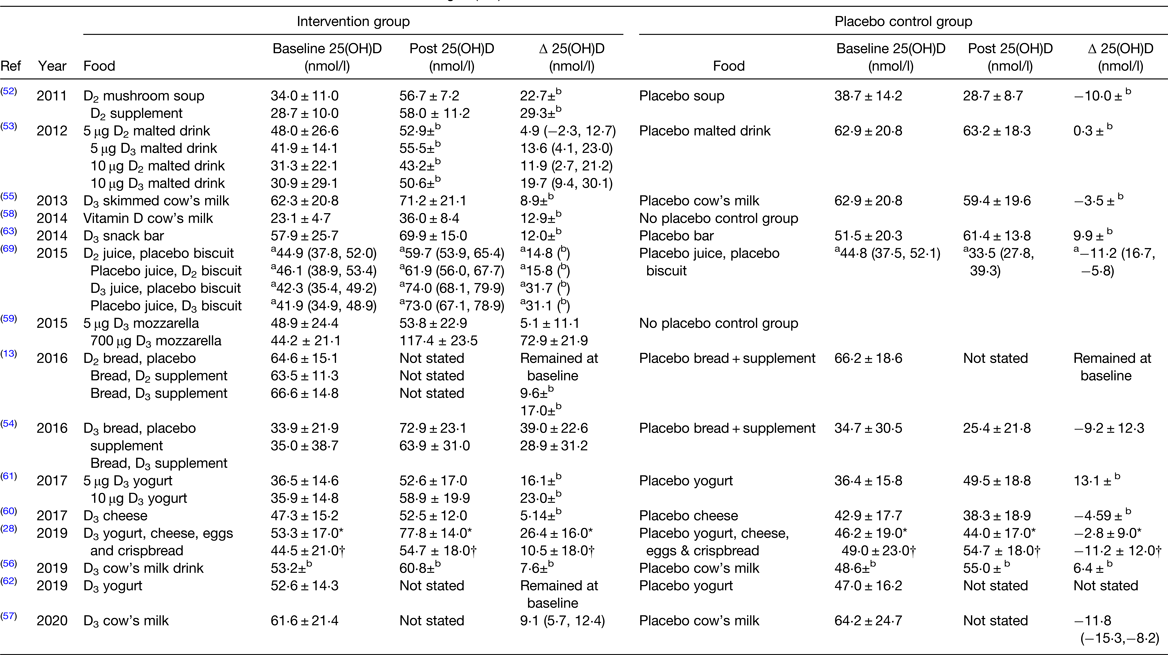
Ref, reference; 25(OH)D, 25-hydroxyvitamin D.
Data reported as mean ± standard deviation unless otherwise state.
a 95% CI; bdata not reported.
* Danish cohort.
† Pakistani cohort.
Vitamin D2 v. vitamin D3 fortification
There is a debate as to whether or not vitamin D2 and vitamin D3 supplementation are bioequivalent. A recent meta-analysis concluded vitamin D3 is superior to D2 when delivered as supplements or inter-muscular injections(Reference Tripkovic, Lambert and Hart47), but newer food fortification studies yield mixed results(Reference Itkonen, Skaffari and Saaristo13,Reference Tripkovic, Wilson and Hart51–Reference Nikooyeh, Neyestani and Zahedirad54) . One food fortification RCT found no difference in vitamin D2 bioavailability between mushroom soup and supplements(Reference Urbain, Singler and Ihorst52). Another study compared 25(OH)D concentrations following a 4-week intervention with 5 or 10 μg vitamin D2 or D3 fortified malted drinks(Reference Fisk, Theobald and Sanders53). Data analysis indicated that 1 μg of vitamin D in a fortified malted drink resulted in an about 2 nmol/l increase of 25(OH)D, with equal increments in the D2 and D3 groups(Reference Fisk, Theobald and Sanders53). However, as there were only eight participants in each group, these results should be confirmed in a larger cohort(Reference Fisk, Theobald and Sanders53). In contrast, another study showed that vitamin D2 from irradiated yeast is not bioavailable(Reference Itkonen, Skaffari and Saaristo13). Participants consumed a regular bread and placebo supplement, regular bread and vitamin D2 supplement, regular bread and vitamin D3 supplement or vitamin D2 bread and placebo supplement daily for 8 weeks. Total 25(OH)D did not increase from baseline in the vitamin D2 bread and placebo group but increased by 9⋅6 and 17⋅0 nmol/l in the vitamin D2 and D3 supplement groups, respectively(Reference Itkonen, Skaffari and Saaristo13). The reason for the poor bioavailability of vitamin D2 irradiated yeast is unclear but may be due to the baking process or vitamin D2 being indigestible in this form(Reference Itkonen, Skaffari and Saaristo13). In contrast, another study reports vitamin D3 bioavailability from bread when a vitamin D3 premix was added to starch, rather than using irradiated yeast(Reference Nikooyeh, Neyestani and Zahedirad54). Participants consumed either 25 μg fortified bread with placebo supplement, placebo bread with a 25 μg vitamin D supplement or placebo supplement and bread for 8 weeks(Reference Nikooyeh, Neyestani and Zahedirad54). There was no difference in 25(OH)D increase between the vitamin D supplement or vitamin D bread groups(Reference Nikooyeh, Neyestani and Zahedirad54).
Tripkovic et al. also compared vitamin D2 and D3 when consumed from a fortified orange juice or biscuit(Reference Tripkovic, Wilson and Hart51). Participants consumed either a placebo juice and biscuit, 15 μg vitamin D2 juice and placebo biscuit, placebo juice and a 15 μg vitamin D2 biscuit, placebo biscuit and 15 μg vitamin D3 juice or finally a 15 μg vitamin D3 biscuit and placebo juice for 12 weeks. Serum 25(OH)D changed by 14⋅8, 15⋅8, 31⋅8 and 31⋅1 nmol/l for the vitamin D2 juice, vitamin D2 bread, vitamin D3 juice and vitamin D3 bread groups, respectively(Reference Tripkovic, Wilson and Hart51). Vitamin D in both forms was efficacious from orange juice and biscuits, however vitamin D3 bioavailability was superior(Reference Tripkovic, Wilson and Hart51). Results from these studies suggest that food structure, fortification type and the vitamer impact vitamin D bioavailability. This level of knowledge is important for targeting improved status for subgroups of the population, particularly those who avoid certain food groups, e.g. vegetarians.
Dairy vitamin D fortification studies
Other studies focus on vitamin D fortification of dairy products due to cost-effectiveness, high consumption rates and bioavailability (Table 4). Some countries, such as Canada and Finland, already mandate vitamin D fortification of all fluid milks(Reference Jaaskelainen, Itkonen and Lundqvist11,Reference Calvo, Whiting and Barton17) . However, other countries have published data supporting fortification where it is not yet mandated. In Spain, a 5 μg vitamin D fortified skimmed cow's milk daily for 16 weeks increased by 25(OH)D concentrations by 8⋅9 nmol/l with high compliance and no adverse side effects(Reference Toxqui, Blanco-Rojo and Wright55). In a Chinese cohort, a 15 μg fortified cow's milk increased 25(OH)D concentrations by 7⋅6 nmol/l over a 1-year period(Reference Kruger, Chan and Lau56). In Australia, a 7⋅5 μg vitamin D fortified cow's milk increased 25(OH)D concentrations by 9⋅1 nmol/l after 4 months(Reference Daly, Gianoudis and De Ross57). Lastly, in Japan, a 2 μg vitamin D fortified cow's milk consumed daily for 8 weeks increased serum 25(OH)D by 56 %, although this figure likely overestimates the impact of the fortified food as the data were collected during summer months(Reference Suzuki, Maruyama-Nagao and Sakuraba58). All of these studies report a significant increase in 25(OH)D concentrations in response to vitamin D fortified milks; however, it is worth noting that all studies recruited female participants only. The bias towards female recruitment is likely due to the role vitamin D plays in bone health and the higher risk of osteoporosis in females. Regardless, it will be important to determine the efficacy of vitamin D fortified foods for males also, particularly if a mandatory vitamin D fortification policy is expected.
Other studies have used other dairy foods to deliver vitamin D. A Canadian study reported increases in serum 25(OH)D when participants consumed a cheese pizza once weekly for 8 weeks, fortified with 5 or 700 μg of vitamin D(Reference Al-Khalidi, Chiu and Rousseau59). Pizza containing the higher dose of vitamin D increased serum 25(OH)D concentrations by 72⋅9 nmol/l; however, very high-dose fortification is unlikely from a policy perspective. In contrast, an 8-week study with fortified Gouda(Reference Manios, Moschonis and Mavrogianni60) and a 6-month study with fortified yogurt(Reference Bonjour, Dontot-Payen and Rouy61) in the range of 5–10 μg improved 25(OH)D concentrations to sufficiency with no adverse effects reported. Similarly, in a fortification trial in France, a daily 5 μg vitamin D3 yogurt was effective at maintaining baseline 25(OH)D concentrations of older women during the winter months(Reference Beauchet, Launay and Galery62). These results show that a vitamin D fortified yogurt is effective at preventing the expected seasonal decline in 25(OH)D in vitamin D-sufficient participants and could be used to maintain year-round vitamin D status. This recent research supports the safety and efficacy of dairy product vitamin D fortification and its effectiveness at increasing 25(OH)D concentrations and preventing seasonal declines in vitamin D status in vitamin D-sufficient groups.
Other food vitamin D fortification studies
Finally, other studies have examined snack bar(Reference Gaffney-Stomberg, Lutz and Rood63), bread and juice(Reference Gronborg, Tetens and Christensen28) vitamin D fortification, accounting for non-consumers of dairy at a population level. In one study, vitamin D-sufficient participants undergoing army combat training consumed either a placebo snack bar or a bar fortified with 1032 mg calcium and 15 μg vitamin D for 9 weeks(Reference Gaffney-Stomberg, Lutz and Rood63). Vitamin D was bioavailable from the bar and effectively maintained vitamin D sufficiency, as serum 25(OH)D increased by 4⋅8 nmol/l in the treatment group, and participants did not experience any adverse effects(Reference Gaffney-Stomberg, Lutz and Rood63). Lastly, a large RCT examined the effectiveness of multiple food fortification in a Danish and Pakistani cohort(Reference Gronborg, Tetens and Christensen28). A combination of yogurt, cheese, eggs and crisp bread provided participants with 20 μg/d, increasing 25(OH)D by 26⋅4 and 10⋅5 nmol/l in Danish and Pakistani participants, respectively(Reference Gronborg, Tetens and Christensen28). The lower 25(OH)D increment in the Pakistani cohort was due to poor compliance, highlighting that low-dose fortification is effective but also the importance of targeting appropriate foods for different population cohorts(Reference Gronborg, Tetens and Christensen28). RCT examining compliance and efficacy of foods such as snack bars and eggs are essential to account for non-consumers of milk and bread, and consumers of ethnic diets. Dietary patterns should also be examined in minority groups and highly consumed foods should be targeted for food fortification to ensure maximal effectiveness in these minority ethnic groups.
Future directions of vitamin D food fortification
Vitamin D fortification policies are urgently needed worldwide, as vitamin D intakes and status remain low in many countries, particularly in those at northern latitudes(Reference Laird, O'Halloran and Carey7,21) . Countries without a vitamin D fortification policy can model national survey data to determine the most effective and safe fortification policy, when implemented alongside supplementation and natural vitamin D sources. Once target foods have been identified using data modelling, maximal vitamin D absorption from these foods should be ensured before a fortification policy is implemented. Maximal vitamin D absorption from fortified foods may be achieved by altering food structure or composition, but more human absorption studies are needed to confirm hypotheses derived from in vitro data before implementation as part of a fortification policy. These modelling and absorption studies should then be translated into RCT which can determine food fortification safety and efficacy, and account for variations in vitamin D food content and eating patterns across countries, as well as inter-individual response to vitamin D treatments(Reference Kiely and Cashman64). The resulting vitamin D fortification policy should result in a high proportion of the population meeting intake recommendations, with little or no individuals exceeding the 100 μg tolerable upper limit. These policies are most effective if they account for variations in staple foods, ethnic diets and non-consumers of certain food groups, such as vegetarians and vegans. Lastly, multiple foods should be fortified at a low dose, as this increases population vitamin D intakes and status most effectively(Reference Jaaskelainen, Itkonen and Lundqvist11).
Food fortification policies are most effective if monitored and re-evaluated after implementation. Therefore, national survey data should be analysed after policy implementation to determine how fortification is affecting intakes. Fortification strategies can be remodelled if intakes or status remain low, and policy can be revised accordingly. However, this is only possible with a rolling national survey programme, such as the National Diet and Nutrition Survey within the UK(21). Vitamin D fortification policies should also be supported financially by the government, so the financial burden does not fall on consumers, as social class and wealth are predictors of vitamin D status(Reference Lin, Smeeth and Langan65). Vitamin D food fortification reduces skeletal and non-skeletal diseases incidence, and the healthcare savings outweigh government costs associated with vitamin D food fortification(Reference Pilz, Marz and Cashman2). Lastly, vitamin D policies should be supported by nationwide education campaigns to increase public awareness of the effects of low vitamin D status, vitamin D supplementation and vitamin D sources. These education programmes should focus on vitamin D functions and sources, recommended daily intakes and tolerable upper limit, and emphasise the importance of routine 25(OH)D testing by primary care teams.
To conclude, mandatory vitamin D fortification policies are urgently needed worldwide. Data modelling of nationally representative data can be used to inform and design country-specific effective vitamin D fortification policies. These data modelling studies should be supported by RCT that ensure safety and efficacy of these policies at a national level. Additionally, manipulating the composition of fortified foods may increase fortification policy effectiveness by increased vitamin D bioavailability from these foods. However, this area of research is still in the early stages, and more human studies are needed before novel food composition manipulation is incorporated into national policy. Lastly, fortification policies are most beneficial if supported by nationwide vitamin D education campaigns and if they are routinely monitored to ensure ongoing effectiveness.
Acknowledgements
The authors would like to thank the Irish section of the Nutrition Society for inviting the present review paper as part of the postgraduate review competition.
Financial Support
This work was supported by the Department of Agriculture, Food and the Marine, Ireland [15/F/737 – Nutriplus].
Conflict of Interest
None.
Authorship
A. F. M completed the review, advised and critically evaluated by A. M. O. Both authors read and approved the final manuscript.


 Open access