


Introduction
The role of diet and nutrition in health and well-being cannot be overstated. In recent years, research has shown that suboptimal diet and nutrition are major contributors to the global burden of non-communicable diseases(Reference Qiao, Lin and Wu1), resulting in 7·9 million deaths globally, and 187·7 million death and disability-adjusted life years in 2019(Reference Qiao, Lin and Wu1). Marked changes to how diet is conceptualised have occurred over the years with early research focused on the relationship between individual nutrients and health outcomes(Reference Shao, Drewnowski and Willcox2). The recognition that nutrients do not function in isolation has led to research around whole dietary patterns, attempting to understand the complex interaction food components have on health outcomes. However, the methods used to characterise dietary patterns are inconsistent, adding to the challenge of generalising conclusions from individual studies and making meaningful between-study comparisons or translating findings into guidelines(Reference Wingrove, Lawrence and McNaughton3).
Dietary patterns are described and quantified through various dietary assessment tools, which can be classified as ‘a priori’ and ‘a posteriori’ methods. Tools such as food frequency questionnaires (FFQs), 24-h diet recalls and food diaries are used to gather dietary data which are then analysed using ‘a priori’ methods. FFQ and 24-h diet recalls are more commonly used in epidemiological studies due to their reduced labour intensity compared with real-time recording methods such as food diaries(Reference Shim, Oh and Kim4,Reference Naska, Lagiou and Lagiou5) . Although all self-report methods have limitations, they are cost-efficient ways to gain insight into dietary habits. FFQ require individuals to report the frequency of food consumption and portion size, but provide little information about preparation methods or food combinations(Reference Thompson and Subar6). 24-h diet recalls, which can be self-reported or conducted through interviews and telephone calls, provide more detailed information by asking individuals to report all food and beverage consumption within the past 24 h(Reference Buzzard, Faucett and Jeffery7). In the current study, dietary patterns were determined using an ‘a priori’ approach.
The computation of dietary pattern scores from ‘a priori’ dietary assessment methods involves several subjective decisions, such as choosing assessment tools, dietary pattern scoring methods, food items or codes and determining the grams equivalent to a serving. Recent reviews by Wingrove et al. (2022) and Hutchins-Wiese et al. (2021) conclude that these decisions lead to considerable variability across the literature in the methods used, potentially affecting the strengths of associations. For example, the choice of assessment tool can cause differences in both the types and the number of food items included in a dietary pattern(Reference Hutchins-Wiese, Bales and Starr8). Furthermore, the degree of detail provided when describing these methods and dietary patterns is highly inconsistent, with most studies failing to describe the scored dietary patterns altogether(Reference Wingrove, Lawrence and McNaughton3). Additionally, various studies use distinct scoring methods, as noted by Zaragoza-Martí et al. (2018), who reported that there are over twenty-eight unique scoring methods available for the Mediterranean diet (MeDi) score(Reference Zaragoza-Martí, Cabañero-Martínez and Hurtado-Sánchez9). These variations in the scoring process currently hinder the synthesis of evidence into dietary guidelines or interventions(Reference Liese, Krebs-Smith and Subar10) and may contribute to the mixed and null effect sizes found in systematic reviews(Reference Arnoldy, Gauci and Young11–Reference Gauci, Young and Arnoldy13). These findings highlight the need for standardisation and consensus on scoring systems and methodologies to capture dietary patterns. This will allow direct comparisons between studies and facilitate the translation of findings into dietary guidelines(Reference Tapsell, Neale and Satija14).
Efforts have been made to standardise dietary pattern scores, such as the MeDi(Reference Martínez-González, García-Arellano and Toledo15), the Alternative Healthy Eating Index 2010(Reference McCullough, Feskanich and Stampfer16), Dietary Approaches to Stop Hypertension (DASH)(Reference Folsom, Parker and Harnack17) and the Mediterranean-DASH Intervention for Neurodegenerative Delay (MIND) diet(Reference Morris, Tangney and Wang18). However, to our knowledge, no attempts have been made to standardise the entire process for scoring the MeDi, DASH or MIND, from dietary assessment tools to dietary patterns score. Many scientific disciplines are adopting practices to increase reproducibility, such as standardised methods and reporting guidelines(Reference Munafò, Nosek and Bishop19). A prominent example includes the Consolidated Standards of Reporting Trials statement, which has been universally adopted for randomised controlled trials(Reference Begg, Cho and Eastwood20) with momentum gathering for the development of bespoke Consolidated Standards of Reporting Trials-Nutr guidance(Reference Rigutto-Farebrother, Ahles and Cade21). Similarly, the field of neuroimaging has worked towards reporting guidelines for measurement, data processing and statistical analysis elements that differ between studies and threaten reproducibility, via the Organisation for Human Brain Mapping established by the Committee on Best Practices in Data Analysis and Sharing(Reference Nichols, Das and Eickhoff22). In 2016, reporting guidelines on Strengthening the Reporting of Observational Studies in Epidemiology—Nutritional Epidemiology was published, providing a framework for reporting methods and results of associations with health outcomes(Reference Lachat, Hawwash and Ocké23). Although there are no reporting recommendations specifically focussing on the MeDi, DASH and MIND scores, a related checklist published by Kirkpatrick et al. (2018) documents a reporting checklist for the Health Eating Index(Reference Kirkpatrick, Reedy and Krebs-Smith24), which can be used alongside the Strengthening the Reporting of Observational Studies in Epidemiology—Nutritional Epidemiology(Reference Lachat, Hawwash and Ocké23).
To alleviate some of the bias and to contribute to efforts to further standardise this field, this study aimed to achieve two goals. First, it aimed to document a workflow that scores the MeDi, DASH and MIND dietary patterns from the outputs of three commonly used dietary assessment tools: one 24-h recall tool and two variations of an FFQ. This effort aims to further enhance reproducibility and enable better comparison across studies, ultimately enhancing our understanding of the association between dietary patterns and health outcomes. Second, it aimed to recommend a ‘best practice’ reporting checklist that highlights the essential elements identified in the dietary scoring workflow which require a description in a research paper to facilitate reproducibility and comparability of research studies, which builds on the checklist by Kirkpatrick et al. (2018). These recommendations may be of value to researchers, editors and reviewers, aiming to optimise the scoring practice and reporting in the field of nutritional research.
Methods and materials
In order to achieve the stated objectives, secondary data representing common methods for assessing diet intake in research were identified. This led to the inclusion of baseline (pre-intervention cross-sectional data) assessments of three randomised controlled trials of nutritional interventions in middle-aged to older adults which were collected at Swinburne University, Melbourne, Australia. These trials incorporated different dietary assessment tools and were conducted in various countries with diverse populations. Scores for the MeDi, DASH and MIND dietary patterns were created through a systematic scoring process. Each stage of the process was thoroughly documented, with a specific focus on points where subjective decisions were made and potential variability could arise. Furthermore, the dietary pattern scores were evaluated against a set of variables known to be associated with the respective dietary patterns, aiming to validate their effectiveness.
Data source
The three clinical trials included comprised the Memory and Attention Supplement Trial (MAST) NCT03482063(Reference Young, Gauci and Arnoldy25), the Phospholipid Intervention for Cognitive Ageing Reversal (PLICAR) trial ACTRN12613000347763(Reference Scholey, Camfield and Hughes26) and the Cognitive Ageing Nutrition and Neurogenesis (CANN) trial NCT02525198(Reference Irvine, Scholey and King27,Reference Vauzour, Scholey and White28) . The MAST trial evaluated the impact of a 12-week intervention of vitamin B and herbal supplementation on cognition and mood in healthy middle-aged adults, while the PLICAR trial explored the neurocognitive effects of a 6-month supplementation with a phospholipid-rich milk protein (Lacprodan® PL-20, Arla Foods Ingredients, Denmark). The CANN trial was a dual-centre trial assessing the effect of a 12-month flavonoid/fatty acid supplementation on cognitive performance in individuals aged 55 years and over with mild cognitive impairment or subjective memory impairment. This study was conducted according to the guidelines laid down in the Declaration of Helsinki, and all procedures involving human patients were approved by the Swinburne University Human Research Ethics Committee (MAST: Project number 2017–269, PLICAR: project number 2012–294, CANN: Project number 2015-208) and the Bellberry Human Research Ethics Committee (CANN: Study ID 2015-03-227). In addition, ethical clearance from the Swinburne University Human Research Ethics Committee was received to utilise data from all three clinical trials for the present analysis (Project number 20202924–4284). Written informed consent was obtained from all participants.
Participants
Eligibility criteria differed across the trials, ranging from healthy individuals free from any cognitive condition (MAST) or age-associated memory impairment (PLICAR), subjective memory impairment or mild cognitive impairment (CANN). Table 1 summarises in detail the inclusion and exclusion criteria of each study.
Table 1. A summary of the inclusion and exclusion criteria for each study: MAST, PLICAR and CANN

MAST, Memory and Attention Supplement Trial; PLICAR, Phospholipid Intervention for Cognitive Ageing Reversal; CANN, Cognitive Ageing Nutrition and Neurogenesis; UK, UK; ASA24, Administered 24-Hour Dietary Assessment Tool(Reference Subar, Kirkpatrick and Mittl29); CCV, Cancer Council Victoria(Reference Giles and Ireland33); EPIC, European Prospective Investigation into Cancer and Nutrition(Reference Kroke, Klipstein-Grobusch and Voss35).
Diet
Dietary assessments
Each of the three clinical trials used a different dietary assessment tool to estimate participants’ dietary food habits and nutrient intake, as presented in Table 1 and outlined in the following sections.
Administered 24-H Dietary Assessment Tool
The MAST trial utilised the Administered 24-H Dietary Assessment Tool (ASA24) tool that collects information on the dietary intake of participants over 24 h(Reference Subar, Kirkpatrick and Mittl29). The ASA24 is a web-based dietary assessment tool developed by the National Cancer Institute that has been validated and compared with other established dietary assessment methods(Reference Kipnis, Subar and Midthune30,Reference Moshfegh, Rhodes and Baer31) . Participants were required to report all the foods, drinks and supplements consumed in the specified timeframe and answer questions regarding preparation, food form, portion size and meal additions(Reference Subar, Kirkpatrick and Mittl29). A total of four diet recalls were completed by participants during the trial, with the first completed during an on-site testing session under researcher supervision. Participants completed the second dietary assessment before their baseline session, with one completed during the week and one during the weekend. Two additional recalls were completed in the week leading up to the endpoint testing session. Information collected from a minimum of two and a maximum of four recalls was used to calculate adherence to the MeDi, DASH and MIND dietary pattern, thereby providing a more representative capture of participants’ habitual diets(Reference Ma, Olendzki and Pagoto32).
The ASA24 assessment tool incorporates the Australian Food, Supplement, and Nutrient Database (AUSNUT 2011–2013) as well as the 2011–2013 Australian Health Survey (AHS) as its guiding reference. The raw data generated from ASA24 comprises food consumption in grams, and each food is coded using the AUSNUT 2011–2013 food-nutrient database.
AUSNUT 2011–2013 covers a wide range of food and drink components, comprising a total of 5740 items. This food-nutrient database comprises eleven files of which three were used for data analysis: the food recipe file which was used to disaggregate mixed dishes; the food and dietary supplement classification system file and the food details file. The classification system file uses codes for major (two-digit), sub-major (three-digit), minor (five-digit) and survey ID (eight-digit) category codes to classify components of the different categories of dietary patterns. To give an example, the two-digit codes classified whole food groups, the three-digit codes classified specific components of a food group, five-digit codes were used to classify green leafy vegetables in the vegetable component, while eight-digit codes were needed to disaggregate mixed dishes and to classify more detailed codes such as separating whole grains from total grain intake. The classification system file and the food details files were used to classify AUSNUT 2011–2013 food codes based on their alignment with the foods in the MeDi, DASH and MIND dietary patterns. To accomplish this, we extracted all the codes and incorporated them into their corresponding components, as outlined in Tables 2, 3, 4.
Table 2. Includes the food items extracted from the ASA24 (which also includes the AUSNUT codes), CCV FFQ and EPIC FFQ for the MeDi dietary pattern
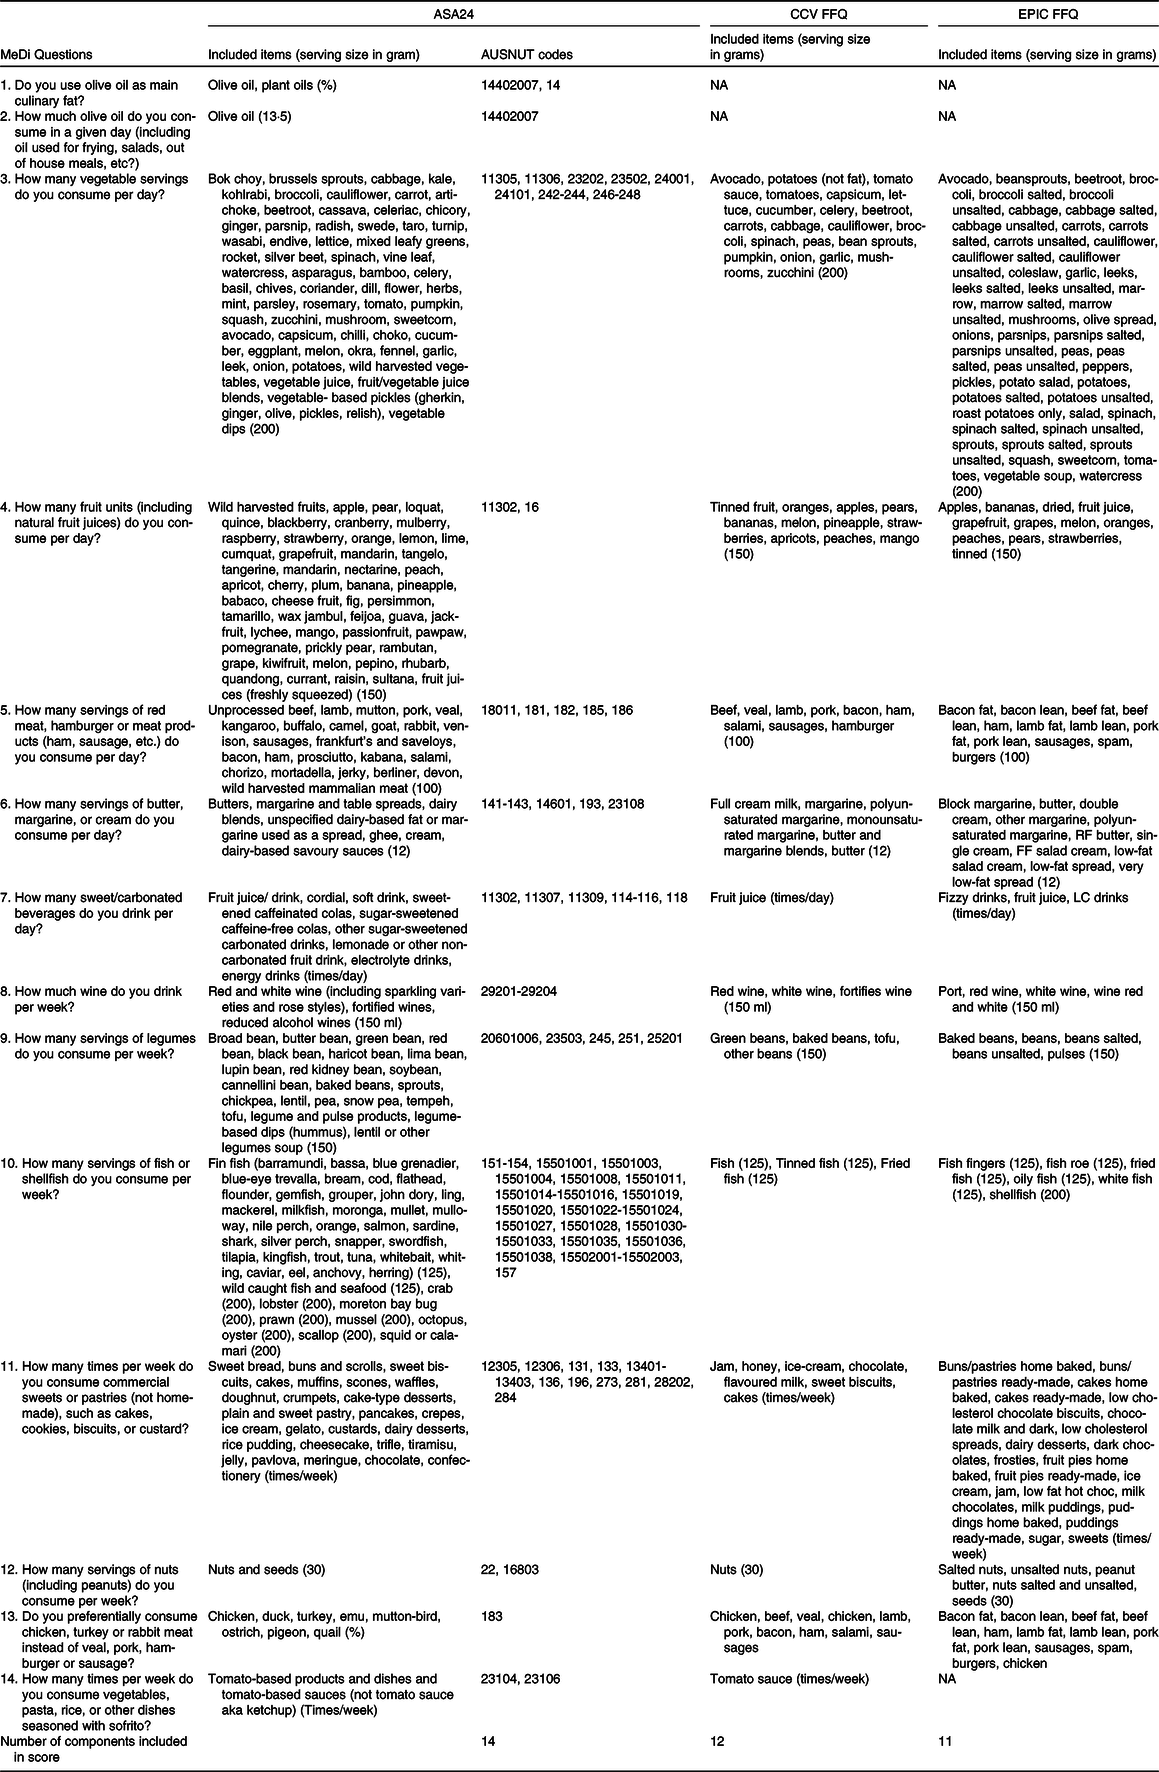
ASA24, Automated Self-Administered 24-Hour Dietary Assessment Tool; CCV, Cancer Council; EPIC, European Prospective Investigation into Cancer and Nutrition; Medi, Mediterranean diet.
This table presents the included items from the ASA24, CCV FFQ and EPIC FFQ in the MeDi and presents the grams equivalent to a serving size of each item utilised for scoring the MeDi, indicated in brackets.
Table 3. Includes the food items extracted from the ASA24 (which also includes the AUSNUT codes), CCV FFQ and EPIC FFQ for the DASH dietary pattern
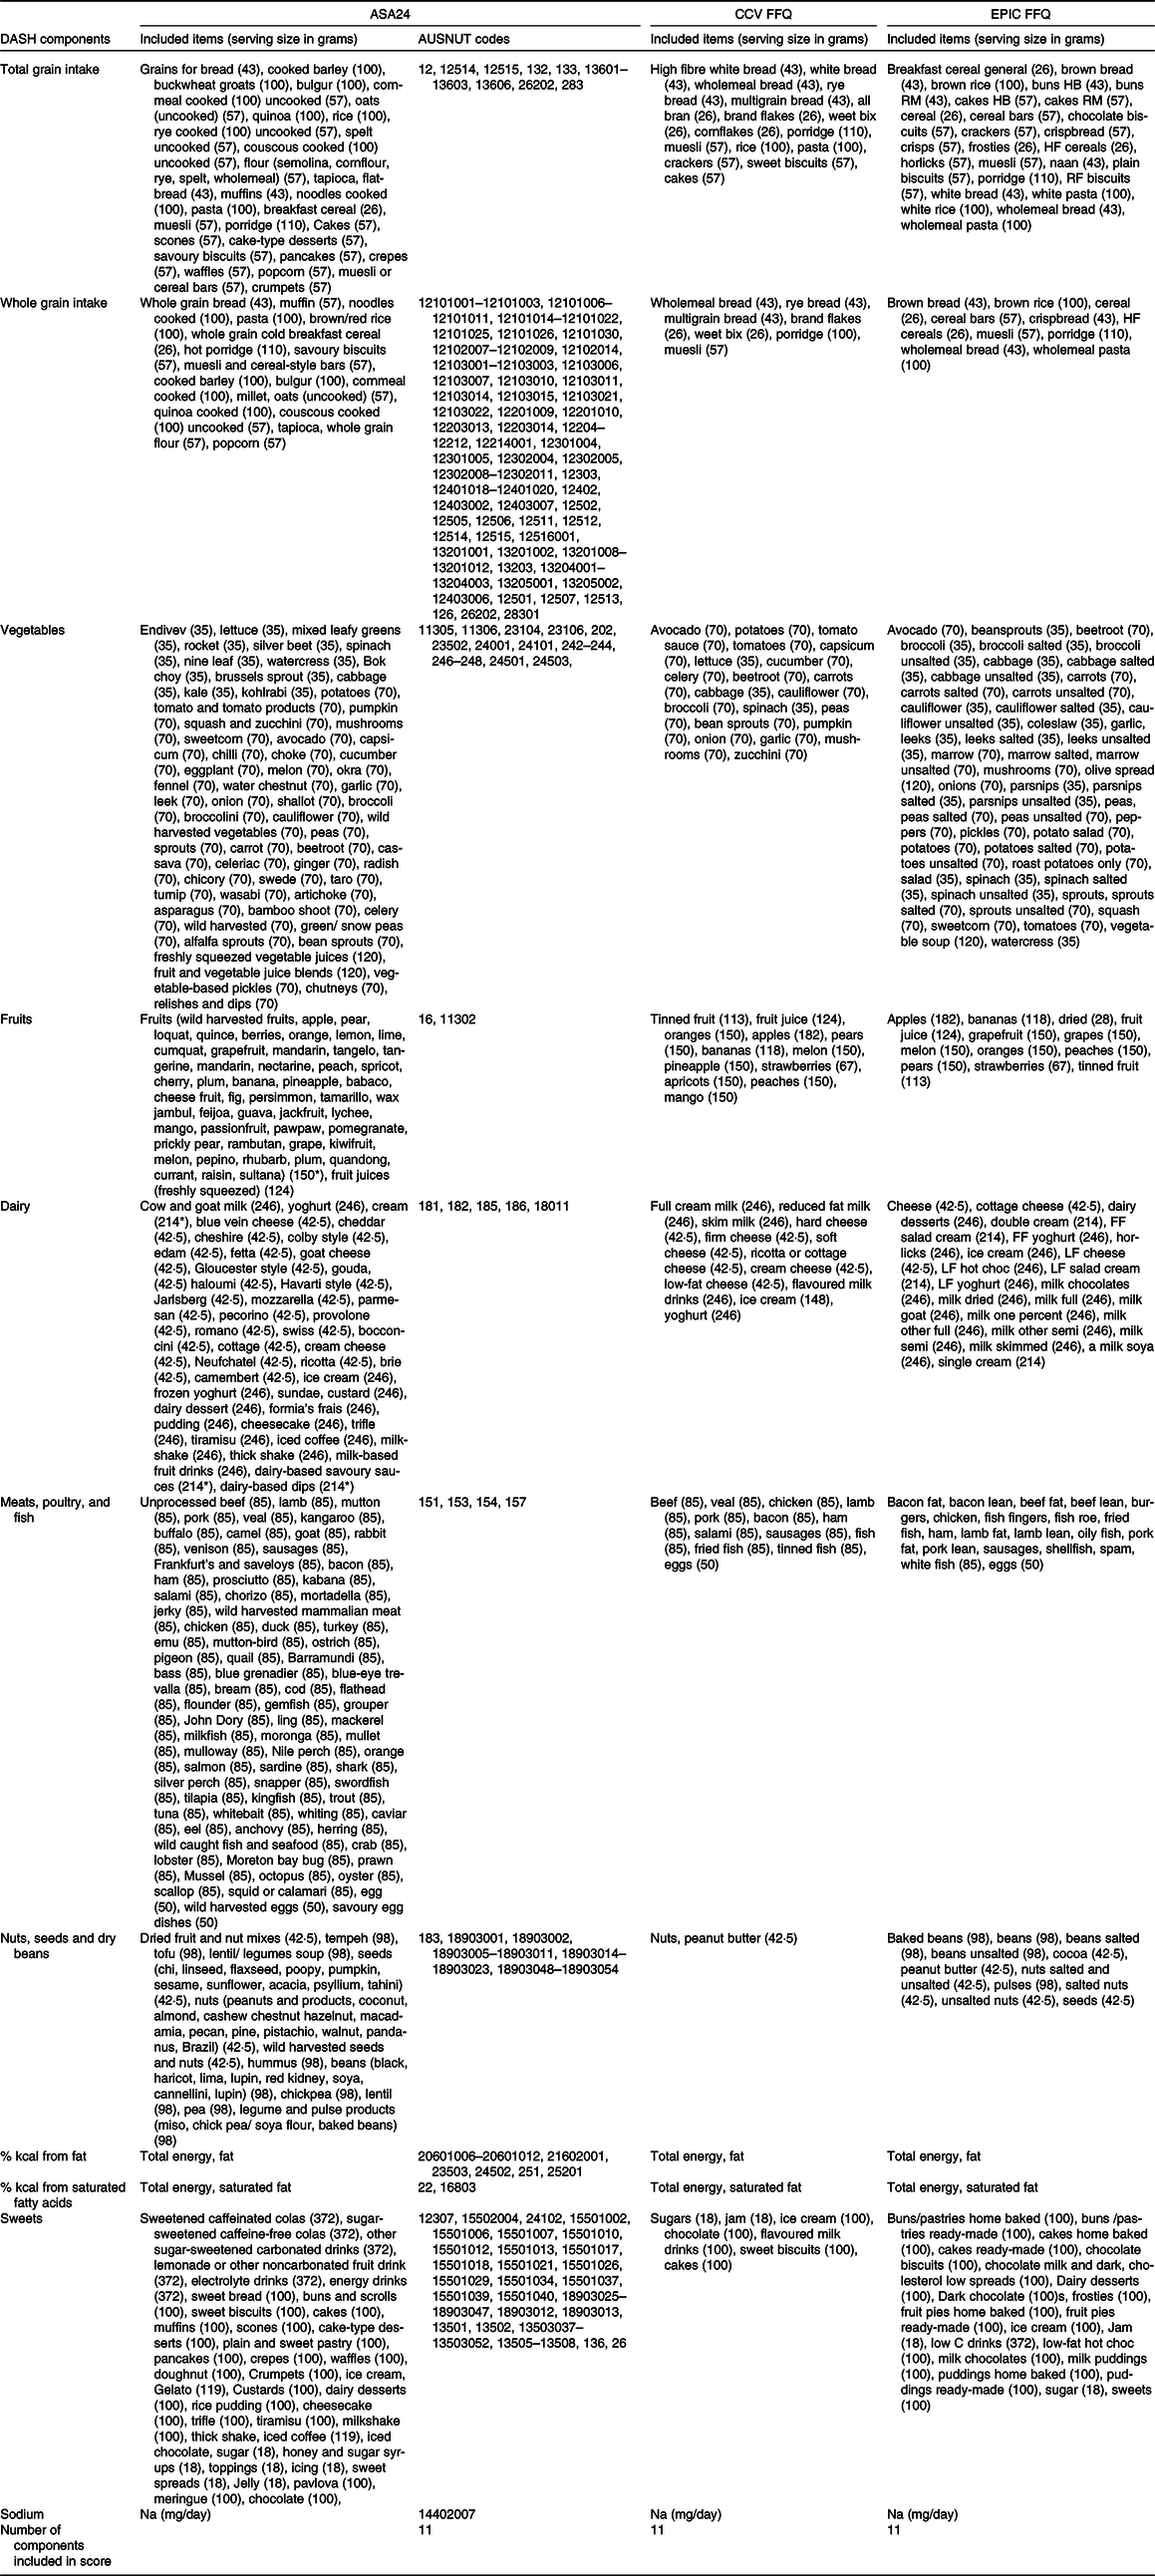
ASA24, Automated Self-Administered 24-Hour Dietary Assessment Tool; CCV, Cancer Council; DASH, Dietary Approaches to Stop Hypertension; EPIC, European Prospective Investigation into Cancer and Nutrition.
This table presents the included items from the ASA24, CCV FFQ and EPIC FFQ in the DASH diet and presents the grams equivalent to a serving size of each item utilised for scoring the DASH, indicated in brackets.
* Average.
Table 4. Includes the food items extracted from the ASA24 (which also includes the AUSNUT codes), CCV FFQ and EPIC FFQ for the MIND
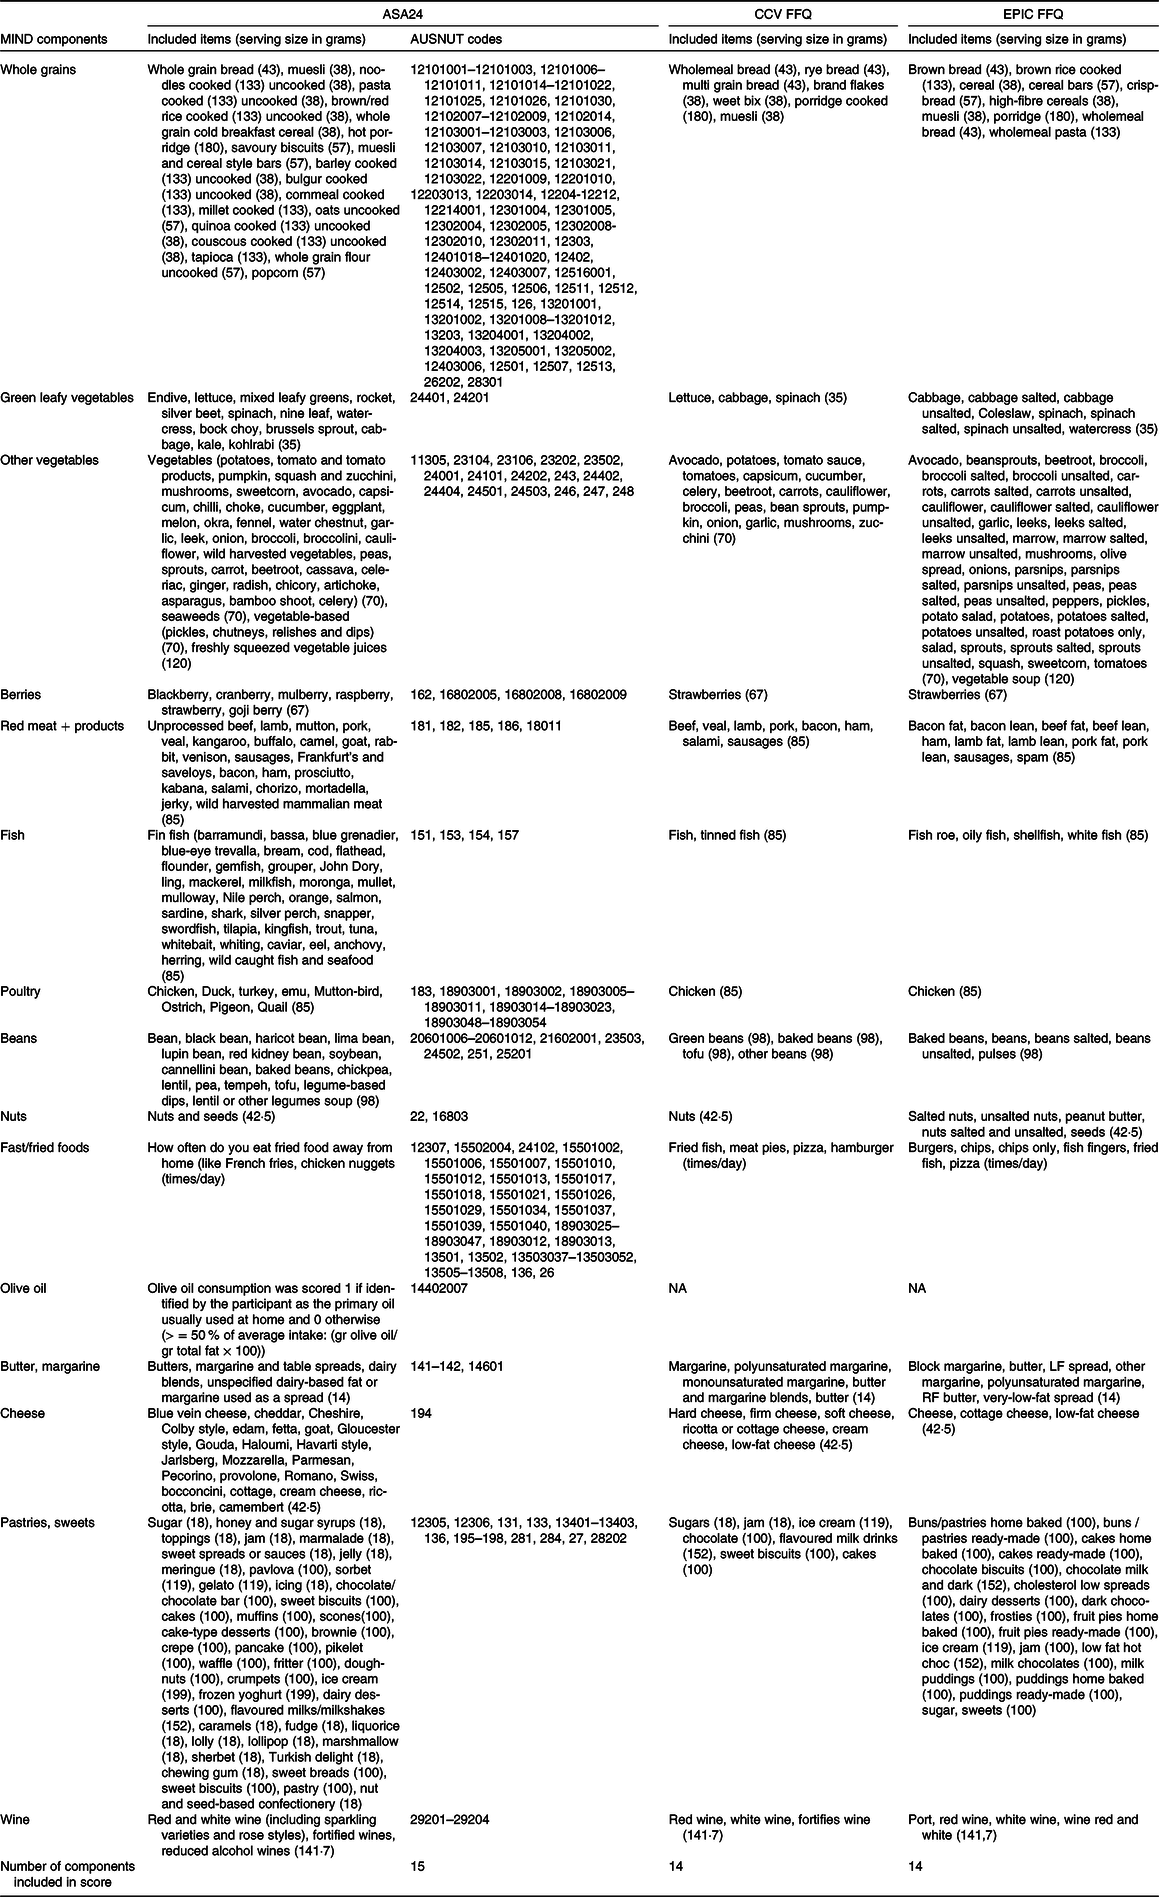
ASA24, Automated Self-Administered 24-Hour Dietary Assessment Tool; CCV, Cancer Council; EPIC, European Prospective Investigation into Cancer and Nutrition; MIND, Mediterranean-DASH Intervention for Neurodegenerative Delay.
This table presents the included items from the ASA24, CCV FFQ and EPIC FFQ in the MIND and presents the grams equivalent to a serving size of each item utilised for scoring the MIND, indicated in brackets.
To disaggregate reported dishes into their separate ingredients, the AUSNUT 2011–2013 recipe file was used as it includes information on the percentage of each ingredient included in each dish and the total weight. After which, the weights of each ingredient were calculated. For dishes not included in the AUSNUT 2011–2013 recipe file, efforts were made to find similar dishes. If no match was found, the dish was excluded from the analysis. Next, the ingredients that are part of the MeDi, DASH and MIND dietary patterns were extracted from the disaggregated data. The participants reported a total of 283 dishes, which were disaggregated for analysis. Details on these dishes are listed in online Supplementary Material A Table S1.
Cancer Council Victoria FFQ
The PLICAR trial used the Cancer Council Victoria (CCV) FFQ to collect data on participants’ habitual diet(Reference Giles and Ireland33). This FFQ is a well-established and validated tool for evaluating an individual’s typical diet with its validity demonstrated in the Australian population(Reference Bassett, English and Fahey34). Participants were asked to report on the frequency of consumption and portion sizes of seventy-four food items and six types of alcoholic beverages over the past 12 months(Reference Giles and Ireland33). The FFQ was self-administered and took approximately 20–30 min to complete. The participants completed the questionnaire during their first study visit.
The raw data, including frequency and portion sizes, were used to calculate daily intake in grams. Nutrient and energy intake were calculated by multiplying the frequency of consumption of each item by its nutrient content. Nutrient values were calculated using nutrient composition data sourced from the AUSNUT 2007. Additionally, the data on total energy intake in KJ, calculated grams per day, and frequency of consumption of the seventy-four items and six beverages were extracted for every participant.
European Prospective Investigation into Cancer and Nutrition FFQ
The European Prospective Investigation into Cancer and Nutrition (EPIC) FFQ(Reference Kroke, Klipstein-Grobusch and Voss35) was utilised in the CANN trial to gather information about participants’ dietary habits. The EPIC FFQ is a well-established and validated tool for evaluating an individual’s typical diet, which is valid in various European populations(Reference Kroke, Klipstein-Grobusch and Voss35). Each participant completed a self-administered questionnaire at their baseline visit, which took 30–60 min to complete. The FFQ captures data on the typical frequency of consumption (through a nine-point scale) of 146 items over the previous 12 months, along with information gathered on dietary supplements and cooking and consumption practices(Reference Kroke, Klipstein-Grobusch and Voss35). The specified servings are indicated using units, commonly consumed portions, or household measures.
The raw data, including frequency and portion sizes, were used to calculate daily intake in grams. Energy and nutrient intakes were calculated by multiplying the frequency of consumption of each item by its nutrient content. Furthermore, data on total energy intake in KJ, calculated grams per day, and frequency of the 146 items were extracted for every participant.
Dietary patterns
In Table 5, a comprehensive overview of the MeDi, DASH and MIND diet scores is provided, which were scored according to the methods proposed by Martinez-Gonzales et al. (2012), Folsom et al (2017) and Morris et al. (2015), respectively. The table provides relevant information on the specific questions or food components per category, the amount of grams equivalent to a serving and the thresholds per food component, which are dichotomous for the MeDi and trichotomous for both the DASH and MIND.
Table 5. Gives an overview of the MeDi, DASH and MIND diet scores
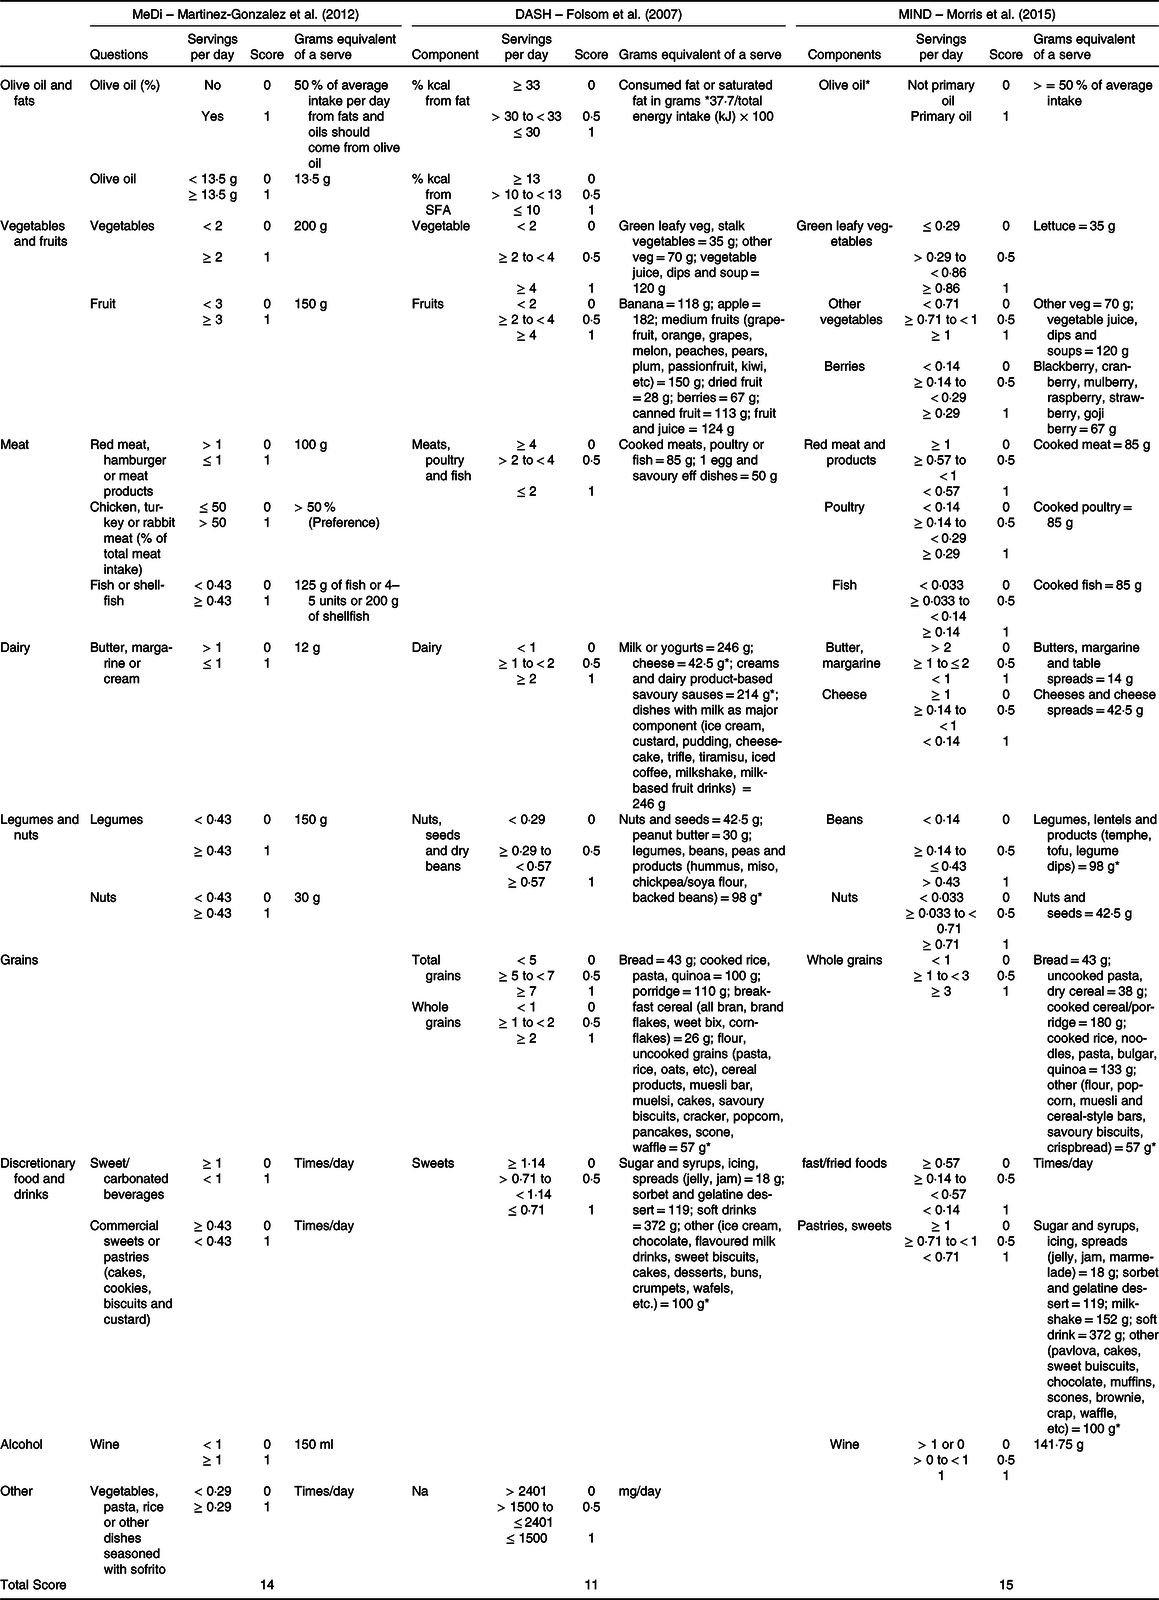
NA, not applicable; DASH, Dietary Approaches to Stop Hypertension; MeDi, Mediterranean diet; MIND, Mediterranean-DASH Intervention for Neurodegenerative Delay.
Table organisation: the table includes information on the specific questions or food components per category, the amount of grams equivalent to a serving, the cut-off points per food component which are dichotomous (MeDi) or trichotomous (DASH and MIND). Lastly, the highest total score is presented in the last row.
* Average.
Mediterranean diet dietary pattern
The MeDi is a traditional dietary pattern that is commonly consumed by individuals living around the Mediterranean Sea. It places a strong emphasis on the use of olive oil as the primary source of fat, as well as incorporating vegetables, fruits and legumes into daily meals. Fish and wine are consumed in moderation, while red meat and processed foods are kept to a minimum(Reference Hardman, Kennedy and Macpherson36). Adherence to this dietary pattern was evaluated using the fourteen-item Mediterranean Diet Adherence Screener (MEDAS) by Martinez-Gonzalez et al. (2012), which assigns scores of either 1 or 0 to 14 dietary components(Reference Schröder, Fitó and Estruch37). The current paper utilised the Mediterranean Diet Adherence Screener scoring instrument as it is a validated and brief measure with broad applicability across diverse demographic groups(Reference Schröder, Fitó and Estruch37). Its avoidance of population-specific median cut-offs increases its suitability for standardisation in diverse settings(Reference Hutchins-Wiese, Bales and Starr8). Four questions inquire about food habits and frequency of consumption, while the remaining ten inquire about the amount of consumption per day or week. For example, some questions ask about topics such as the use of olive oil as the main culinary fat, preference for chicken, turkey or rabbit over red meat, frequency of carbonated or sugar-sweetened beverage consumption and weekly servings of legumes, fish, shellfish and nuts(Reference Martínez-González, García-Arellano and Toledo15). To obtain a final score ranging from 0 to 14, the fourteen items are summed, with higher scores indicating better adherence to the MeDi, as noted by Martínez-González and colleagues (2012). However, due to the lack of information on olive oil in both FFQ, and the absence of data on Sofrito consumption in the EPIC FFQ, the maximum score for the CCV FFQ is 12, while the maximum score for the EPIC FFQ is 11 which are large methodological limitations for the computation of the MeDi score. The determination of olive oil as the primary culinary fat source from the ASA24 involved calculating the ratio of the amount of olive oil consumed to the total fat content, expressed as a percentage. The score for the MeDi is presented in Table 5, which has been slightly modified from the original score by Martinez-Gonzalez et al. (2012). The components of the score have been converted to servings per day. While the MEDAS questionnaire is usually employed directly, in this case, data collected from other dietary assessment tools such as the ASA24, CCV FFQ and EPIC FFQ were used to score adherence to the MeDi. The specific included items from the ASA24, CCV and EPIC FFQ, integral to scoring MeDi adherence, are outlined in Table 2.
Dietary Approaches to Stop Hypertension dietary pattern
The DASH dietary pattern is a recommended diet for reducing cardiovascular risk factors such as hypertension and low-density lipoprotein cholesterol, which are associated with dementia (Appel et al., 1997; Most-Windhauser, 2001). Current guidelines that aim to prevent cardiovascular risk factors emphasise lifestyle modifications and advocate for adherence to the DASH diet, which emphasises high consumption of fruits, vegetables, grains, nuts and low-fat dairy products while reducing the consumption of sweets, SFA, sugar-containing beverages and Na to lower high blood pressure(Reference Folsom, Parker and Harnack17). The constructed DASH index by Folsom et al. (2007) was used to assess adherence to the DASH low-NA diet(Reference Folsom, Parker and Harnack17). The DASH dietary pattern score includes eleven components, with final scores ranging from 0 to 11 obtained by summing these items. Higher scores reflect better adherence to the DASH diet. Table 5 presents the DASH score, while the specific included items from the ASA24, CCV or EPIC FFQ are outlined in Table 3. Table 5 has been modified from the original DASH index score by Folsom et al. (2007) to present the components in servings per day when possible. Most of the components assessed the servings consumed per day, such as total grain intake, whole grain intake, vegetable intake, fruits, dairy foods, meats/poultry and fish and intake of nuts, seeds, dry beans and sweets. One component assessed Na consumption based on the number of milligrams consumed per day, while two components evaluated the percentage of energy content consumed from fats and saturated fatty acids. The percentage of fat and saturated fats consumed was calculated by multiplying the number of grams consumed, by 37·7 to convert the values from grams to kilojoules and dividing it by the total energy consumed. Serving sizes, which were not mentioned in the paper by Folsom et al. (2007), were extracted from the USA Department of Agriculture National Nutrient Database for Standard Reference dietary guidelines (2015–2020), as the original DASH dietary pattern was scored in USA serving sizes. The serving size for alcohol was extracted from the National Indigenous Australians Agency website(38).
Mediterranean-DASH Intervention for Neurodegenerative Delay dietary pattern
The MIND diet has been created by investigators at Rush University and is styled after the MeDi and DASH diet. The MIND diet differentiates from the MeDi, and DASH diet in the number of servings of fish and dairy product and emphasises the intake of green leafy vegetables and berries. These modifications were made to align with evidence that showed neuroprotective effects(Reference Barnes, Tian and Edens39). For example, the servings of fish are much lower in the MIND diet compared with the MeDi and DASH diet, as there is evidence that one meal per week is sufficient to lower the risk of dementia.(Reference Larrieu, Letenneur and Helmer40–Reference Schaefer, Bongard and Beiser42). The MIND consists of fifteen components, with a key focus on promoting the intake of ten food components. These include green leafy vegetables, other vegetables, berries, fish, poultry, beans, nuts, olive oil and wine. Simultaneously, the diet emphasises a reduction in the consumption of five unhealthy food components, namely red meats, fast and fried food, butter and margarine, cheese, as well as pastries and sweets(Reference Morris, Tangney and Wang18). A combination of the constructed MIND scores by Morris et al. (2015) and Meuller et al. (2020) was used to assess adherence to the MIND(Reference Mueller, Norton and Koscik43). Table 5 presents the MIND score, while the specific included items from the ASA24, CCV FFQ or EPIC FFQ are outlined in Table 4. To obtain a final score ranging from 0 to 15, the fifteen items are summed, with higher scores indicating better adherence to the MIND. However, due to the lack of information on olive oil in both FFQ, the maximum score for the CCV FFQ and EPIC FFQ got reduced to 14. The presented MIND score in Table 5 has been slightly modified from the original MIND score by Morris et al. (2015), as the components are presented in servings per day when possible. If the serving sizes of an item included in the MIND was not specified in the paper by Morris et al. (2015) or Meuller et al. (2020), they were extracted from the USA Department of Agriculture National Nutrient Database for Standard Reference dietary guidelines (2015–2020). These guidelines were used because the original MIND dietary patterns were scored in USA serving sizes. The serving size for alcohol was extracted from the National Indigenous Australians Agency website(38). One serving of alcohol was calculated by dividing the amount in grams consumed by 141·748 g (5 ounces). To calculate the consumed frequency of fried food, the amount consumed each month was divided by 30·417 days. Last, olive oil used as primary oil has been calculated by dividing the amount of olive oil consumed by the total amount of fat times 100 %.
Scoring process
To compute the MeDi, DASH and MIND score using the various assessment tools, we followed seven steps outlined in Fig. 1: (1) relevant items from the ASA24, CCV FFQ and EPIC FFQ were selected, ensuring the availability and inclusion of all key food components (included items for each assessment tool are presented in Table 2–4), (2) the daily grams consumed for the selected items extracted, (3) the daily serving size was determined, guided by Martinez-Gonzalez et al. (2012), Folsom et al. (2007) and Morris et al. (2015) (presented in Table 2–4 and 5), (4) the consumed servings per day were calculated for each item, (5) all items per component were weighted and summed to calculate a single value per food component and (6) the recommended daily servings which were assigned to a component score provided by Martinez-Gonzalez et al. (2012), Folsom et al. (2007) and Morris et al. (2015) were used to assign a full (1) or no (0) point for each component in the MeDi or a full (1), a half (0·5) or no (0) points for each component in the DASH and MIND pattern. Lastly, (7) the scores for each food component were summed to compute the total MeDi, DASH and MIND score for each participant. The scoring process for the individual diet scores can be found in online Supplementary Material B.
Analysis approach
After calculating the total scores for dietary patterns, one can evaluate adherence through the analysis of continuous variables or by forming groups based on data-driven or literature-based methods. In our current methodology, the cut-off points for tertiles are determined through a data-driven approach, with each tertile encompassing roughly 33·3 % of the participants, alongside a literature-based approach which uses the cut-off point provided by the original articles(Reference Martínez-González, García-Arellano and Toledo15,Reference Folsom, Parker and Harnack17,Reference Morris, Tangney and Wang18) . The tertiles and quintiles derived from both data-driven and literature-based methods are detailed in Table 6.
Table 6. Dietary pattern cut-off points in each clinical trial – literature-based and data-driven approach

n, number of participants; Q, quintile; T, tertiles.
Ranges and participant distribution are provided for each adherence group within the respective clinical trials. Literature-based cut-offs are based on the dietary patterns as defined in the specified literature sources (MeDi by Martinez-Gonzalez et al. (2012), DASH by Folsom et al. (2007), MIND by Morris et al. (2015)). Data-driven cut-off values for tertiles are determined through data-driven analysis.
Results
The method section outlines the dietary pattern scoring workflow, visually represented in Fig. 1(a). This process encompasses various steps, starting with the selection of an assessment tool and concluding with the determination of data-driven or literature-based cut-off points. Throughout this analysis process, it became evident that several steps need subjective choices from the researcher, highlighting the need for detailed reporting among future research articles. To promote comprehensive and accurate reporting among future researchers, a recommended reporting checklist (Fig. 1(b)) was crafted based on the outlined workflow in the method section. This checklist can also be valuable for reviewers evaluating research articles.
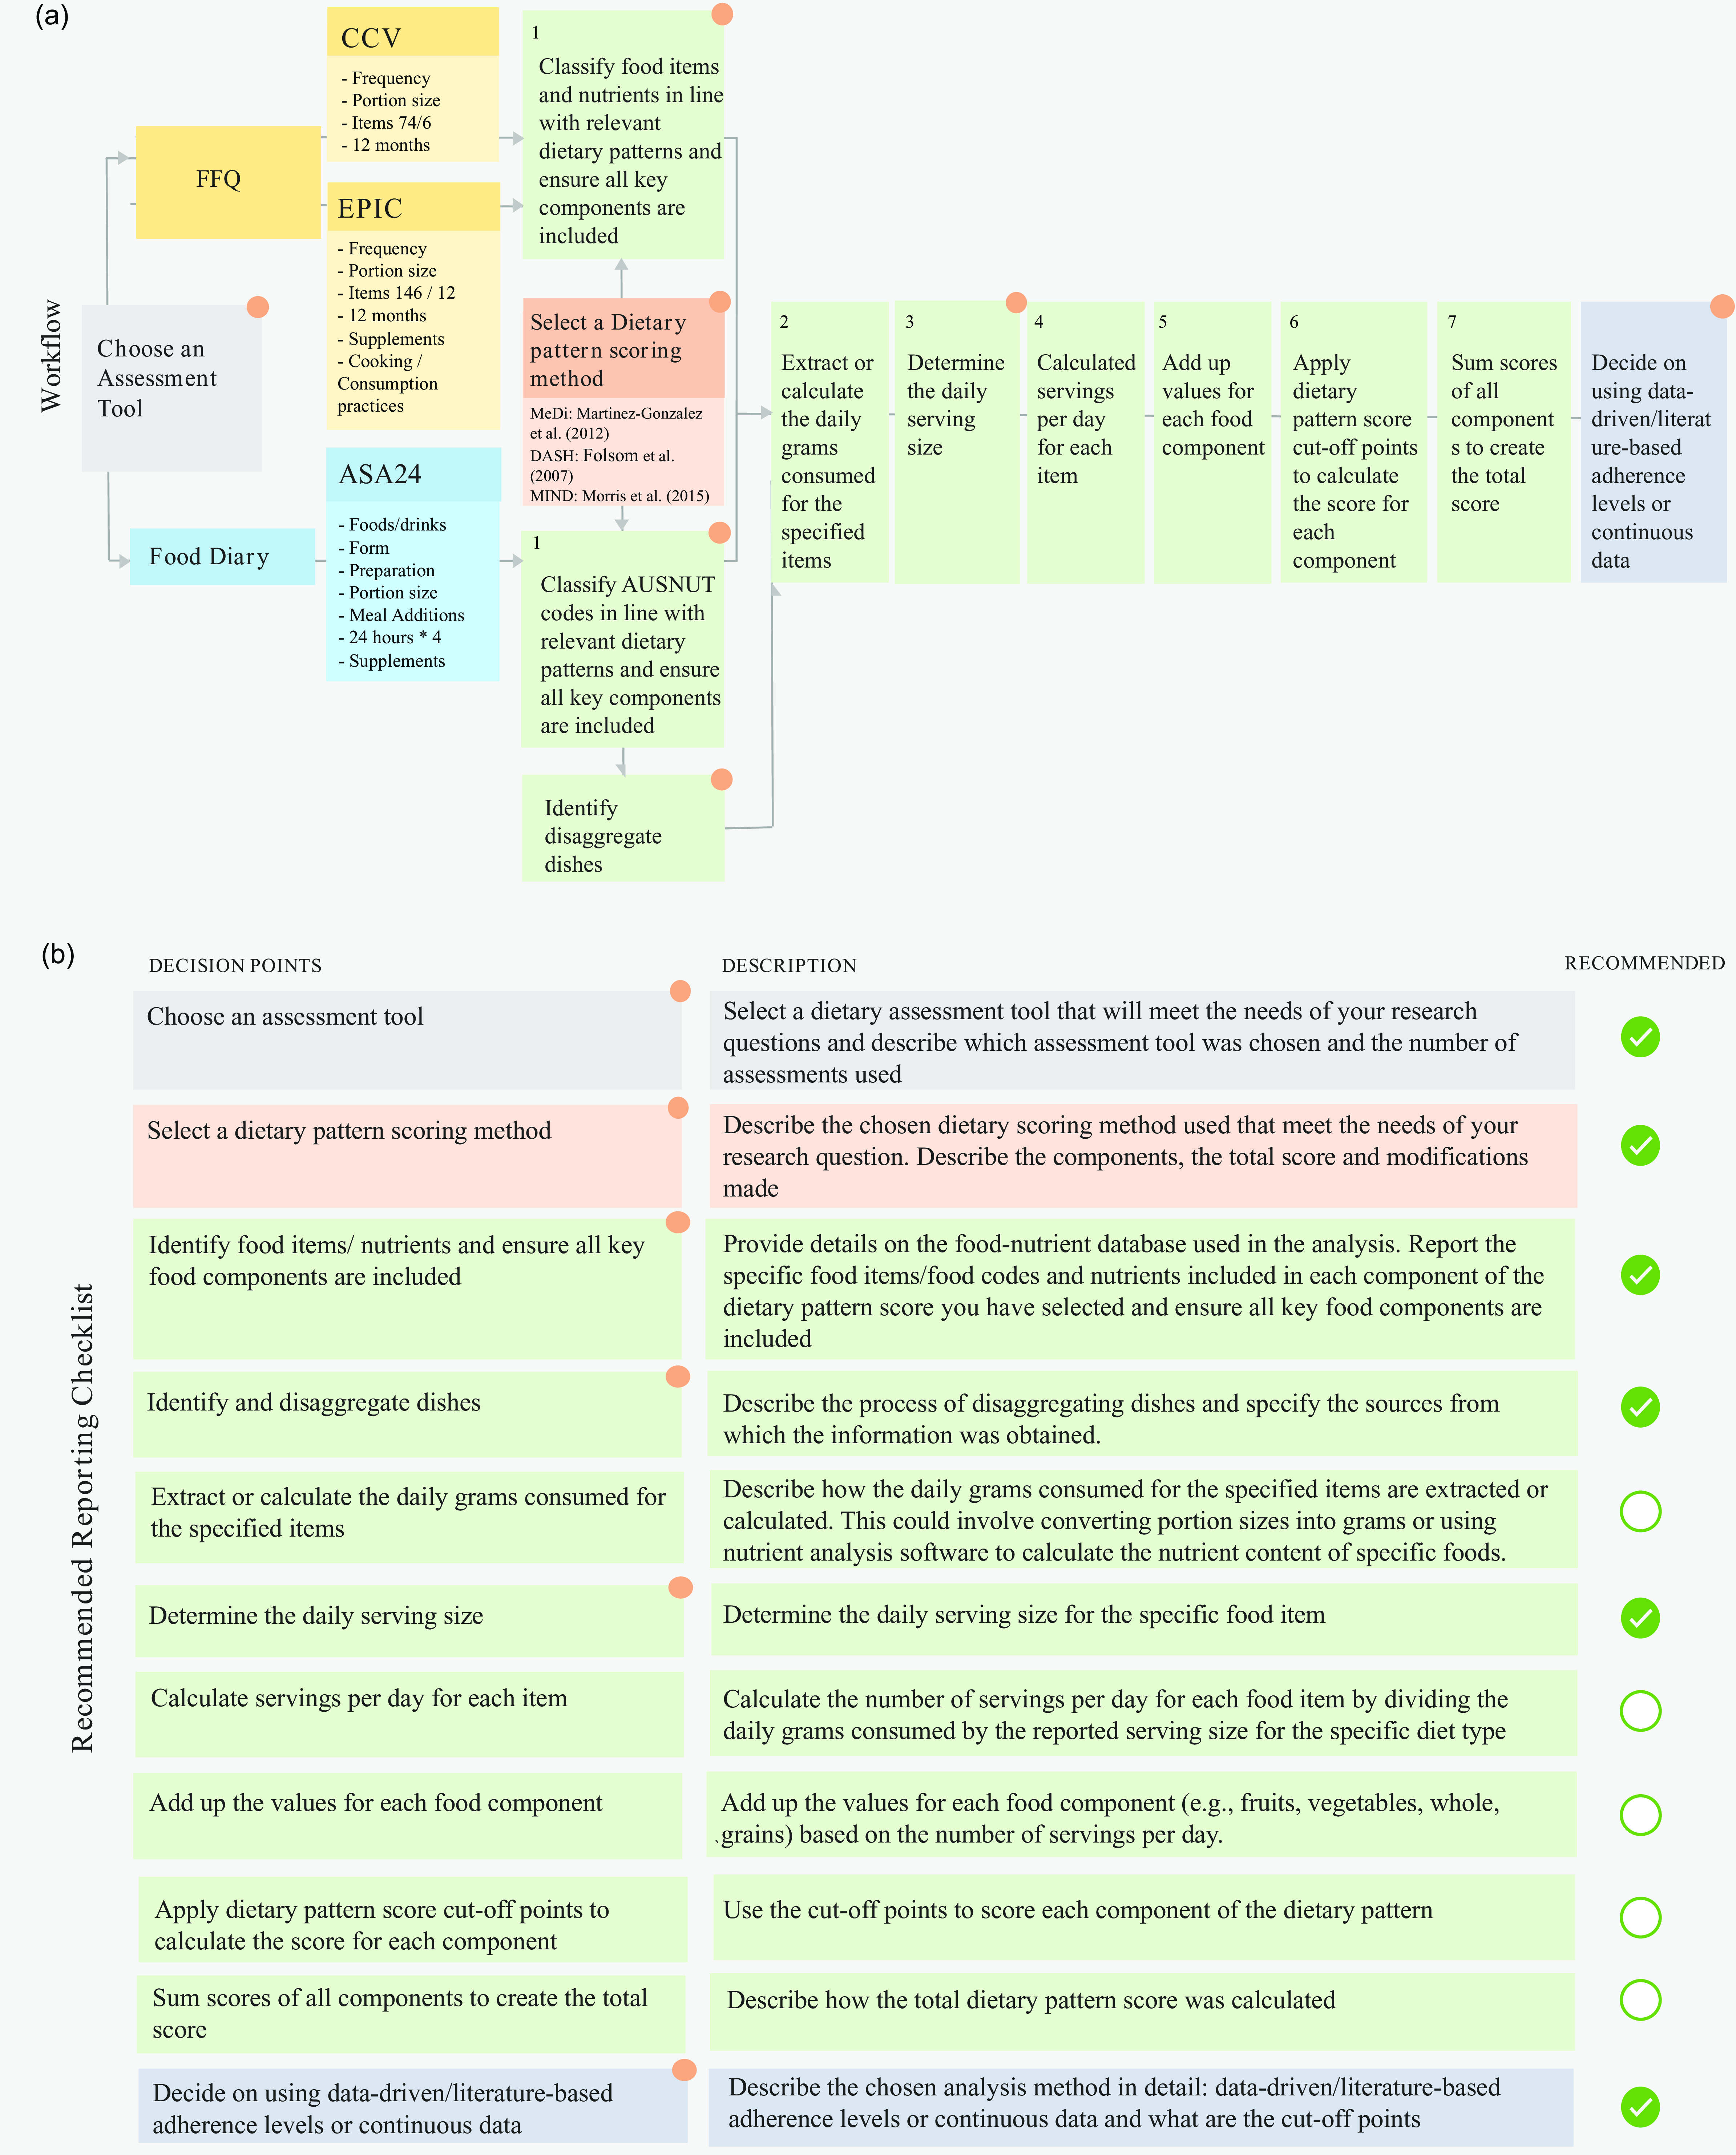
Fig. 1. (a) Dietary pattern scoring workflow described in this paper, from assessment tool selection to choosing the number of cut-off points for the analysis and the use of absolute or data-driven tertiles. The workflow starts with choosing an assessment tool and the dietary pattern scoring method, after which (1) Relevant items from the ASA24, CCV FFQ and EPIC FFQ were chosen, (2) daily grams consumed for selected items were extracted, (3) daily serving size in grams was determined using the chosen dietary pattern scoring method (if applicable), (4) daily servings consumed were calculated, (5) items per component were weighted and summed, (6) cut-off points were applied to score components and (7) component scores were summed to obtain each participant’s total diet score. Finally, decide between data-driven/literature-based adherence levels or continuous data and describe the corresponding cut-off points for the analysis. Key subjective choices are marked with a symbol: Choosing the assessment tool, dietary pattern scoring method, identifying food items, determining serving sizes and disaggregating dishes when exact matches are absent and choosing data analysis methods and cut-off points. (b) Presents the recommended reporting checklist, detailing crucial elements which require a description in future research articles.
The recommended reporting checklist specifically underscores points in the workflow where subjective choices by the researcher introduce individual differences between studies as illustrated in Fig. 1(b). This involves specifying details such as the assessment tool used, the included number of items and the number of assessments it includes. Additionally, details on the scoring method are required, including the total score, and any modifications. Due to variability among assessment tools, the checklist also demands a description of included food and beverage items in each dietary pattern component. Further, verification of the inclusion of all key food components is emphasised. Daily serving sizes for each item need to be provided, as the serving size used for calculating servings per day for each item is absent in the original papers. Lastly, the checklist underscores the importance of describing the adherence levels, whether continuous, data-driven or literature-based. When employing data-driven cut-off points, explicit clarification of distinctions from literature-based cut-off points is considered insightful. Such comprehensive reporting enhances researchers’ understanding of result interpretation and facilitates evidence synthesis into dietary guidelines or interventions. This checklist can be supplemented by the Strengthening the Reporting of Observational Studies in Epidemiology-nutritional epidemiology guidelines(Reference Lachat, Hawwash and Ocké23).
Table 6 provides an overview of the number of participants included in adherence groups using both the literature-based and data-driven approaches. The data-driven and literature-based adherence levels for the MeDi, as outlined by Martinez-Gonzalez et al. (2012), DASH presented by Folsom et al. (2007) and for the MIND presented by Morris et al. (2015) are presented in Table 6. The literature-based approach resulted in unevenly weighted groups when assessing adherence to MeDi and DASH. Particularly, the MeDi groups were notably skewed, with almost all participants adhering to the lowest tertile group. In contrast, the data-driven approach, while yielding different cut-off points for each clinical trial, provided a more balanced distribution.
Supporting analyses were conducted to determine whether adherence to the MeDi, DASH and MIND dietary pattern scores through data-driven and literature-based approaches were associated with expected changes in biochemical markers and cardiovascular measures (Table S3 to S10 of online Supplementary Material C).
Discussion
The purpose of this study was to further standardise the dietary pattern scoring process from the dietary assessment tools in order to enhance the reproducibility and comparability of their outcomes. The study achieved two important goals. First, a step-by-step reproducible workflow was documented that scores the MeDi, DASH and MIND pattern using three commonly used dietary assessment tools: 24-h recall and two variations of an FFQ. This detailed workflow will allow future studies to replicate these scoring procedures, promoting consistency and facilitating generalisability across studies, thereby allowing for direct comparison in future research. Second, since most studies do not fully report how dietary scores were created, it is difficult to compare results across studies. Therefore, this workflow helped produce a recommended reporting checklist based on points within the scoring procedure, which can influence outcomes, which when followed, will enhance the synthesis of evidence into dietary guidelines. The following section will discuss the identified limitations of the assessment tools used to score the MeDi, DASH and MIND dietary patterns. This will include an exploration of factors hindering reproducibility, an overview of the strategies implemented to mitigate these limitations and an assessment of potential future directions.
Limiting factors of the assessment tools
Selecting an appropriate dietary assessment tool is a crucial choice that influences the amount of detailed information that can be collected in any research experiment and is therefore an important source of variability. For instance, FFQ typically have a predetermined list of food and beverage items, which might not be comprehensive enough to capture all the foods and beverages consumed by an individual. The CCV FFQ, for instance, collects data from seventy-four food items and six alcoholic beverages, and the EPIC FFQ collects data from 146 food items and twelve beverages, while the ASA24 allows for more flexibility in reporting as it can contain information on a total of 5740 foods and beverages.
The level of detail captured by the assessment tools used in this study had a significant impact on the highest achievable score of the dietary patterns as presented in Tables 2 and 4. The CCV and EPIC FFQ employed in this study are limited by their inability to capture certain dietary information, such as olive oil consumption. This lack of information affects the accuracy of adherence to the MeDi and MIND diet, reducing their highest achievable score from 14 to 12 and from 15 to 14, respectively. Additionally, the EPIC FFQ fails to capture information about how many times per week a participant consumes dishes seasoned with sofrito, further reducing the total score of the MeDi dietary pattern to 11. To address this major limitation, it is crucial to employ assessment tools that encompass all key components included in the dietary patterns, such as the ASA24, or utilize FFQ like the Harvard-Willett FFQ(Reference Rimm, Giovannucci and Stampfer44), which provide a more accurate granular reflection of individuals’ actual consumption habits.
Another limitation that arose during the scoring process is that the MIND score utilised in this study is limited by its method of assigning a score of 1 to an exact serving of alcohol equivalent to 5 ounces, which fails to account for individuals who consumed slightly more or less than one glass of wine. This may lead to inaccurate assessments of alcohol consumption among study participants.
Further, it is important to note that assessing self-reported diet recall in participants with memory issues presents a limitation. As a result, FFQ may be subject to recall bias, leading to inaccuracies in the reported dietary information(Reference Archer, Marlow and Lavie45). Further, FFQ are unable to capture day-to-day variations as they collect information on typical dietary intake over a 12-month period. In contrast, more detailed assessment tools such as the ASA24 collect information about all foods and beverages consumed during the previous day, including both weekdays and weekends, which provides a more accurate estimate of an individual’s day-to-day variations in dietary intake(Reference El Kinany, Garcia-Larsen and Khalis46).
To obtain enough detailed information on the different components of the MeDi, DASH and MIND dietary patterns, researchers are encouraged to carefully select a dietary assessment tool that aligns with the research question and can be standardised to obtain consistent and accurate results. Assessment tools such as the ASA24, dietary records and a 7-d food diary may overcome some of the limitations of the included FFQ, such as the limited food and beverage list, and the day-to-day variation(47). However, it is important to note that these alternative tools may have their own limitations(Reference Shim, Oh and Kim4,Reference Thompson and Subar6,Reference Thompson, Subar and Loria48) . Nonetheless, the provided scoring workflow for the ASA24 can, however, be used to standardise the scoring process beyond the specific assessment tools included in the current paper.
Limiting factors in the scoring process
An aspect where subjective judgement arises during the scoring process is during the identification of food items from the FFQ and ASA24 that fit into the different food component groups. Since this identification is subjective, it can result in differences in the amount and type of food items included. Another point where subjectivity can arise is during the identification and calculation of items from disaggregated dishes as not every dish is included in the AUSNUT recipe file, in some cases a similar dish needs to be matched. Additionally, identifying the serving sizes of all the individual items is also a subjective step, as the information on the grams equivalent to a serving is not always reported for each item in the utilised standardised dietary pattern methods. This lack of information on the number of grams equivalent to a serving size can cause variability and may present a challenge for accurate comparisons across studies. Further, the differences in servings stipulated in the FFQ and the differences in serving sizes between countries and regions increase this challenge(Reference Kirwan, Walsh and Brennan49–Reference Kromhout, Spaaij and de Goede51).
Limiting factors in the analysis approach
Besides standardising the scoring process, it is crucial to consider standardising the analysis methods, as the choice between continuous data and deciding whether to use data-driven or literature-based adherence level cut-off points introduces further variability. While literature-based cut-off points promote comparability and generalisability of findings across different populations and studies, they may not always be feasible. This was evident in our analysis, where the population adherence levels to the MeDi were consistently low across all our populations, deviating from the original paper(Reference Martínez-González, García-Arellano and Toledo15), which defines high adherence as a score of ≥ 10 out of 14. Notably, the total score was adjusted to 12 for the CCV FFQ due to its exclusion of information about olive oil and further reduced to 11 for the EPIC FFQ. As a result, none of the participants in the CANN and PLICAR trials attained a score ≥ 10. Even in the MAST population, only two participants achieved a MeDi score ≥ 10. This is despite the trial’s intentional recruitment strategy, aiming for diversity in diet quality by including 50 % of the population adhering to an ‘optimal’ diet and the other 50 % to a sub-optimal diet scored through the Diet Screening Tool(Reference Young, Gauci and Arnoldy25). While there were still only two participants in this trial with a MeDi score ≥ 10, geographical variations might also contribute to the observed low adherence, particularly given the documented low adherence to vegetables in Australian populations(Reference Gauci, Young, Macpherson and Ghosh52). Furthermore, the distribution of participants across literature-based adherence groups for the DASH and MIND was more favourable and even better in the MAST trial compared with the CANN and PLICAR trials. When assessing data-driven cut-off points, which are useful in describing results within a specific population but may not be comparable across populations and studies(Reference Wingrove, Lawrence and McNaughton3), it is essential to emphasise the differences between the obtained data-driven cut-off points and those described in the original papers. These differences in the analysis methods might contribute to the variations in effect estimates of a given intervention.
Steps towards overcoming limitations in dietary pattern scoring
The current paper addresses some of these limitations by presenting a list of food items for each component of the dietary patterns available through the ASA24, the CCV FFQ and EPIC FFQ (outlined in Tables 2–4) and providing the utilised grams equivalent to a serving size for each item (outlined in Tables 4 and 5). Missing serving sizes from the utilised dietary pattern scoring methods(Reference Folsom, Parker and Harnack17,Reference Morris, Tangney and Wang18) were extracted from the USA Department of Agriculture National Nutrient Database for Standard Reference Dietary Guidelines (2015–2020) for the DASH and MIND dietary patterns. These databases were used because the original DASH and MIND dietary patterns were scored in USA serving sizes. However, certain items like beans, cheese and yoghurt, which are extensively detailed in the USA Department of Agriculture database (each of the fifteen types of beans had a distinct serving size with varying serving sizes), posed a challenge. In such cases, an average of all the diverse types of these items was utilised since the ASA24 and FFQ did not encompass all the diverse types of beans, cheeses and yoghurts. In addition, this paper includes a description of how food items were extracted from reported disaggregated dishes.
Future directions
The scope of the current paper did not include evaluating the effects of various dietary pattern scoring methods to score the MeDi, DASH and MIND, despite there being several dietary pattern scoring methods for each. The MeDi, for instance, has twenty-eight unique scoring methods available(Reference Zaragoza-Martí, Cabañero-Martínez and Hurtado-Sánchez9). However, given the current lack of consensus regarding the most appropriate scoring method, it is imperative that future research explores the impact of utilising different dietary pattern scoring methods. Identification of the most suitable dietary scoring method would stimulate future research to use a single of a small number of approaches and further standardise this field.
Conclusion
This paper addresses the pressing issue of inconsistency in the dietary pattern scoring process and its reporting within the literature, which hinders the synthesis of consistent evidence into dietary guidelines. To address this challenge, a clear step-by-step reproducible workflow, along with a recommended reporting checklist, has been presented. However, it is essential to acknowledge that subjective judgements, such as the choice of analysis method, remain integral to the scoring process, underscoring the ongoing need for transparent reporting of employed methods. Lastly, the identified limitations in the assessment tools utilised in this paper offer valuable insights for future researchers, on what aspects to consider, when selecting assessment tools for scoring the MeDi DASH or MIND dietary patterns.
Acknowledgements
L. A. is funded by Swinburne University of Technology, Australia, through the Swinburne University Postgraduate Research Award (SUPRA). SG is currently funded by a NHMRC Synergy Grant (GNT1182301), and HM is funded by the Medical Research Future Fund (MRFF). In addition, Abbott Nutrition funded the CANN trial in part via a Centre for Nutrition, Learning, and Memory (CNLM) grant to the University of Illinois. This grant was allocated to the authors through a competitive peer-reviewed process. Further, MAST was funded by the H&H Group, and PLICAR was jointly funded by Arla Foods Ingredients Group P/S, Denmark and Swinburne University of Technology. It is important to note that the funders did not influence the study design, data collection, data analysis, data interpretation or the writing of the manuscript.
L. A. and D. J. W. conceived and designed the study. L. A. and S. G. scored the dietary patterns. L. A. and D. J. W. constructed the workflow and checklist. L. A., S. G., A. C. M. L., J. C. V., H. M., A. M. M., A. S., A. P. and D. J. W. all contributed to drafting and completing the manuscript.
A. P., A. S. and D. J. W. have received research funding honoraria and conference support and consultancy from the nutrition industry. The remaining authors declare that the research was conducted in the absence of any commercial or financial relationships that could be construed as a potential conflict of interest.
Supplementary material
For supplementary material/s referred to in this article, please visit https://doi.org/10.1017/S0007114524000072


 Open access