


Clinical Implications
This study provides evidence to support the use of Tilburg Frailty Indicator Part B (TFI-B) to determine frailty in older adults in a North American context. The results show that the TFI-B can be used as a quick screening tool to determine frailty, given its lower administration burden compared with the Fried’s Frailty Phenotype (FFP). Clinicians should use a score of < 5 on the TFI-B to rule out frailty, given its high negative predictive value (91.95%).
Background
Over the past few decades, several research studies have examined the impact of frailty on functioning and quality of life in older adults (Walston, Buta, & Xue, Reference Walston, Buta and Xue2018). There is a broader consensus in these studies that individuals who are frail have low physiological reserves to cope with stressors, are susceptible to rapid and irreversible decline in health, and have poor quality of life and physical functioning (Crocker et al., Reference Crocker, Brown, Clegg, Farley, Franklin and Simpkins2019; Kojima, Iliffe, Jivraj, & Walters, Reference Kojima, Iliffe, Jivraj and Walters2016). In addition, frailty is known to result in a greater risk of hospitalization (Chang, Lin, & Cheng, Reference Chang, Lin and Cheng2018), elevate the risk for fall and fall-related injuries (Cheng & Chang, Reference Cheng and Chang2017), and lead to poor outcomes in those requiring hospitalization (Muscedere et al., Reference Muscedere, Waters, Varambally, Bagshaw, Boyd and Maslove2017). Understandably, there is a call to prepare health care systems for timely identification and mitigation of the risk for frailty as well as to manage the adverse health outcomes in those who are deemed frail (Muscedere et al., Reference Muscedere, Andrew, Bagshaw, Estabrooks, Hogan and Holroyd-Leduc2016).
Recent studies suggest that the prevalence of frailty in community-dwelling adults over the age of 60 years is 7 per cent globally (Ofori-Asenso et al., Reference Ofori-Asenso, Chin, Mazidi, Zomer, Ilomaki and Zullo2019), 6.5 per cent in Canada (Lee et al., Reference Lee, Patel, Costa, Bryce, Hillier and Slonim2017), and up to 15 per cent in the United States (Bandeen-Roche et al., Reference Bandeen-Roche, Seplaki, Huang, Buta, Kalyani and Varadhan2015). These are staggering statistics that should alarm health care providers working with geriatric populations. Adults over the age of 65 years are the fastest growing demographic around the world (He, Goodkind, & Kowal, Reference He, Goodkind and Kowal2016). Current projections suggest that the number of older adults in the United States will surpass the number of children under the age of 18 years by 2035, and that there will be approximately 88,000,000 older adults by 2050, almost double the 48,000,000 older adults in the United States in 2015 (He et al., Reference He, Goodkind and Kowal2016). Because individuals who are frail utilize more health care resources, the burden placed on health care systems will be challenging. As we prepare to manage a growing population of the elderly, it is critical to engage in early identification of those who are pre-frail or frail and to provide structured evidence-based interventions that effectively reverse frailty-related impairments (Apóstolo et al., Reference Apóstolo, Cooke, Bobrowicz-Campos, Santana, Marcucci and Cano2018; Travers, Romero-Ortuno, Bailey, & Cooney, Reference Travers, Romero-Ortuno, Bailey and Cooney2019). Such an approach can reduce the frequency and extent of health care utilization by older adults who are frail. Most importantly, early identification of individuals who might be on trajectory to becoming frail or who are already frail can facilitate appropriate interventions to enable these individuals to experience optimal physical health and quality of life.
Over the years, approaches to assess whether an individual is frail or pre-frail have evolved (Walston et al., Reference Walston, Buta and Xue2018). One of the earlier studies proposed a broader definition of frailty, suggesting that individuals can be deemed frail if they have any one of the traits such as physical disability, cognitive or neurological deficits, or being on prolonged bed rest, or have family-related or socio-economic problems (Winograd et al., Reference Winograd, Gerety, Chung, Goldstein, Dominguez and Vallone1991). Subsequently, other frameworks such as the Deficit Accumulation Index, Gill Frailty Measure, and Clinical Frailty Scale or FRAIL Scale were developed as instruments for assessing frailty (Buta et al., Reference Buta, Walston, Godino, Park, Kalyani and Xue2016). Fried et al. (Reference Fried, Tangen, Walston, Newman, Hirsch and Gottdiener2001) conducted a defining work and proposed the Fried’s Frailty Phenotype (FFP) framework. The FFP suggests that frailty is characterized not just by illness or physical dysfunction but also by a combination of weakness, slowness, exhaustion, low physical activity, and weight loss. In particular, FFP classifies individuals as pre-frail if they exhibit one or two of these characteristics, and as frail if they exhibit three or more of these characteristics. Although the FFP remains one widely used framework for determining frailty, it has a few limitations. First, the FFP requires administration of several performance-based tests such as those assessing hand grip strength (HGS) and gait speed (GS) as well as administration of appropriate measures to examine physical activity and exhaustion levels. This greatly increases its administrative burden, making it difficult to be used for quick screening. Second, the FFP focuses solely on the physical aspects of frailty and does not consider frailty as a syndrome beyond problems of physical function. Recently, researchers proposed that cognitive deficits should be considered along with physical functional deficits when characterizing frailty (Aubertin-Leheudre, Woods, Anton, Cohen, & Pahor, Reference Aubertin-Leheudre, Woods, Anton, Cohen and Pahor2015; Kelaiditi et al., Reference Kelaiditi, Cesari, Canevelli, van Kan, Ousset and Gillette-Guyonnet2013). Despite multiple efforts to comprehensively define frailty, an abundance of research in the area, and a widespread agreement to integrate frailty assessments into clinical practice, there remains no consensus on the definition or the best tool for assessing frailty (Morley et al., Reference Morley, Vellas, Van Kan, Anker, Bauer and Bernabei2013; Rodriguez-Manas et al., Reference Rodriguez-Manas, Feart, Mann, Vina, Chatterji and Chodzko-Zajko2013).
The Tilburg Frailty Indicator (TFI) is a self-reported measure used to identify individuals who are frail (Gobbens, van Assen, Luijkx, Wijnen-Sponselee, & Schols, Reference Gobbens, van Assen, Luijkx, Wijnen-Sponselee and Schols2010). Gobbens, Luijkx, Wijnen-Sponselee, and Schols (Reference Gobbens, Luijkx, Wijnen-Sponselee and Schols2010) proposed the conceptual model for developing the TFI in an earlier publication. This model advocated that the definition of frailty should include components beyond physical dysfunction such as nutrition, mobility, physical activity, strength, endurance, balance, cognition, sensory function, mood, coping, social relations, and social support (Gobbens, Luijkx, et al., Reference Gobbens, Luijkx, Wijnen-Sponselee and Schols2010). These components are in line with the developing consensus among international frailty experts who suggest including different aspects of cognitive and social domains when defining frailty (Kelaiditi et al., Reference Kelaiditi, Cesari, Canevelli, van Kan, Ousset and Gillette-Guyonnet2013; Rodriguez-Manas et al., Reference Rodriguez-Manas, Feart, Mann, Vina, Chatterji and Chodzko-Zajko2013). The TFI consists of Part A (demographic, socio-economic, and health characteristics) and Part B (physical, psychological, and social domains of frailty) (Gobbens, van Assen, et al., Reference Gobbens, van Assen, Luijkx, Wijnen-Sponselee and Schols2010). Measurement properties such as reliability and known-group validity (ability to discriminate between known subgroups) for the TFI part B (TFI-B) are beginning to be assessed in different cultural contexts beyond The Netherlands where the TFI was first developed (Gobbens, van Assen, et al., Reference Gobbens, van Assen, Luijkx, Wijnen-Sponselee and Schols2010). A systematic review suggested that the TFI-B has a greater pool of evidence for its reliability and validity than other multi-component frailty assessment tools such as Groningen Frailty Indicator, The Comprehensive Frailty Assessment Instrument, or the Edmonton Frail Scale (Sutton et al., Reference Sutton, Gould, Daley, Coulson, Ward and Butler2016). Specifically, scores of ≥ 5 on the TFI-B are highly accurate in identifying frail individuals (Gobbens, Boersma, Uchmanowicz, & Santiago, Reference Gobbens, Boersma, Uchmanowicz and Santiago2020).
An advantage of the TFI-B over a commonly used frailty framework such as the FFP is that it is a self-reported tool with a high level of accuracy in identifying frailty. This greatly reduces its administrative burden. Additionally, the TFI-B operationalizes frailty across much broader domains beyond the physical impairment aspect of frailty defined by Fried et al. (Reference Fried, Tangen, Walston, Newman, Hirsch and Gottdiener2001). However, its known-group validity and accuracy in classifying frail individuals have not been extensively studied in the context of older adults in the United States even though it was developed in English. This study examined concurrent and known-group validity of the TFI-B in community-dwelling older adults consulting a geriatric outpatient clinic. In addition, the study also assessed the sensitivity and specificity of the TFI-B in accurately differentiating frail or pre-frail from non-frail older adults.
Methods
The study used a cross-sectional measurement and accuracy design with data collected in one session.
Participants
Using convenience sampling methodology, we approached patients 65 years of age or older attending the outpatient geriatric medicine clinic at Marshall Health in Huntington, West Virginia, USA, to participate in this study. We excluded people with severe cognitive impairment that resulted in an inability to understand study instructions, an inability to communicate and read English, and any pre-existing musculoskeletal or neurological impairments resulting in wheelchair dependency for mobility. The study protocol described in subsequent sections was approved by the Institutional Review Board at Marshall University.
Outcome Measures and Determining Frailty
Several self-reported and performance-based measures were administered to capture broader domains of physical function, balance, and physical activity level. Presence of frailty was determined using TFI-B as well as the FFP.
TFI
Participants only completed Part B of the TFI. This is because the scoring for the TFI is derived only from Part B, whereas Part A intends to capture demographic information, and none of the questions in it are scored. Part B has been deemed reliable and accurate in identifying frailty in community-dwelling older adults in the Dutch population where it was conceived, and also in older adults in Brazil, Poland, Italy, Portugal, and Denmark (Gobbens et al., Reference Gobbens, Boersma, Uchmanowicz and Santiago2020; Gobbens, van Assen, et al., Reference Gobbens, van Assen, Luijkx, Wijnen-Sponselee and Schols2010). Individuals who score ≥ 5 out of a maximum possible score of 15 on TFI-B are deemed frail (Gobbens et al., Reference Gobbens, Boersma, Uchmanowicz and Santiago2020; Gobbens, van Assen, et al., Reference Gobbens, van Assen, Luijkx, Wijnen-Sponselee and Schols2010). The TFI-B questionnaire can be accessed from the study published by Gobbens, Luijkx, et al. (Reference Gobbens, Luijkx, Wijnen-Sponselee and Schols2010).
FFP
Frailty was also determined using the frailty phenotype constructs outlined by Fried et al. (Reference Fried, Tangen, Walston, Newman, Hirsch and Gottdiener2001). These constructs included slowness, weakness, exhaustion, low physical activity, and unintentional weight loss. Some modifications were made in using precise outcome measures as well as desired benchmarks to determine impairments for different FFP constructs. Table 1 summarizes the constructs assessed in the FFP, the criteria originally proposed by Fried et al. to assess these constructs (Fried et al., Reference Fried, Tangen, Walston, Newman, Hirsch and Gottdiener2001), relevant question on the TFI for that particular construct, and the criteria we used in this study for assessing impairment in that constructs.
Table 1. Constructs within FFP criteria used in this study, and matching question on TFI-B
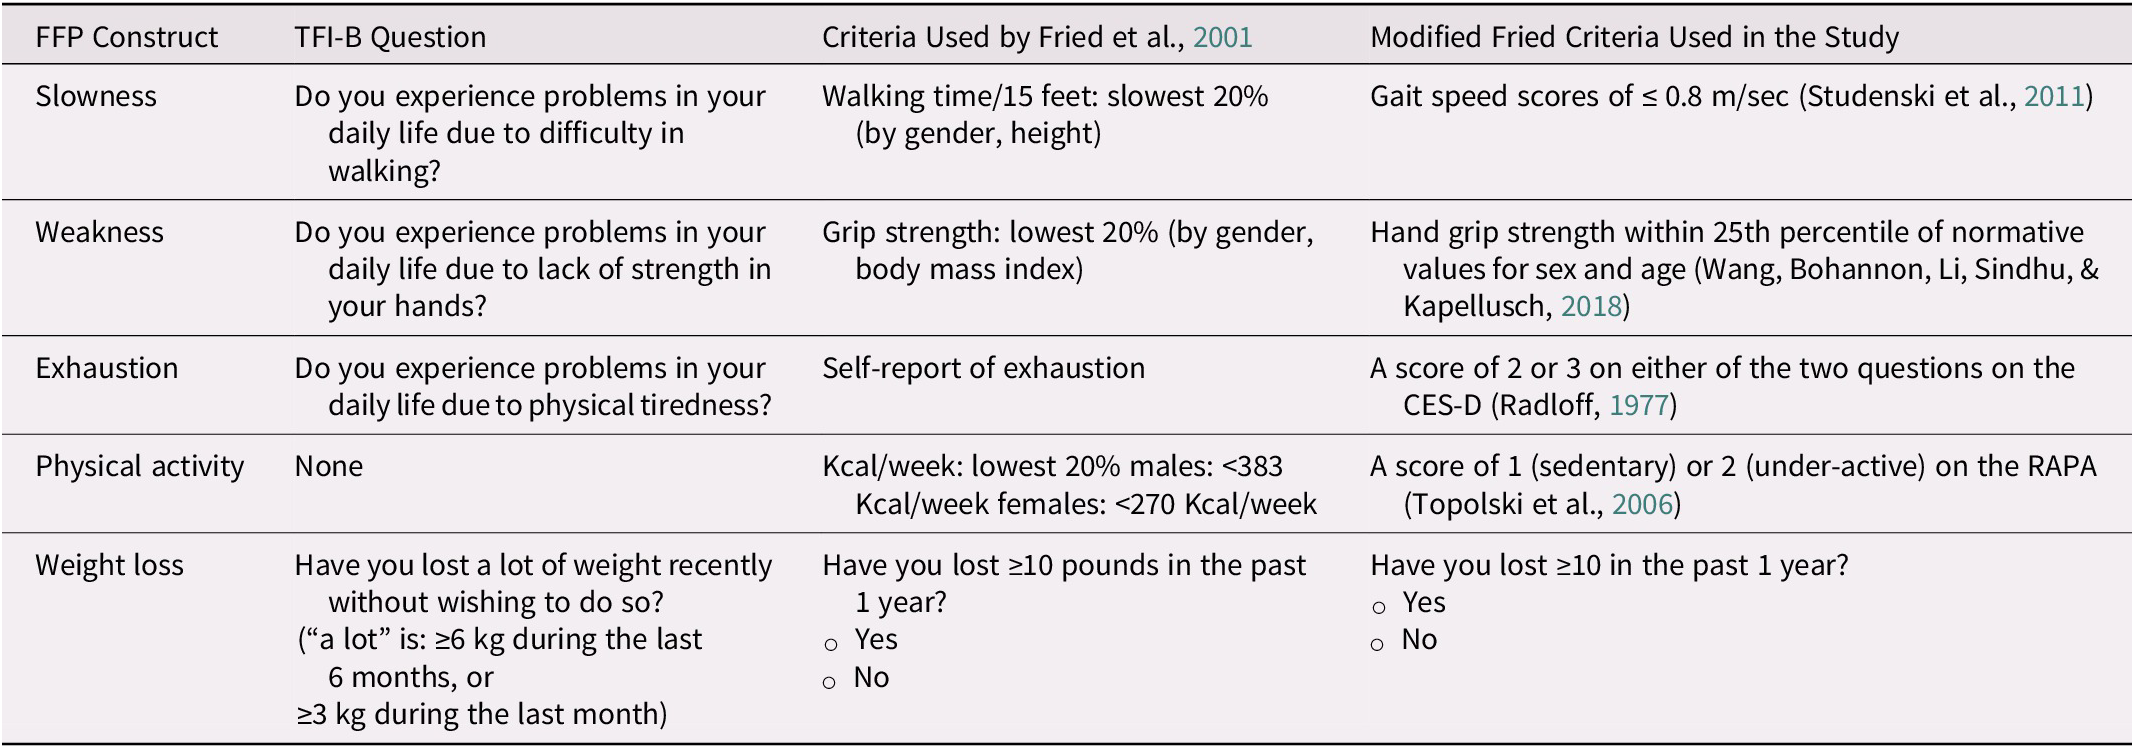
Note. CES-D = Center for Epidemiological Study Depression Questionnaire; FFP = Fried’s Frailty phenotype; TFI-B = Part B of the Tilburg Frailty Indicator.
Slowness. Consistent with the criteria used by Fried et al., Reference Fried, Tangen, Walston, Newman, Hirsch and Gottdiener2001, slowness was assessed using performance in GS. GS was assessed over a 4 m walking path. The start and finish lines were indicated by tapes on the floor. Participants stood with their toes behind the starting line and walked past the finish line at their usual pace when prompted by the command of “Ready, 1, 2, 3, and Go” (Bohannon & Wang, Reference Bohannon and Wang2019). Time from the command of “go” to when participant’s first foot crossed the 4-m mark was obtained as the test score. Participants completed one practice trial and two test trials with the best speed in those two trials considered for calculating GS. GS assessed over 4 m has adequate test–retest reliability (Fernández-Huerta & Córdova-León, Reference Fernández-Huerta and Córdova-León2019) and validity (Peters, Fritz, & Krotish, Reference Peters, Fritz and Krotish2013). GS assessed over a 4-m path is highly reproducible and has a very small measurement error when used in older adults (Goldberg & Schepens, Reference Goldberg and Schepens2011). GS scores of ≤ 0.8 m/sec suggest an increased risk of institutionalization, disability, and even mortality (Studenski et al., Reference Studenski, Perera, Patel, Rosano, Faulkner and Inzitari2011). Therefore, GS scores of ≤ 0.8 m/sec indicated decreased gait speed and slowness (Studenski et al., Reference Studenski, Perera, Patel, Rosano, Faulkner and Inzitari2011).
Weakness. Weakness was assessed, similarly to the approach suggested by Fried et al., Reference Fried, Tangen, Walston, Newman, Hirsch and Gottdiener2001, using HGS. The HGS on the dominant side was assessed using Lafayette Hand Dynamometer (Model J00105, Lafayette Instruments, Lafayette, IN, USA) consistent with the methodology described by the American Society of Hand Therapists (Fess, Reference Fess and Casanova1992). Participants were asked to press the handle of the dynamometer as hard as they could with sustained increasing effort over 5 sec. An average of three trials was obtained as the test score. Previous research has shown that the handheld dynamometer is reliable and valid for assessing HGS in community-dwelling older adults (Schaubert & Bohannon, Reference Schaubert and Bohannon2005). HGS within the 25th percentile of normative values for sex and age indicated weakness (Wang, Bohannon, Li, Sindhu, & Kapellusch, Reference Wang, Bohannon, Li, Sindhu and Kapellusch2018).
Exhaustion. Two questions from Center for Epidemiologic Studies Depression Scale (CES-D) were administered to determine exhaustion level (Radloff, Reference Radloff1977). The questions were “How often have you felt that everything required considerable effort during the past week?” and “How often could you not get going during the past week?” The response choices for these questions were 0 = rarely or none of the time (less than one day), 1 = some or a little of the time (1–2 days), 2 = occasionally or moderate amount of time (3–4 days), and 3 = most or all of the time (5–7 days). These questions have been used before for determining exhaustion in the context of frailty screening in older adults (Lee et al., Reference Lee, Patel, Costa, Bryce, Hillier and Slonim2017; Pao, Chen, Chang, Chen, & Tsai, Reference Pao, Chen, Chang, Chen and Tsai2018). A score of 2 or 3 on either of the two questions of the CES-D indicated exhaustion (Radloff, Reference Radloff1977).
Physical activity. Criteria for determining physical activity level were different from that used by Fried et al. (Reference Fried, Tangen, Walston, Newman, Hirsch and Gottdiener2001), who derived physical activity levels in kilocalories expended each week from the Minnesota Leisure Time Activities Questionnaire. We used the Rapid Assessment of Physical Activity (RAPA) for determining low physical activity. This approach for assessing physical activity was also adopted in recent studies that screened older adults for frailty (Lee et al., Reference Lee, Patel, Costa, Bryce, Hillier and Slonim2017; Mohd Hamidin, Adznam, Ibrahim, Chan, & Abdul Aziz, Reference Mohd Hamidin, Adznam, Ibrahim, Chan and Abdul Aziz2018). A score of 1 (sedentary) or 2 (under-active) on the RAPA indicated low physical activity (Topolski et al., Reference Topolski, LoGerfo, Patrick, Williams, Walwick and Patrick2006).
Weight loss. Lastly, significant weight loss was determined by inquiring whether participants had lost ≥ 10 lb (that is 4.5 kg) in the past 1 year. Fried et al. (Reference Fried, Tangen, Walston, Newman, Hirsch and Gottdiener2001) adopted the same approach.
Participants were classified as frail if they had impairments in three or more constructs.
Examiners
These data represent a subset of a cohort from patients seen in the Geriatric Section of Internal Medicine at Marshall University School of Medicine, Huntington, West Virginia, USA. The overarching purpose of this research is to screen patients who are consulting geriatric physicians for physical function and frailty. Research fellows affiliated with the Department of Internal Medicine conducted all examinations. Each fellow underwent a standardization session and established adequate inter-rater reliability (intraclass correlation coefficient of > 0.75) (Koo & Li, Reference Koo and Li2016) with the principal investigator (S.P.M.) in administering all of the performance-based measures outlined on healthy volunteers prior to collecting data on research participants.
Recruitment Strategy and Data Collection
Patients consulting a geriatrician were approached by research fellows for participation in the study. They signed a consent form and then participated in the data collection session. Participants completed all of the self-reported measures prior to testing for the performance-based measures. Investigators administered the GS and HGS in a random sequence. At least a 30-sec rest period was provided between each trial of the GS and HGS. A 1-min rest period was provided between testing for each measure. Investigators used clinical charts to obtain demographic information and health history including age, sex, height, weight, education level, active medical conditions, list of medications, history of hospitalizations (in the past 2 years), use of an assistive device for mobility, and the dominant side. A geriatrician extracted information on active medical conditions and the list of medications from the clinical chart at the time of the data collection session.
Data Analysis
Demographic and health information as well as the scores for outcome measures were summarized for all participants stratified by frailty status. Normality for the numerical variables was assessed using the Shapiro Wilk test (Ghasemi & Zahediasl, Reference Ghasemi and Zahediasl2012). Concurrent validity of the TFI-B was examined by calculating Pearson Correlation Coefficients (r) to demonstrate its relationship with other outcome measures. Coefficient values of > 0.7, between 0.50 and 0.70, between 0.30 and 0.50, and < 0.30 were suggestive of high, moderate, low, and negligible correlations, respectively (Mukaka, Reference Mukaka2012). We hypothesized that the TFI-B would demonstrate moderate relationships (r > 0.50) to attributes of physical function such as GS, HGS, and RAPA scores (H1). Known-group validity of the TFI-B was examined by comparing the differences in demographic and health characteristics as well as scores for outcome measures using a cut-off score of ≥ 5 on the TFI-B. This cut-off score was considered based on previous study that suggested that those who score ≥ 5 on the TFI-B are frail (Gobbens et al., Reference Gobbens, Boersma, Uchmanowicz and Santiago2020). Known-group validity examined whether a test/questionnaire (in this case the TFI-B) sufficiently discriminates two known subgroups (in this case, subgroups created by the cut-off score of ≥ 5 vs. < 5 on the TFI-B) (Davidson, Reference Davidson and Michalos2014). Independent t tests (continuous variables) or chi-square tests (categorical variables) were performed for these comparisons with p values of < 0.05 considered significant and indicative of satisfactory known-group validity. We hypothesized that the GS, HGS, and RAPA scores would be significantly different between those who scored ≥ 5 versus those who scored < 5 on the TFI-B (H2).
Accuracy of the TFI-B in determining frailty level was assessed using several iterative and sequential steps. Binary logistic regression assessed the relationships between the TFI-B scores and being classified as frail according to the FFP (dependent variable). The regression analysis was adjusted for potential covariates such as age (number of years), sex (male vs. female), body mass index (BMI), being on four or more medications (Masnoon, Shakib, Kalisch-Ellett, & Caughey, Reference Masnoon, Shakib, Kalisch-Ellett and Caughey2017), number of co-morbid conditions, history of hospitalization (yes or no), and use of assistive devices for outdoor ambulation (no = 0, cane = 1, walker = 2). Receiver operating characteristics (ROC) curves were plotted to examine the accuracy of the TFI-B scores in distinguishing individuals who were frail from those who were non-frail. The magnitude of the area under the curve (AUC) of 0.5 for the ROC suggested no discrimination, a magnitude between 0.5 and 0.7 indicated poor discrimination, between 0.7 and 0.8 suggested acceptable discrimination, between 0.8 and 0.9 suggested excellent discrimination, and > 0.9 suggested outstanding discrimination (Mandrekar, Reference Mandrekar2010). We hypothesized that the TFI-B scores would demonstrate acceptable discrimination (AUC > 0.70) in identifying individuals who were frail versus non-frail (H3). Sensitivity and specificity of the TFI-B scores in identifying those with or without frailty were examined with an emphasis on whether the previously established cut-off score of ≥ 5 on TFI-B had good sensitivity and specificity in identifying individuals with frailty. The positive predictive value (PPV) and negative predictive value (NPV) were calculated for TFI-B scores of ≥ 5. The prevalence of frailty was estimated to be 20 per cent for calculating PPV and NPV. This estimate was chosen considering that the average age of participants in this sample was 78.3 (± 7.6) years and that the published data indicate that the prevalence of frailty in Americans who are between 75 and 79 years of age is 20 per cent (Bandeen-Roche et al., Reference Bandeen-Roche, Seplaki, Huang, Buta, Kalyani and Varadhan2015). P values of < 0.05 were used as indicators of statistical significance where applicable.
All the analyses were completed using SPSS (v.26, Armonk, NY, USA).
Results
The characteristics of the sample recruited for this study are shown in Table 2 stratified by frailty level determined using Fried’s phenotype. Thirty-seven (51.4%) participants were deemed frail. There were a proportionately much higher number of females (84.7%) than males (15.3%) in the sample. The frailty level was comparable among females and males (p = 0.25). When compared with the non-frail subgroup, individuals deemed to be frail were significantly older (81.4 ± 8 years vs. 75 ± 6.6 years, p = 0.0004), had worse gait speed (0.7 ± 0.2 m/sec vs. 0.9 ± 0.2 m/sec, p < 0.0001), weaker grip strength in the dominant hand (16.4 ± 6.5 kg vs. 22 ± 6.6 kg, p < 0.0001), and higher scores on the TFI-B (5.6 ± 2.4 vs. 2.9 ± 1.9, p < 0.0001). These subgroups (frail vs. non-frail) did not differ in BMI, number of co-morbid conditions, or whether they were taking four or more medications (p > 0.05).
Table 2. Characteristics of participants overall and stratified By FFP category (n = 72)

Note. BMI = body mass index; SD = standard deviation; OR = odds ratio; TFI-B, Part B of the Tilburg Frailty Indicator. p values that were significant are shown in boldface.
Concurrent and Known-Group Validity
The relationships between the TFI-B scores and other measures assessed using Pearson correlations are shown in Table 3. The TFI-B showed negligible (r < 0.30) and non-significant (p > 0.05) correlations with GS, HGS, and RAPA (Table 3) indicating that the results did not meet our pre-specified hypothesis (H1). Table 4 shows the results for known-group validity assessed using independent t tests. The scores for physical activity level, HGS, or the demographic characteristics of age and sex were not different for those who were deemed frail than for those who were deemed non-frail using the cut-off scores for the TFI-B (scores of ≥ 5). Nonetheless, participants scoring ≥ 5 on the TFI-B had worse scores for GS (0.7 ± 0.2 m/sec vs. 0.86 ± 0.2 m/sec; p = 0.006) and had worse co-morbid burden (3.7 ± 1.9 vs. 2.8 ± 1.4; p = 0.03). This suggests that results only partially fulfilled our pre-specified hypothesis for known-group validity of the TFI-B scores (H2).
Table 3. Pearson correlation coefficients showing concurrent relationships of the TFI-B with other measures (n = 72)
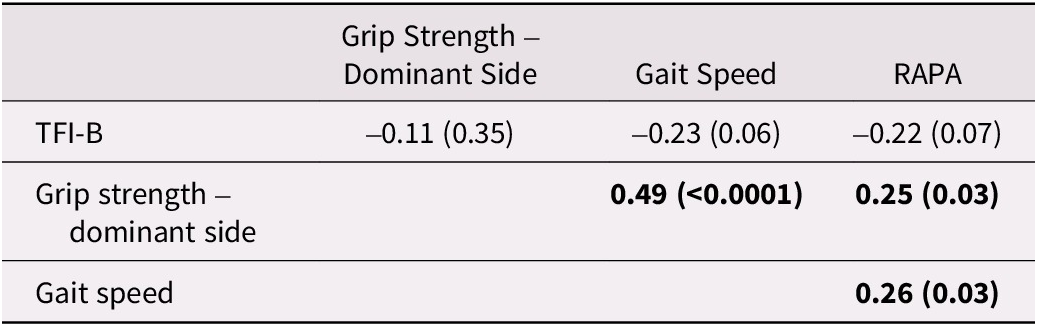
Note. RAPA = Rapid Assessment of Physical Activity; TFI-B = Part B of the Tilburg frailty indicator. p values are shown in the parentheses. Correlations significant at p values < 0.05 are shown in boldface.
Table 4. Known group validity of the TFI-B (n = 72)

Note. BMI = body mass index; RAPA = Rapid Assessment of Physical Activity; SD = standard deviation; TFI-B = Part B of the Tilburg Frailty Indicator. p-values that were significant are shown in boldface.
Accuracy of TFI-B Scores in Identifying Frail Status
Logistic regression showed that being older (odds ratio [OR] of 1.11; p = 0.022) and having higher scores on the TFI-B (OR of 1.76; p = 0.001) were associated with being considered frail using the FFP. Figure 1 shows the ROC highlighting the accuracy of TFI-B scores in classifying those who are frail versus those who are non-frail. The TFI-B showed excellent accuracy in classifying individuals who were frail (AUC of 0.82 with 95% of 0.72, 0.92) suggesting that the results were consistent with a pre-specified hypothesis for accuracy (H3). The data for the diagnostic accuracy of the TFI-B cut-off scores of ≥ 5 in identifying individuals with frailty are shown in Table 5. The TFI-B cut-off scores had more moderate sensitivity and specificity statistics (73% and 77.14% respectively) as well as positive (3.19) and negative likelihood ratios (0.35) in identifying frail status. However, it had an excellent NPV value of 91.95% (86.71. 95.23).

Figure 1. Receiver operating characteristics curve demonstrating accuracy of the TFI-B scores in classifying frail versus non-frail individuals.
Table 5. Diagnostic accuracy data for TFI-B scores of ≥5 in identifying individuals who are frail

Note. CI = confidence interval.
Discussion
The TFI-B is a promising measure to screen for frailty in individuals who are consulting health care providers for their health needs. Preliminary research has shown that the scores of ≥ 5 on the TFI-B had excellent accuracy in identifying frailty in a sample of Dutch community-dwelling older adults (Gobbens et al., Reference Gobbens, Boersma, Uchmanowicz and Santiago2020). Our study examined its validity as well as its accuracy in identifying frailty in older adults in the United States. Our results confirmed that the TFI-B indeed has good accuracy in identifying frailty, especially in ruling out frailty considering the high NPV, in community-dwelling older adults consulting a geriatric medicine clinic. Our results also suggest that the TFI-B has moderate known-group validity in that the TFI-B cut-off scores of ≥ 5 distinguish individuals with slower from those with faster GS, but do not distinguish differences in other attributes of physical frailty such as HGS or physical activity level captured using RAPA. The results of this study should evoke interest in further examining the measurement properties and utility of using the TFI-B in screening for frailty in community- dwelling older adults in the United States who have not undergone frailty screening.
Of the participants recruited in this study, as many as 51.4 per cent (n = 37) were deemed frail. This number is much higher than published data, indicating that 20 per cent of Medicare enrollees between 75 and 79 years of age were considered frail using Fried’s phenotype framework (Bandeen-Roche et al., Reference Bandeen-Roche, Seplaki, Huang, Buta, Kalyani and Varadhan2015). The participants in our sample were consulting a geriatrician for their health needs. It is likely that their overall health status and function are not at the same level as typical community-dwelling older adults who do not feel the need to consult a geriatrician. In addition, the estimate for the prevalence of frailty in the United States is known to vary widely based on geographic region, and can be as high as twice the point estimate for a given age group (Bandeen-Roche et al., Reference Bandeen-Roche, Seplaki, Huang, Buta, Kalyani and Varadhan2015). In particular, the overall health status in the population of a rural mountain community where this present study was conducted, is known to be poor, with a high burden of morbidity and mortality (McGarvey, Leon-Verdin, Killos, Guterbock, & Cohn, Reference McGarvey, Leon-Verdin, Killos, Guterbock and Cohn2011; Singh, Kogan, & Slifkin, Reference Singh, Kogan and Slifkin2017). These factors may collectively explain the higher rate of frailty in our sample.
Assessment of the concurrent validity of the TFI-B scores demonstrated divergent relationships (r < 0.50) with other measures such as GS, HGS, or RAPA scores, suggesting that the results were not consistent with our hypothesis (H1). Similarly, the subgroups based on the cut-off scores for the TFI-B (≥ 5 vs. <5) differed significantly in their GS but not HGS or RAPA scores, further indicating that the results of known-group validity assessment did not fully meet our pre-conceived hypothesis (H2). The TFI-B was conceived with a notion that frailty is not merely a physical construct, but rather a multidimensional phenomenon (Gobbens, van Assen, et al., Reference Gobbens, van Assen, Luijkx, Wijnen-Sponselee and Schols2010), a position that has been taken by others (Markle-Reid & Browne, Reference Markle-Reid and Browne2003; Rodriguez-Manas et al., Reference Rodriguez-Manas, Feart, Mann, Vina, Chatterji and Chodzko-Zajko2013; Rolfson, Majumdar, Tsuyuki, Tahir, & Rockwood, Reference Rolfson, Majumdar, Tsuyuki, Tahir and Rockwood2006). Specifically, merely looking at frailty through a physical problem lens is not congruent with the accepted definition of health that also integrates mental and social well-being (Gobbens, Luijkx, et al., Reference Gobbens, Luijkx, Wijnen-Sponselee and Schols2010). The 15-item TFI-B has items that capture psychological (4 items) and social components (3 items) along with physical components (8 items) of frailty (Gobbens, van Assen, et al., Reference Gobbens, van Assen, Luijkx, Wijnen-Sponselee and Schols2010). It is likely that some individuals can have a high score on the TFI-B (≥ 5) because of concerns with their psychological or social status despite having no concerns with physical function. The low correlation observed between the TFI-B scores and GS, HGS, and RAPA scores suggest that the TFI-B examines a unique and much broader construct of frailty compared with isolated single-domain frailty indicators such as GS or HGS alone or a questionnaire about physical activity. In addition, the questions about GS and HGS in the TFI-B are contextualized in relation to perceived problems in daily life resulting from “difficulty in walking” or “lack of strength in hands”. Perception of problems in daily life caused by difficulty in walking or weakness in the hands versus actual objective assessment of GS and HGS are two dissimilar constructs. Poor correlation or lack of sufficient known-group validity of the TFI-B scores with GS, HGS, and RAPA scores do not necessarily suggest poor validity. These findings indicate a diverse operational framework and lack of domain overlap for frailty defined by the TFI-B compared with the Fried’s framework for frailty. In the future, it would be interesting to examine the magnitude of correlations and domain overlap of the TFI-B scores with measures assessing psychological well-being such as the Patient Health Questionnaire (Kroenke, Spitzer, & Williams, Reference Kroenke, Spitzer and Williams2001) or the mental component summary of the Short-Form 36 (Ware & Sherbourne, Reference Sherbourne1992).
Of the demographic and health variables, older age was significantly associated with being classified as frail, but sex, BMI, polypharmacy, or having a greater co-morbid burden were not associated with being classified as frail by Fried’s phenotype framework. These findings, especially the associations of age, sex, and polypharmacy with being frail, have been observed in previous research (Fhon et al., Reference Fhon, Rodrigues, Santos, Diniz, Santos and Almeida2018; Gobbens et al., Reference Gobbens, Boersma, Uchmanowicz and Santiago2020; Hammami et al., Reference Hammami, Zarrouk, Piron, Almas, Sakly and Latteur2020; Kendhapedi & Devasenapathy, Reference Kendhapedi and Devasenapathy2019). Some of these studies used different operational definitions of frailty. For example, Gobbens et al. (Reference Gobbens, Boersma, Uchmanowicz and Santiago2020) used TFI-B scores, Hammami et al. (Reference Hammami, Zarrouk, Piron, Almas, Sakly and Latteur2020) used modified Short Emergency Geriatric Assessment scores, and Kendhapedi & Devasenapathy (Reference Kendhapedi and Devasenapathy2019) used the TFI-B scores as well as Fried’s Phenotype, whereas Fhon et al. (Reference Fhon, Rodrigues, Santos, Diniz, Santos and Almeida2018) used the Edmonton Frail Scale. Similarities and dissimilarities in our results in the context of the existing literature can emerge from operational definitions of frailty used for considering frail status, which may incorporate domains beyond the physical frailty component used by Fried’s phenotype. It was suggested that being a woman was significantly associated with frailty (Serra-Prat et al., Reference Serra-Prat, Papiol, Vico, Palomera, Sist and Cabré2016). There are some key similarities and differences between previous research and our results. Our sample had 84.7 per cent (61 of 72 participants) females compared with the study done by Serra-Prat et al. (Reference Serra-Prat, Papiol, Vico, Palomera, Sist and Cabré2016) where only 28.8 per cent of participants were females. This likely had an impact on understanding the association between being female or male and a frail classification.
To our knowledge, this is the first research that has examined the accuracy of the TFI-B score in identifying frailty in the United States. The results of this study are in line with previous research conducted in a Dutch cohort where the TFI-B accurately distinguished older adults who were reported to have greater disability (AUC = 0.87) (Gobbens et al., Reference Gobbens, Boersma, Uchmanowicz and Santiago2020). The sensitivity and specificity for the TFI-B scores of ≥ 5 in identifying frail versus non-frail individuals in our study was somewhat comparable to previous research by Gobbens et el (Reference Gobbens, Boersma, Uchmanowicz and Santiago2020). Positive and negative predictive values have greater utility in diagnostic decision making than statistics such as sensitivity and specificity or likelihood ratios for two distinct reasons. First, the PPV and NPV values differ based on disease prevalence in the geographic area in which the tests are used (Trevethan, Reference Trevethan2017). An increase in disease prevalence will result in an increase in the PPV and a decrease in the NPV. Therefore, the probability of a diagnosis can vary from one region to another for a given diagnostic test despite that test having identical sensitivity and specificity. Second, the PPV and NPV of a diagnostic test are extremely useful for decision making at the level of an individual patient. They yield a level of confidence to clinicians in determining the presence or absence of disease based on the result of the test. We used the threshold of 20 per cent prevalence of frailty in the age group of 75–79 years based on published research for the United States (Bandeen-Roche et al., Reference Bandeen-Roche, Seplaki, Huang, Buta, Kalyani and Varadhan2015). Based on our results, we strongly recommend the TFI-B score of ≥ 5 to be used in screening for the presence of frailty, considering the high NPV (91.95%). In other words, clinicians can be almost 92 per cent certain that their patients are not frail if they score < 5 on the TFI-B. Considering that the PPV of the TFI-B score of ≥ 5 is only 44.49 per cent, a positive result (score of ≥ 5) is not sufficient to deem anyone frail. Therefore, we do not recommend using the TFI-B for confirming the presence of frailty. A more established approach such as the FFP is more appropriate for confirming the presence of frailty. In summary, we recommend that the TFI-B be used for the purpose of frailty screening in primary care settings, where those who score ≥ 5 should undergo a comprehensive frailty assessment using the FFP, and those who score < 5 can be ruled out as being frail.
This study is not without limitations. Frailty has been operationalized using many different domains, where physical frailty is considered only one of several domains (Rodriguez-Manas et al., Reference Rodriguez-Manas, Feart, Mann, Vina, Chatterji and Chodzko-Zajko2013). One can argue that using FFP as a gold standard does not fully capture the wide spectrum of problems that individuals may have beyond physical impairments. Nonetheless, there is as yet no consensus on the definition of frailty (Rodriguez-Manas et al., Reference Rodriguez-Manas, Feart, Mann, Vina, Chatterji and Chodzko-Zajko2013). Fried’s framework arguably remains the most widely used in research as well as in clinical practice to detect frailty (Hanlon et al., Reference Hanlon, Fauré, Corcoran, Butterly, Lewsey and McAllister2020). Also, we did not formally estimate sample size for this study. Post-hoc power analysis based on the results of correlations between the TFI-B and GS (r = -0.23) suggests that the study power was 0.67 with a beta error of 0.33 (Faul, Erdfelder, Lang, & Buchner, Reference Faul, Erdfelder, Lang and Buchner2007). Using this approach, our study may not have been sufficiently powered. Others have suggested that a minimum of 50 participants are recommended for a measurement study design (Terwee et al., Reference Terwee, Bot, de Boer, van der Windt, Knol and Dekker2007), and the number of participants in this study exceeded this benchmark. Considering this, one possibility is that the TFI-B does not capture traits of frailty assessed by the FFP, whereas the other possibility is that the TFI-B does capture these physical aspects of frailty but that the study was underpowered to establish these relationships. This preliminary study examined whether the TFI-B can be used for screening for frailty in older adults, and further research with larger sample sizes is indicated to provide stronger support for changes in clinical practice. To conclusively define the utility of the TFI-B in population screening, longitudinal cohort studies are needed. We also acknowledge the limitation that we did not adjust the alpha error while conducting multiple tests such as independent sample t tests to assess known-group validity as well as logistic regression to examine the relationships between the TFI-B scores and being classified frail according to FFP. Lastly, the data analyzed in this study were obtained by at least three separate research fellows whose inter-rater reliability in assessing GS and HGS were not established. To minimize the measurement error that may result from multiple examiners using different techniques for administering measures, each examiner underwent standardized training provided by the lead author (S.P.M) who designed the study protocol. This ensured measures were administered using the same techniques irrespective of the examiner.
Conclusion
In summary, the results of this study confirm that the TFI-B has only partial domain overlap (physical domain) with Fried’s phenotype in determining frailty in older adults. The results provide further support to the previously established cut-off score of ≥ 5 for the TFI-B as being indicative of frailty. The novel finding of this study is that it recommends the TFI-B as a screening tool rather than a diagnostic tool in determining frailty, given its high NPV. Future research should further validate this benchmark as well as the high NPV for the TFI-B scores in different geographic as well as in different clinical contexts.
Competing interest
Institutional Review Board (IRB) approval was obtained for this study from the Marshall University IRB. The authors declared no potential conflicts of interest with respect to the research, authorship, and/or publication of this article.


 Open access