


Introduction
Rice productivity in Latin America has shown a considerable increase over recent decades. However, these productivity gains have not been homogeneous across the rice-producing countries in the region. As of 2018, countries such as Argentina, Paraguay, Peru, and Uruguay, and Brazil's southern region, had achieved rice yields between 6.3 and 8.5 t/ha, whereas countries such as Bolivia and Panama remained at production rates below 4 t/ha. In Bolivia, rice production is an essential source of farmers' income and a critical factor in achieving food security (Calpe Reference Calpe2006). Yet, this country has had the lowest historical yield and second-lowest productivity growth in the region (FAOSTAT 2020).
The economic literature has highlighted the role of agricultural technology adoption in increasing farm productivity and has identified various factors that explain the adoption of different technologies (Feder, Just, and Zilberman Reference Feder, Just and Zilberman1985; Foster and Rosenzweig Reference Foster and Rosenzweig2010). Most studies so far have concentrated on explaining successful technology adoption processes but less on explaining why technology adoption has not successfully reached a larger target population and, therefore, has not translated into considerable yield increases. While many technologies have been promoted in the rice sector of Bolivia and other countries with low rice productivity, few studies have analyzed the factors that may explain the unsuccessful adoption of agricultural technologies.
Studies on the adoption of agricultural technologies have somewhat focused on improved crop varieties. Furthermore, despite the recognized complementarity of improved varieties and other enhanced agronomic practices, most studies have mainly examined separately the decision to adopt agronomic practices from the selection of improved varieties. However, a growing body of the agricultural economics literature has recognized the importance of modeling jointly different decisions in the agricultural technology adoption process to account for potential correlation in alternative adoption decisions (Wu and Babcock Reference Wu and Babcock1998). Teklewold, Kassie, and Shiferaw (Reference Teklewold, Kassie and Shiferaw2013) modeled the adoption of sustainable agricultural practices among Ethiopian maize farmers as a joint process while also incorporating the extent of such adoption into the analysis—measured as the number of practices implemented by farm households (following Wollni, Lee, and Thies (Reference Wollni, Lee and Thies2010)). The authors show that the complementariness and substitutability of agricultural practices are worth analyzing to better understand the drivers of adoption and overall uptake. Building on Teklewold, Kassie, and Shiferaw (Reference Teklewold, Kassie and Shiferaw2013), other studies have further provided evidence on the suitability of model joint decisions about adopting agronomic practices and improved crop varieties in China (Zeng et al. Reference Zeng, Tian, He and Zhang2020), Ethiopia (Yirga, Atnafe, and AwHassan Reference Yirga, Atnafe and AwHassan2015; Gebremariam and Tesfaye Reference Gebremariam and Tesfaye2018), Ghana (Donkoh, Azumah, and Awuni Reference Donkoh, Azumah and Awuni2019), India (Aryal et al. Reference Aryal, Rahut, Maharjan and Erenstein2018), Kenya (Wainaina, Tongruksawattanab, and Qaima Reference Wainaina, Tongruksawattanab and Qaima2016; Kanyenji et al. Reference Kanyenji, Oluoch-Kosura, Onyango and Ng'ang’a2020), Malawi (Ward et al. Reference Ward, Bellb, Droppelmannc and Bentond2018), Nigeria (Oladimeji et al. Reference Oladimeji, Oyinbo, Hassan and Yusuf2020), Tanzania (Kassie et al. Reference Kassie, Jaleta, Shiferaw, Mmbando and Mekuria2013), and the Chinyanja Triangle (Mponella, Kassie, and Tamene Reference Mponella, Kassie and Tamene2018).
This article studies how rice growers in Bolivia make decisions about adopting different agricultural technologies, namely, modern improved varieties (MIVs), mechanization, inorganic fertilization, pesticides, and herbicides. We allow these decisions to be pair-wise correlated and test for the existence of any underlying complementarity. Moreover, the extent of adoption is also modeled as an ordered response, further analyzing how technology adoption factors affect their overall uptake. Using a nationally representative sample of rice growers collected during 2014, the article (a) tests the suitability of using a multivariate model approach for studying the factors that affect the adoption of rice technologies in Bolivia, (b) models the drivers on the extent of adoption of these technologies, and (c) derives policy implications and recommendations to better disseminate the rice technologies that would enhance the rice sector. Our results build upon previous findings by providing valuable insights for the Latin America and the Caribbean region. These kinds of analyses are virtually absent in LAC, as most studies with similar approaches highly concentrate on African cases.
Our research findings provide evidence of a significant joint correlation between the different agricultural technologies disseminated in Bolivia's rice sector. Likewise, evidence suggests that distance to technological diffusion centers, participation in producers' organizations, and access to extension services significantly affect the probability of adopting these technologies. We also argue that, to better target resource-poor farmers, there is a need to improve mechanisms to diffuse information on agricultural practices and promote better use of existing farmers' organizations to boost rice technology adoption and improve the overall conditions of rice-producing households in the country.
The article proceeds as follows: section two provides an overview of the Bolivian rice sector, while section three describes the data and empirical strategy used in the analysis. The final two sections, respectively, discuss the main results and summarize the conclusions and policy recommendations.
Background: an overview of the Bolivian rice sector
Rice is the third most consumed food in Bolivia (GRiSP 2013). It constitutes a primary source of dietary nutrients for its population and has become one of the major income-generating crops in its agricultural sector. However, the country has had considerably low historical yields compared with neighboring countries (Table 1), which has had implications for both consumers' and rice farming households' welfare. In countries such as Bolivia, Peru, and Ecuador, the rice-producing area is concentrated among farms with less than 10 hectares (ha). By 2007, Bolivia had 43,456 rice-growing households, for a total area of 179,162 ha (Ortiz and Soliz Reference Ortiz and Soliz2007). Only a small proportion of rice growers (1,157) had irrigation systems on a total area of 18,000 ha. Most Bolivian rice production is under rainfed conditions. As expected, average yields differ significantly between rainfed and irrigated systems. On average, farmers in rainfed rice production reach 2 t/ha, while a limited number of farmers using irrigation in their rice production reach more than 6 t/ha (Ortiz and Soliz Reference Ortiz and Soliz2007).
Table 1. Rice (paddy) yield metrics for Latin America and the Caribbean, 1960–2018

a The annual growth rates are calculated from the linear regression of log-yields over the years, i.e., this is 100*β, where β is coefficient from the linear regression log-(yield) = α + β*(year).
b This is the simple average of yields for each country for the period 1960–2018, or for the specific years 2014 and 2018.
Source: Elaborated by the authors based on FAOSTAT (2020).
Bolivian rice growers, and the broader agricultural sector, have faced adverse local market fluctuations and production challenges associated with a changing climate during the past few decades (Amemiya Reference Amemiya2001; Andersen and Verner Reference Andersen and Verner2009; Winters Reference Winters2012). Under this situation, and considering the role of rainfed production in the rice sector, access to appropriate crop technologies such as improved rice varieties has become more relevant, especially for small- and medium-scale farmers. Therefore, we focus our analysis on these two groups of rice growers. If engaged in adopting new technologies, they may have better chances to increase their rice productivity and, through higher yields and output quality, potentially have higher income and better livelihoods.
Farm-gate real prices for rice have steadily decreased during the last three decades in Bolivia and the main rice-producing countries in Latin America. Although this trend translates into cheaper food in urban areas, the decline in rice growers' prices has been higher in Bolivia. This has implied harsher conditions for small- and medium-scale farmers, namely those who have failed to decrease their production costs to a significant scale (i.e., low yields and declining prices have affected rice growers' expected returns). Therefore, there are incentives for these groups of farmers to adopt new technologies for improving food security and productivity in Bolivia (Salazar et al. Reference Salazar, Aramburu, Gonzalez-Flores and Enters2015). However, at the same time, low crop profitability may discourage these farmers from investing in these technologies. This article seeks to answer this empirical question.
Research on agricultural technologies in Bolivia is limited due to the low priority of the farming sector and Bolivian governments' preference to support tin mining. Thus, agriculture has been encouraged only in valleys because of the natural constraints faced in other areas such as the highlands and tropical regions (Godoy, Morduch, and Bravo Reference Godoy, Morduch and Bravo1998). In recent decades, however, interest has increased in agriculture and in further developing and promoting the use of improved technologies (Ortiz and Soliz Reference Ortiz and Soliz2007). Rice is not a native crop to Latin America; farmers have only dealt with improved cultivars, ruling out the use of landraces or local varieties. However, Bolivian farmers have access to old and MIVs, introduced or officially released in the country at different times (Ortiz and Soliz Reference Ortiz and Soliz2007; Labarta et al. Reference Labarta, Buriticá, Lopera, González, Del Río, Pérez and Andrade2014). The dissemination of other rice technologies has also been spread out over different periods.
Latin America had not been part of the Green Revolution until the 1980s, when more international agricultural research centers were established worldwide (Dalrymple Reference Dalrymple1986). By 1983, Brazil, Colombia, Peru, Venezuela, and Cuba had become the region's largest rice-growing countries. At that time, little was known about high-yielding rice varieties (HYVs) in Bolivia. Still, a rough estimated area on HYVs reported approximately 29,600 ha, mainly in upland and rainfed production systems. Besides this, the use of other agricultural inputs in rice production in the 1970s was reported to be limited (Dalrymple Reference Dalrymple1979).
By 1990, genetic resources for rice improvement in Bolivia had been virtually nonexistent (Taboada et al. Reference Taboada, Guzman, Viruez, Kon and Guimarães2005), and the production of this cereal had relied primarily on old varieties such as “Bluebonnet 50,” introduced from the United States (Nguyen and Tran Reference Nguyen and Tran2002). In 1997, the Centro de Investigación Agrícola Tropical, in the Santa Cruz region, started a rice genetic improvement program aimed at developing varieties better adapted to local soil conditions and rainfed production systems (Taboada et al. Reference Taboada, Guzman, Viruez, Kon and Guimarães2005). After ten years of work, they released the first two varieties developed for Bolivia. On the one hand, biofortified variety “Azucena” was made available to local farmers (HarvestPlus 2009) and, on the other hand, a collaboration with the Latin American Fund for Irrigated Rice (FLAR) developed variety “MAC 18.” Six years later, two other varieties (SACIA FL-39 and SACIA FL-40) were released, thus increasing the number of modern improved rice varieties in the system, suitable for either manual, mechanized, or irrigated systems.
Finally, a key element to further understand Bolivia's rice production and technology adoption is Japanese-descendant farmers' historical role. Since the first wave of Japanese immigration into Bolivia during World War II, their influence over the Bolivian agricultural sector has been significant. Japanese-descendant farmers have led both in crop specialization and in the introduction of modern technologies in rice, soybean, and wheat in their settling-in areas. Two of the initial Japanese settlements (Okinawa and San Juan de Yapacaní) have become major technology dissemination points and crop commercialization centers in the Bolivian rice sector (Amemiya Reference Amemiya2001). Thus, rice producers in the country could have benefited from being exposed to the Japanese-descendant centers that implemented and developed best crop production practices.
Materials and methods
Data
The data used for the analysis are a nationally representative sample of rice growers collected during 2014 by the International Center for Tropical Agriculture (CIAT) in collaboration with the Centro de Investigación Agrícola Tropical of Santa Cruz, Bolivia, across the three rice-producing regions in the country. The sampling design followed a multistage procedure distributed among 98 communities, consisting of 802 small- and medium-scale farmer households that provided the complete information required under the proposed model.
Dependent variables
As mentioned earlier, rice is not a native crop of Latin America, and all varieties grown by rice growers in Bolivia are genetically improved. However, the modern varieties released since 2004 currently occupy 45.6 percent of the total rice area. The other 54.4 percent of Bolivia's rice area uses old varieties mainly introduced from other countries before the foundation of the national rice breeding program. The rate of adoption of the different MIVs is shown in Table 2. Two MIVs dominate the preference of Bolivian rice growers: MAC 18, which resulted from the collaboration of the Bolivian rice program and FLAR, and IAC 101, which was bred by the rice breeding program of the State of São Paulo (Brazil), selected, and then released in Bolivia. These two varieties have adapted well to both irrigated and favored rainfed conditions in Bolivia. MAC 18 also offers a slightly higher quality of its grain, which is appreciated in the market. Despite being available to farmers for some time and expected to significantly improve productivity either in input-intensive (and mechanized) or manual production systems (Châtel et al. Reference Châtel, Guimarâes, Ospina, Rodríguez, Lozano, Degiovani, Martínez and Motta2010), the rest of the modern varieties have not achieved a considerable rate of adoption. This is consistent with literature findings that productivity gains may not necessarily cover the additional costs from adopting new crop varieties, hence limiting their appeal to most farmers (Pretty, Ruben, and Thrupp Reference Pretty, Ruben, Thrupp and Uphoff2002). Besides, materials that have long been used in local conditions are likely to be better adapted to their specific agroclimatic needs than their more recent competitors (Hoffman, Probst, and Christinck Reference Hoffman, Probst and Christinck2007).
Table 2. Adoptiona of modern improved rice varieties in Bolivia

a Farmers may adopt more than one rice variety; hence, the reported values of adoption do not add up to 100 percent.
Source: Elaborated by the authors based on survey data.
Although rainfed systems dominate rice production in Bolivia, large machinery for planting and harvesting is available to rice growers. The possibility of mechanization among rainfed rice growers refers to the concept of favored rainfed systems (Lynch and Tasch Reference Lynch and Tasch1981). Fertilization in rice production mainly relies on the use of mineral supplements with a range of combinations of nitrogen (N), phosphorus (P), and potassium (K). The most available fertilizer formulations in local markets offer N, P, and K concentrations ranging from 21 to 46 percent, 20 to 45 percent, and 50 to 60 percent, respectively (Viruez and Taboada Reference Viruez and Taboada2013). Chemical pest control is virtually a binary decision between products containing either cypermethrin or cyfluthrin to combat both the fall armyworm and Tibraca limbativentris. In contrast, most weed controls (herbicides) are made of bispyribac-sodium, imazapyr, imazapic, and penoxsulam.
We expect that rice growers in Bolivia have up to five technologies available that may increase their rice productivity compared with traditional rice practices, but this may also imply some degree of complementarity. These technologies, the adoption of MIVs, machinery used at seeding or harvesting, and the use of fertilizers, chemical pesticides, and herbicides on rice plots, constitute the dependent variables of our model. Our definition of “modern” improved variety considers varieties released in Bolivia since 2004 (eight years after establishing the rice improvement program). These are up to 12 modern materials, including MAC 18, IAC 101, Azucena, SACIA FL-39, and SACIA FL-40. Other varieties, including Bluebonnet, are considered old types. Although these technologies could be expected as (nearly) perfect complements from an agronomic perspective, the observed extent of adoption (Figure 1) suggests that farms make only a partial adoption of such practices. Such a pattern is understandable for resource-limited households, whose decisions on production and consumption are highly interdependent. The latter follows the concept of nonseparability of decisions of agricultural households (Bardhan and Udry Reference Bardhan and Udry1999). It is reasonable for these farms to adopt a part of an improvement package to gain at least a part of the potential benefits from adoption. Households may possess attributes that should be explored to understand better who are more likely to adopt each technology of interest. Also, it is worth noting that although these technologies may be labeled as input-intensive, they are not necessarily incompatible with future efforts in expanding the uptake of sustainable practices (Wainaina, Tongruksawattanab, and Qaima Reference Wainaina, Tongruksawattanab and Qaima2016).

Figure 1. Number of Technologies Adopted by Interviewed Bolivian Rice Farmers. Source: Elaborated by the authors based on survey data.
Econometric approach
In this study, we consider a farmer household deciding whether or not to adopt a given technology. With no loss of generality, suppose that if household i chooses to adopt the m th technology, it reaches a utility of $V_{im}^1$ , while it would reach a utility of $V_{im}^0$
 otherwise. Therefore, they adopt the technology if and only if

where the ɛim terms are unobservable shocks to the farmer utility for each m technology, and x i are observed attributes of the household. Households are to choose whether to adopt each of the m = 1, 2, …, M nonexclusive technologies. While we do not observe $A_{im}^\ast$ or $V_{im}^h$
 , we do observe the adoption decision of each household as an index function, where $A_{im} = 1( A_{im}^\ast > 0)$
 . Relaxing the assumption that the unobservable shocks are independent, and assuming that they are jointly and normally distributed, leads to the multivariate Probit (MVP) regression model (Cameron and Trivedi Reference Cameron and Trivedi2005; Greene Reference Greene2012), where

Let us model the joint probability of adoption for M technologies as

where ϕM is the standardized multivariate normal probability density function, and Σ is the symmetric covariance matrix of the error vector ɛ, in which Σmn = 1 if m = n, and Σmn = ρmn = ρnm when m ≠ n. Estimating the M-dimensional normal integrals is feasible by the Geweke, Hajivassiliou, and Keane (GHK) simulated-likelihood approach (Boersch-Supan and Hajivassiliou Reference Boersch-Supan and Hajivassiliou1990; Cameron and Trivedi Reference Cameron and Trivedi2005; Greene Reference Greene2012). The decision to model adoption at the household levelFootnote 1 follows that 95 percent of the interviewed households managed a single plot. Barely over 1 percent managed three or more plots. Thus, a household-level analysis does not conflict with similar studies as those of Donkoh, Azumah, and Awuni (Reference Donkoh, Azumah and Awuni2019), Gebremariam and Tesfaye (Reference Gebremariam and Tesfaye2018), and Zeng et al. (Reference Zeng, Tian, He and Zhang2020).
In addition to this, we model the extent of adoption as the number of technologies effectively implemented by the household (Wollni, Lee and Thies Reference Wollni, Lee and Thies2010), setting up an ordered Probit regression model that also resembles a random utility model. Here, farm household i decides to adopt a total of c i technologies (c i = 0, 1, 2, 3, 4, 5) based on the utility
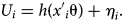
Although utility cannot be observed, as in the MVP setting, we observe the number of adopted technologies. We assume that a household adopts an additional technology if the utility of using it exceeds the utility of not adopting it. Moreover, the decision of extent of adopted technologies responds to utility levels defined across thresholds λ such that


Finally, if η follows a normal distribution, then


The sign of θ coefficients in the ordered Probit model indicates the aggregate direction that covariates have in the number of technologies adopted by the household, i.e., whether the explanatory variable increases (decreases) the value of our latent variable U (Cameron and Trivedi Reference Cameron and Trivedi2005). Nonetheless, marginal effects do not necessarily hold the same sign, as covariates may imply more (or less) likelihood of a point outcome.
Explanatory variables and descriptive statistics
Covariates used in this article (Table 3) are consistent with previous adoption studies on rice technologies and follow the underlying theoretical economic models that propose them (Saka et al. Reference Saka, Okoruwa, Lawal and Ajijola2005; Usman, Ango, and Barau Reference Usman, Ango and Barau2013; Yamano et al. Reference Yamano, Arouna, Labarta, Huelgas and Mohanty2016). We have included producers' associations and access to extension services to represent households' access to agricultural information. The model also includes variables related to human capital and income characteristics (of the household head) to control for differences in the dynamics followed toward the adoption decision. Geographic control of distance (in log-Geodesic scale) to San Juan de Yapacaní, one of the leading centers of rice technological diffusion, attempts to account for the level of exposure to the dissemination of rice technologies. Also, we use the farm's size as a proxy for its wealth endowment across all the decisions modeled, while yield priority represents households' varietal preference for higher-yielding varieties. Finally, we included department-fixed effects to account for the differences in labor availability and access to markets, since evidence suggests that changes in these attributes may increase the opportunity cost of technologies, making them less attractive or even nonaffordable (White, Labarta, and Leguía Reference White, Labarta and Leguía2005). Santa Cruz has the most extensive availability in both labor and markets; thus, we choose it as the base category in both regression analyses.
Table 3. Description of variables

Source: Elaborated by the authors.
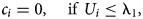
Descriptive statistics of all the explanatory variables used in the analysis are summarized in Table 4, which compares average values between adopters and nonadopters of the five complementary technologies used in rice production. The distribution of adoption is somehow dissimilar across the different technological options. While roughly 65 percent of the rice growers use pesticide and weed controls, we found adoption levels of MIVs and machinery slightly under 50 percent of the interviewed households. On the other hand, fertilizer use is the lowest adopted rice technology (25 percent). Among adopters, the household heads tend to be slightly more educated and younger than nonadopters and, although female-headed households are unusual, they are marginally fewer among adopters. Households adopting the rice technologies have, on average, more alternative employment options and larger farm sizes. Adopters of technologies seem to have more access to agricultural extension and farmers' organizations. Statistical differences are significant between adopters and nonadopters, particularly for the household head level of education, farm size, belonging to a farmers' association, access to extension services, and the distance to the main technology diffusion center (San Juan de Yapacaní). Notice how the difference of average distance to diffusion centers can be a scale factor of two when comparing adopters and nonadopters. In any case, relying on alternative income sources is an evenly distributed condition between adopters and nonadopters. On the other hand, having a female household head reports only a statistical difference when comparing adopters and nonadopters of herbicides.
Table 4. Descriptive statistics
1 Yield priority is disaggregated only for MIVs, following the rationale in Table 2.
aNonadopters, badopters, and creporting means and percentages for continuous and binary variables, respectively.
Reporting significance of variable's mean difference between adopters and nonadopters of each technology: ***p < 0.01, **p < 0.05, *p < 0.1.
Source: Elaborated by the authors based on survey data.
Results
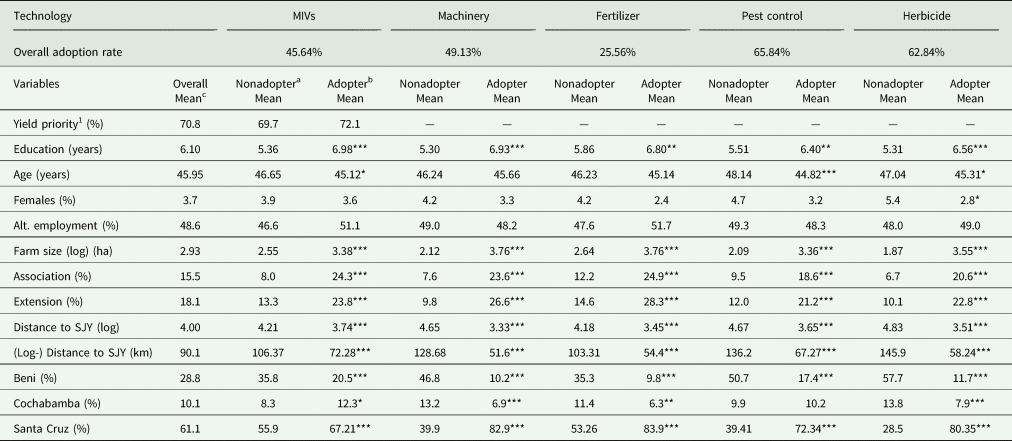
Checking the sample unconditional and conditional probabilities of technology adoption (Table 5), it is clear that there exists a strong complementarity among these five practices. As an example, consider the unconditional probabilities of mechanization (50.8 percent), fertilization (25.3 percent), use of pesticides (65.4 percent), and herbicides (62.8 percent), that rapidly increase by 19.4, 11.3, 9.6, and 13.2 percent points, respectively, given once the household adopts modern improved rice varieties. The single condition that appears most increase other probabilities of adoption is inorganic fertilizers, which raises the likelihood of using MIV to 65 percent, machinery to 87.4 percent, and both pesticide and herbicides to a solid 97.2 percent. Another interpretation is that farms that use fertilization (less recurrent practice) are more likely to be those who have already implemented other technologies, hence use this final technology to exploit their productive capabilities further. Notice how the probability of adoption of other technologies systematically increases (sometimes over 95 percent) in any combination of conditions that have fertilization as given. Also, the systematic increase in the probability of adopting MIVs given the presence of a mechanized system (20 percent point) may suggest that modern varieties are more common among farm households with higher initial endowments mechanization intensive. In general, without further controls, these agricultural practices give a signal of being strongly, but not perfectly, correlated.
Table 5. Sample unconditional and conditional probabilities of technology adoption
Y V, Y M, Y F, Y P, and Y H are index variables for the adoption status (1 = yes) for modern improved varieties, machinery, fertilization, pest control, and herbicides, respectively.
***p < 0.01, **p < 0.05, *p < 0.1, compared with the unconditional probability of adopting the technology.
Source: Elaborated by the authors based on survey data.
Our econometric analysis provides evidence that the decisions to adopt complementary technologies in rice production in Bolivia are correlated, justifying the use of an MVP model to understand the factors that explain these decisions. Table 6 presents the partial correlations across all technologies included in the analysis and the joint significance test, suggesting that the individual adoption of rice technologies is affected by the other complementary technologies' decisions. Not controlling for the correlation between individual adoption decisions and their unobservables would bias the covariates' coefficient estimation. When estimating separate Probit models for each technology,Footnote 2 we find coefficients that are slightly larger in absolute value and more likely to be statistically significant. Thus, assuming independent normal distributions for the errors rather than a joint distribution may mean a potential distortion in the magnitude of the detected partial correlations and an augmented probability of incurring in type I error when defining the adoption determinants.
Table 6. Multivariate Probit correlation results

Joint significance LR test: chi2(10) = 379.43, p-value = 0.00.
Robust standard errors in parentheses. ***p < 0.01, **p < 0.05, *p < 0.1.
Note: ρij defines the correlation between technologies i and j, with values meaning (1) MIVs, (2) machinery, (3) fertilizer, (4) pesticide, and (5) herbicide.
Source: Elaborated by the authors based on survey data.
After controlling for the verified multivariate correlation of the decisions to adopt complementary rice technologies and regional (department-level) fixed effects, we present the results of the determinants of joint adoption in Table 7. We found that farm size is the only explanatory variable that can explain the adoption of all the technologies considered in the analysis. The greater the farm size, the higher the likelihood of Bolivian rice growers adopting the available rice technologies. This finding is consistent with other studies implemented in Latin America's rice sector (Suarez Reference Suarez2014; Marin et al. Reference Marin, Andrade, Labarta and Twyman2018) and further studies on agricultural technology adoption more broadly in different regions (Walker and Alwang Reference Walker and Alwang2015; Yamano et al. Reference Yamano, Arouna, Labarta, Huelgas and Mohanty2016). A plausible explanation of this result is that larger farmers tend to have better conditions and more resources to cope with the risks of incorporating new technology in their current crop management. In Bolivia, it has been reported that farmers with better socioeconomic conditions are more likely to have better practices in their agricultural systems (Ortiz and Soliz Reference Ortiz and Soliz2007; Salazar et al. Reference Salazar, Aramburu, Gonzalez-Flores and Enters2015).
Table 7. Multivariate Probit regression results on technology adoption
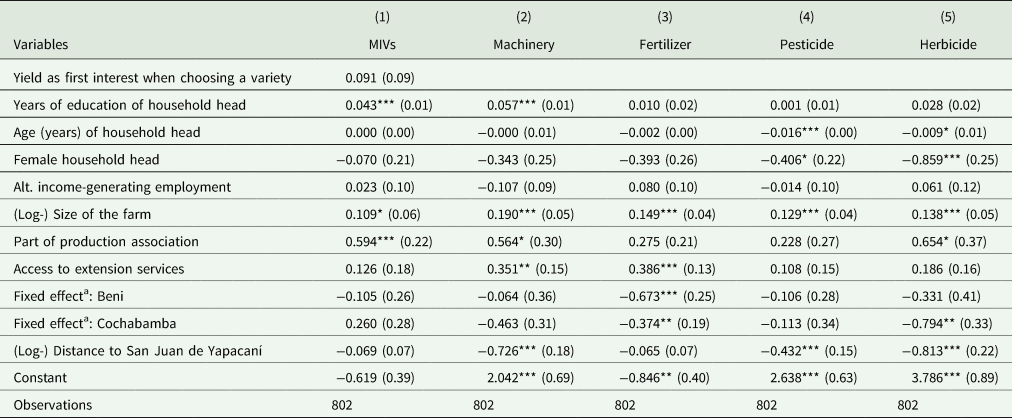
a Base category is Santa Cruz.
Robust standard errors in parentheses. ***p < 0.01, **p < 0.05, *p < 0.1.
Source: Elaborated by the authors based on survey data.
Two other factors were relevant in explaining farmers' decisions to adopt three out of the five rice technologies. Being part of a farmer association significantly increases the probability of adopting MIVs, machinery, and herbicides. This finding can be explained by the fact that most programs delivering agricultural inputs in Bolivia use existing organizations for reaching and distribution purposes. Likewise, having access to agricultural extension services was found to increase the probability of adopting machinery and fertilizer. Although extension services have had limited coverage in Bolivia, both public and NGO extension programs have tried to meet local farmers' demands and make available these agricultural technologies (FAO 2011). This has been a strong argument for organizations such as the Centro de Investigación Agrícola Tropical in designing new strategies to overcome current restrictions on farmers in specific regions to access known rice technologies.
As expected, we found a negative relationship between distance to the main center of rice technological dissemination in San Juan de Yapacaní and the probability of adopting rice technologies; however, we found significant effects only on adopting machinery, pesticides, and herbicides. This hypothesis, first developed by Amemiya (Reference Amemiya2001), has been largely confirmed in the literature. Furthermore, Taboada et al. (Reference Taboada, Guzman, Viruez, Kon and Guimarães2005) has highlighted the relevance of the Japanese-Bolivian dissemination centers for Bolivia's rice production. For the case of adopting MIVs and fertilizer, it could be argued that these specialized technologies may show asymmetries due to geographic limitations. The latter could be because those farm households near Japanese-Bolivian farmers observe the technological measures taken by those farmers, which include relatively high-cost inputs such as machinery and chemical pesticides and herbicides.
Nonetheless, recent studies among rural communities in Bolivia show that information technology may substantially enhance rural livelihoods (Gigler Reference Gigler2015) by helping traditionally marginalized communities make better-informed decisions. However, such impacts may heavily rely on strong intermediate actors (in our case, extension services and associations), who can further help farmers assimilate technical information and recommendations provided by research entities. Despite such findings, increasing availability of information technologies in remote areas means a need for future studies with updated data that test whether the effect of proximity to dissemination centers still holds.
Other factors that showed significant effects on rice technologies’ adoption decisions are the household head's age, education level, and gender. An additional year in the household head's education significantly affects the probability of adopting MIVs and machinery. Likewise, we found that older farm households and female-headed households are less likely to adopt chemical pest and weed controls. These findings are consistent with previous results reported in rice in Africa (Saka et al. Reference Saka, Okoruwa, Lawal and Ajijola2005; Usman, Ango, and Barau Reference Usman, Ango and Barau2013) and Latin America (Suarez Reference Suarez2014), as well as for other crops and practices in developing countries (Kassie et al. Reference Kassie, Jaleta, Shiferaw, Mmbando and Mekuria2013; Teklewold, Kassie, and Shiferaw Reference Teklewold, Kassie and Shiferaw2013; Manda et al. Reference Manda, Alene, Gardebroek, Kassie and Tembo2016; Gebremariam and Tesfaye, Reference Gebremariam and Tesfaye2018; Kanyenji et al. Reference Kanyenji, Oluoch-Kosura, Onyango and Ng'ang’a2020).
We summarize the results from the ordered Probit model of the number of technologies adopted by Bolivian rice farmers in Table 8. One of the first striking results is the systematic change of sign for all marginal effects when crossing the barrier of two or fewer technologies to three or more technologies. On average, farms whose household heads are more educated are slightly over 1 percent more likely to adopt three or more technologies. Also, larger farms (i.e., related to higher financial endowments) are about 8 percent more likely to adopt more technologies. Also, farming households who are part of a production association or have access to extension services are 20 and 12 percent more likely, respectively, to be among those with higher levels of adoption.
Table 8. Ordered Probit regression and marginal effects on the number of adopted technologies

a Base category is Santa Cruz.
Joint significance LR test: chi2(10) = 394.33, p-value = 0.00.
Robust standard errors in parentheses. ***p < 0.01, **p < 0.05, *p < 0.1.
Source: Elaborated by the authors based on survey data.
On the other hand, farms that are farther away from the national dissemination center are around 8 percent more likely to adopt two or fewer technologies. Furthermore, households located in Beni and Cochabamba will have about 23 and 13 percent more probability, respectively, to find themselves in the lower range of technology adoption. Also, farms whose household head is female are 17 percent less likely to reach upper adoption levels. Off-farm means of income seem to have no effect on farmers being either in the upper or lower adoption levels. The only apparent inconsistent result is the null effect of the household head's age, but this may be a consequence of the small (although significant) correlation it holds with only two technologies, namely pesticides and herbicides. These additional findings corroborate the determinants highlighted in the multivariate model and extend them to the total amount of adoption.
Conclusions
Despite the importance of rice in Bolivia, this cereal crop production remains constrained and shows low yields. Our results show that Bolivian rice growers have adopted most of the five agricultural technologies studied (MIVs, machinery, fertilizer, pesticide, and herbicide), although at different rates. However, this adoption has not translated into higher rice yields that better position Bolivia's productivity among other LAC countries. Our results reveal strong complementarities among rice-producing technologies in Bolivia, which must be considered when exploring their adoption determinants. This further reinforces previous findings that highlight the caveats of assuming independent decisions on productive technologies adoption—it may result in biased estimates and increased likelihood of type I error at identifying specific determinants of adoption.
Modern varieties have reached a rate of adoption of 45.6 percent, which is a good outcome for the nascent rice breeding program in the country. The materials MAC 18 and IAC 101 are the most used ones because of their productivity and good grain quality. Yet again, the adoption of these varieties seems to have not influenced rice productivity. This could be associated with the relatively low use of fertilizer (25 percent), traditionally referred to as a perfect complement of improved varieties. Although MIVs are suitable for manual and mechanized systems, their adoption appears to be more concentrated among mechanized systems. Hence, the potential for improvement for the overall rice productive system in Bolivia may have not yet been reached.
Our analysis particularly highlights the critical role of belonging to a farmer organization, having access to agricultural extension, and proximity to San Juan de Yapacaní (the main technological dissemination area for rice in Bolivia), in increasing the likelihood of adopting improved technologies in rice production. These determinants hold not only for the adoption decision of each technology but also for the extent of adoption of these technologies among Bolivian rice farmers. Farms located in areas with higher availability of labor and large markets (namely, the Department of Santa Cruz) are more likely to adopt a larger number of technologies.
Therefore, the weakness of the national extension system can also explain part of the low rice yields despite the documented adoption of rice technologies. Our results also support strategies that try to build technology dissemination efforts on the country's existing strengths. Bolivia is a country that has traditionally relied on local farmer organizations, and these should continue to be a critical mechanism for further technology dissemination. Likewise, government policy should further promote and expand the use of existing technology diffusion centers such as San Juan de Yapacaní. This has proven to be an efficient farmer-to-farmer knowledge dissemination mechanism, especially among small and medium rice growers for whom low rice yields are concentrated. Finally, this study also provides evidence that technology adoption in developing countries seems biased toward larger farmers, who respond better to using existing improved technologies. Governments and donors should concentrate efforts on identifying strategies to target resource-poor farmers better, so they can gain access to improved technologies, which may result in an overall increase in rice productivity and livelihood conditions.
Supplementary material
The supplementary material for this article can be found at https://doi.org/10.1017/age.2021.9.
Acknowledgments
We want to thank Victor Zuluaga, Alexander Buriticá, Javier Castro, and the 8th Bolivian Conference of Development Economics participants for the comments provided to earlier versions of the manuscript. Also, we thank the comments and suggestions from two anonymous referees and the Editor, Dr. Richard Melstrom, which greatly benefited the article.
Funding statement
This study is a result of the project Adoption study of rice varieties in Bolivia led by the Alliance of Bioversity International and CIAT, made possible with support from the CGIAR Global Research Program on Rice and HarvestPlus. HarvestPlus' principal donors are the UK Government; the Bill & Melinda Gates Foundation; the US Government's Feed the Future initiative; Government of Canada; the European Commission; and donors to the CGIAR Research Program on Agriculture for Nutrition and Health (A4NH). HarvestPlus is also supported by the John D. and Catherine T. MacArthur Foundation.
Conflicts of interest
None.


 Open access