


The domestic cat (Felis silvestris catus), a strict carnivore, plays an important role in many people’s lives around the globe(1,2) . The companionship cats provide is reciprocated by care including the provision of nutritious dry extruded or wet retorted foods, often throughout their lives. Nutritional science has led to detailed insights in feline digestive physiology and metabolism as well as the physicochemical properties of ingredients and foods that underlie the pet food industry’s capacity to manufacture nutritious, high-quality and safe foods that support health and longevity of domestic cats(Reference Van Rooijen, Bosch and Van Der Poel3). This also includes nutritional concepts to promote gut health via prebiotic plant fibres that steer microbial populations and their fermentation products(Reference Rochus, Janssens and Hesta4,Reference Barry, Wojcicki and Middelbos5) . How we feed domestic cats, however, differs considerably from what cats consume in nature where they typically prey on small vertebrates including mice with little consumption of plant matter(Reference Plantinga, Bosch and Hendriks6). Though it is widely accepted that the evolution on such a diet has led to an array of metabolic adaptations in cats(Reference Morris7), the nutritional properties of nature-based diets as a food source for cats are largely understudied(Reference Vondruska8).
The nutritional properties of dry extruded cat food differ considerably from animal prey such as mice. Dry extruded pet foods are mainly composed of finely ground dry ingredients from plant and to a lesser extent animal origin that are cooked and shaped into a kibble which is coated to enhance palatability. The extrusion process increases the digestibility of the food(Reference Tran, Hendriks and van der Poel9) and lowers the amount of undigested fractions. Therefore, mainly plant fibres and undigested proteins reach the distal intestine where they are used by the microbial population(Reference Dagbasi, Lett and Murphy10). The composition of these fractions largely shapes the large intestinal microbial composition as well as the fermentation products. The gastrointestinal microbiome modulates metabolic and immune responses and is of great significance for intestinal and systemic health(Reference Rochus, Janssens and Hesta4,Reference Neish11) . It is able to generate various energy-containing metabolites from indigestible organic molecules such as SCFA(Reference Kaoutari, Armougom and Gordon12,Reference Tremaroli and Bäckhed13) . Proteolytic bacteria break down undigested proteinaceous material which are used either in proteolytic fermentation or generation of microbial cell components(Reference Neish11). This also renders branched-chain fatty acids (BCFA) and as well as the potentially harmful NH3, various amines, phenols and indoles(Reference Cummings and Macfarlane14). The presence of protein in the large intestine originates from undigested food, bacterial cells and endogenous losses(Reference Nyachoti, de Lange and McBride15). When cheetahs (Acinonyx jubatus), which are also strict carnivores, were fed a whole prey diet, a higher acetic to propionic acid ratio (A/P) was observed compared with cheetahs fed supplemented beef(Reference Depauw, Hesta and Whitehouse-Tedd16). This implied that the fermentation rate by intestinal microbiota was reduced as certain fractions such as hair, skin, cartilage and bone have a similar function as insoluble plant fibres(Reference Depauw, Hesta and Whitehouse-Tedd16,Reference Sunvold, Fahey and Merchen17) . The animal-derived plant fibre-like fractions have recently been termed ‘animal fibre’(Reference Depauw, Hesta and Whitehouse-Tedd16). The whole prey feeding also reduced BCFA, indole, phenol and serum indoxyl sulphate concentrations in the faeces of cheetahs(Reference Depauw, Hesta and Whitehouse-Tedd16). To what extent this effect is caused by the chemical or the physical nature of whole prey is unclear.
That metabolic disorders can occur due to a lack of diet structure, for instance in ruminants, is well established(Reference De Boever, Andries and De Brabander18). But in carnivore species, the importance of food structure is largely unknown(Reference De Cuyper, Hesta and Tibosch19). It was shown that the rate of gastric emptying in cats is affected by the physical nature of the food (wet v dry food)(Reference Goggin, Hoskinson and Butine20) and that adding 10 % insoluble fibre to the diet delays gastric emptying and colonic filling time in dogs(Reference Pedreira21). Also, the shape of the extruded kibble of commercial cat foods affects gastric emptying(Reference Armbrust, Hoskinson and Lora-Michiels22). When a cat eats a mouse, it is cut into relatively large pieces and swallowed without further size reduction as cats’ cheek teeth have no grinding function(Reference Orsini and Hennet23). Ingested prey pieces may require further size reduction by digestive and physical actions of the stomach before they can pass the pylorus and be subjected to further digestion in the small intestine. Animal fibre including resistant proteins escape enzymatic digestion(Reference Depauw, Hesta and Whitehouse-Tedd16). These fractions have different physicochemical properties and, therefore, are also expected to differently impact the microbial populations and fermentation product profiles. Moreover, the physical structure of ingested food may change the grinding and digestive processes, including gastric emptying, digestion and fermentation.
We hypothesised that when cats are fed a more structure-rich diet, gastric emptying will be delayed, leading to an altered flow of substrate for the large intestinal microbiota. Therefore, the present study investigated the separated effect of food structure on digestive features, faecal microbiota and their fermentation products in cats by feeding minced mice (MM) and whole mice (WM), also comparing the results to the effect of the preceding extruded diet.
Experimental methods
Animals and experimental design
Experimental procedures were approved by the Central Animal Testing Committee, The Netherlands, and the Animal Welfare Body of Wageningen University (2017.W-0073.003). Fifteen (seven males and eight females) neutered 1-year-old domestic shorthair cats with an initial body weight between 3·6 and 5·2 kg were utilised from the feline unit of the research facility Carus (Department of Animal Sciences, Wageningen University, Wageningen, The Netherlands). The body condition score ranged between 5 and 8 on a scale of 1 (anorexic) to 9 (obese)(Reference Laflamme24). The cats were group-housed but fed individually (08.00, 11.00, 14.00 and 17.00 h) to maintain stable body weight and were weighed twice weekly. During collection periods, cats were housed in metabolic cages (0·80 × 1·00 × 0·75 m) fitted with a litter tray, and each group had 2 × 1 h of socialisation and play per day in the hallway of the facility. The group rooms were temperature-controlled (20°C) and maintained on a 12:12 h light–dark cycle. Enrichment in group rooms included scratching posts, hammocks and toys. Cats had free access to water and were cared for daily by animal caretakers and the trial leader. The trial leader was aware of the group allocation during the conduct of the experiment, the outcome assessment and the data analysis.
The cats were offered one-quarter of a mouse at several time points before the actual start of the trial to test their acceptance. One cat did not accept the mouse and was, therefore, excluded from the study. Fifteen cats were assigned to two groups according to body weight and sex resulting in a mean body weight of 4·5 (sd 0·4) kg for the cats fed MM (n 8) and 4·4 (sd 0·7) kg for the cats fed WM (WM; n 7). All participating cats were first individually fed a commercial extruded dry cat food (EXT) for 16 d with faecal samples collected during the final 3 d for microbiota analysis and to create a baseline for faecal fermentative end-product concentrations (EXT preMM; EXT preWM). The study had a parallel design with one feeding period. After 10 d of feeding MM and WM, total faeces and urine were collected for 5 consecutive days (postMM; postWM). Afterwards, urine was collected on day 15 to determine baseline for 15N values as on day 16, 15N-glycine (50·0 mg/ml; 5·0 mg/kg BW)(Reference Russell, Lobley and Millward25) was included in the diets to gain insight into gastric emptying with urine collected for 48 h post 15N-glycine administration. Fresh faeces (within 15 min of defecation) for microbiota analyses were collected from day 16 to 19.
Diets
The extruded dry cat food was a commercial diet (Table 1). Specific pathogen-free mice, with an age range of 8 weeks to 12 months old, were obtained from Envigo (Envigo) and stored frozen until 30 min before feeding when they were thawed in a plastic bag in boiled water (water boiler) until they were defrosted. Mice were either minced in a blender or left whole receiving a midline incision to improve acceptability. The estimated metabolisable energy (ME) of mice was calculated using Atwater factors where ME (kJ/100 g DM) = 16·7 × crude protein (CP) + 35·6 × crude fat (EE) + 16·7 × nitrogen-free extract (NFE)(26) with the latter determined as 100 – moisture – CP – EE – crude fibre – crude ash (all in % of DM). Food intake and leftovers were weighed every feeding time. The amount of food offered to individual cats was adjusted when the cat gained or lost more than 1 % of body weight.
Table 1. Analysed chemical composition, amino acid composition and metabolisable energy content of the extruded dry cat food (EXT) and mice used in the experiment
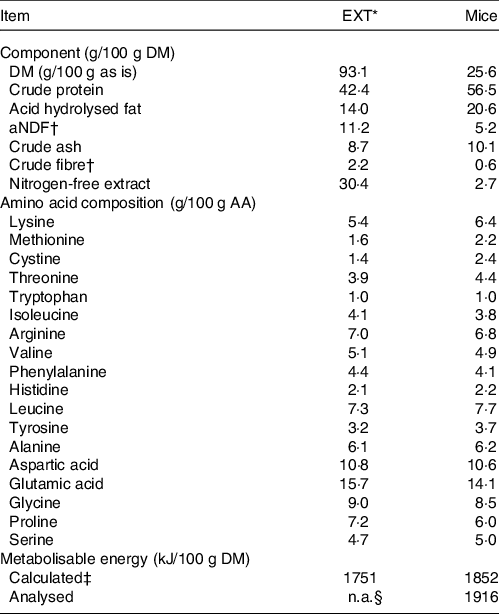
EXT, extruded dry cat food; aNDF, amylase-treated neutral detergent fibre; ME, metabolisable energy; NFE, nitrogen-free extract.
* Perfect fitTM adult 1+ rich in chicken (Mars Petcare Inc); ingredients: dried poultry protein (incl. 21 % chicken), wheat, greaves protein, soya protein, oils and fats (incl. 0,4 % sunflower oil), soya meal, rice (4 %), dried cereal protein, hydrolysed liver, minerals, cellulose, and dry algae.
† aNDF and crude fibre are techniques developed to quantify plant fibre, not animal fibre.
‡ The average of the values calculated by Atwater factors where ME (kJ/100 g DM) = 16·7 × % crude protein + 35·6 × % crude fat + 16·7 × % nitrogen-free extract. NFE was determined as 100 – % moisture – % crude protein – % crude fat – % crude fibre – % crude ash.
§ Not available.
Sample collection
The extruded dry cat food was subsampled, and sixteen defrosted mice were minced in a blender, freeze-dried (ScanVac CoolSafeTM freeze-dryer) and ground over a 1-mm mill (Retsch ZM 200). The cats were acclimated to modified plastic litter boxes consisting of two identical, close-fitted trays positioned to slightly sloping to one corner to ensure complete collection of faeces and urine. The top tray contained a series of small holes at the lowest point and was filled with about 200 g of polyethylene grains (diameter 2 to 4 mm). The bottom tray contained 5 ml of 2M HCl to acidify urine immediately after voiding. Specific gravity was determined by collecting a small amount of urine present in the top tray. The litter boxes were checked every 15 min, and urine was then collected and stored at −20°C. Afterwards, urine was freeze-dried for determining the gross energy (GE) and stable isotope analyses. For the latter, subsamples of approximately 1·0 mg were weighed on a microbalance XP56 (Mettler-Toledo S.A.) into 8 × 5 mm tin capsules (Interchrom).
Fresh faecal pH was immediately determined after collection by sticking a pH probe directly in the core of the faeces at two different sites (within 15 min of defecation; pH meter WTW 340i, Geotech). The faecal samples were weighed and scored on a five-point visual scale where 1 is classified as ‘bullet like’ and 5 as ‘entire liquid stool’(Reference Moxham27) and stored at −20°C. To subsample the faecal samples, they were placed overnight in a refrigerator (4°C). For NH3, SCFA and biogenic amines (BA), subsamples of approximately 1·0 g were added to pre-weighed 15 ml of screw cap tubes (Sarstedt AG & Co. KG). One ml of 10 % TCA (for NH3) or 1 ml of 0·1 M phosphoric acid (for SCFA) was added to the screw cap tubes. The contents of the tubes were vigorously mixed, weighed and stored at −20°C. For the determination of DM and the volatile organic compounds, approximately 1·0 g of subsample was added to a pre-weighed, 2-ml safe-lock tube (Eppendorf AG) and stored at −20°C (DM) or −80°C. Fresh faecal samples for microbiota analysis were immediately flash-frozen in liquid N2 and stored at −80°C until DNA extraction.
Chemical analyses
Diets and faeces were analysed for DM and ash by drying to a constant weight at 103°C (EXT) or by lyophilisation (mice and faeces) and combustion at 550°C, respectively. Nitrogen was determined by the Kjeldahl method(28) with CP calculated as N × 6·25, and crude fat was determined by pre-hydrolysis according to the Soxhlet method(29). Crude fibre was analysed by acid-alkali digestion(30). A protease step (Megazyme; Subtilisin A from Bacillus licheniformis; 50 mg/ml) preceded the analyses of amylase-treated neutral detergent fibre (aNDF)(31) because of samples having a high protein content. Both fibre analyses are developed to quantify plant fibre. Therefore, an underrepresentation of animal fibre is expected with these techniques(Reference D’Hooghe, Cools and Muñoz Saravia32). Analysis of amino acids of the diets (Table 1) was done by Feed & Food Quality (FFQ) with their in-house method based on EC 152/2009 (L54/23) for the oxidation and hydrolysis. The ultra-HPLC was according to the Waters ACCQ-tag method with pre-column derivatisation. Tryptophan was determined according to EC 152/2009 (L54/32). Dietary, faecal and urinary GE were determined using a Flash 2000 Elemental Analyzer (Thermo Fisher Scientific).
The δ15N isotope values were measured at the University of New Mexico Center for Stable Isotopes (Albuquerque, USA). The samples were combusted in a Costech 4010 elemental analyser (Costech) coupled to a Thermo Scientific Delta V mass spectrometer (Thermo Scientific). Reference material was atmospheric N2 for N.
For the determination of NH3 and SCFA, the subsamples were thawed, mixed and centrifuged at 14 000 rpm for 5 min at room temperature (Centrifuge Hereaus Megafuge 40R). Ammonia and SCFA concentrations were determined as described in Eertink et al. (Reference Eertink, Wood and Pellikaan33). BA were determined as described in Saarinen(Reference Saarinen34). In brief, sample material (1·0 g) was added in a 15-ml falcon tube and shaken on maximum speed for 15 min with 2 ml of extraction solution (2 % sulphosalicyl acid dehydrate in 0·1 M HCl) for the extruded diet (EXT) faecal samples and 5 ml for the mice diet faecal samples. Afterwards, 0·5 ml of supernatant was transferred to 1·5 ml of Eppendorf cup together with 0·5 ml of internal standard solution (Heptylamine), mixed on a Vortex mixer, placed in an ice-bath for 15 min and centrifuged for 10 min (14 000 rpm; 18°C). The supernatant was pipetted for derivatisation with dansyl chloride. After derivatisation, 1·0 ml of supernatant was pipetted in vials. The vials were placed in the autosampler, and 30 µl was injected on the column (Agilent 5 TC-C18 250 × 4·6 mm) of the HPLC (Sykam S5200 analyser, Sykam GmbH). Detection took place by a fluorescent detector with an excitation at 250 nm and emission at 540 nm (RF-20A, SerCoLab). The faecal DM content was used to calculate SCFA, NH3 and BA content in the original faeces. The volatile organic compounds phenol, x-cresol and indole were analysed as described in Vossen et al.(Reference Vossen, Goethals and De Vrieze35). There were a few alterations made to this method, that is, 0·5 g of faecal sample was used, there was no internal standard added and the solid phase micro-extraction fibre was exposed to each sample for 40 min at 38·5°C. The compounds were identified by comparing the chromatograms with the National Institute of Standard and Technology Mass Spectral Library (version 2.0, 2005) and retention time matching with external standards (phenol, x-cresol and indole). The data were obtained by expressing the relative area of specific quantifications ions for phenol, x-cresol and indole (respectively m/z 94, 107 and 117). The detection limit was set at 1 × 10⁴. We report x-cresol as p-cresol.
Calculations
When urine is collected with modified cat litter boxes containing polyethylene grains, some inevitable losses of urine occurs. Therefore, we measured the difference in volume and weight between a known amount of urine added to the litter box and the amount that was recovered. This was repeated twelve times, and the following linear regression was derived to calculate the amount of voided urine:
 $${\rm{y}} = {\rm{1}} \cdot {\rm{1395}}\,{\rm{x}}\, + {\rm{3\cdot8523}}$$
where y = urine (ml) voided and x = urine (ml) collected and 4·2 < x < 44·0 ml.
The amino acids (AA) were calculated as a proportion of the sum of all AA (g /100 g AA) because of the large difference in DM% between EXT and mice.
GE (MJ/kg) was calculated after using the Flash 2000 Elemental Analyzer with the equation 0·3491 × C (weight percentage, wt%) + 1·1783 × H (wt%) + 0·1005 × S (wt%) − 0·0151 × N (wt%) − 0·1034 × O (wt%) − 0·0211 × ash (wt%)(Reference Obernberger and Thek36). The Flash 2000 Elemental Analyzer does not generate a value for O. Therefore, O + ash was calculated as 100 – H – N – S. Then, an average was calculated when the outcome of this calculation was presumed as O and when it was presumed as ash.
Apparent total tract digestibility values (%) were calculated using the equation: ((nutrient intake (g/d) − faecal nutrient output (g/d))/nutrient intake (g/d)) × 100. Dietary ME (kJ/kg) was calculated with data from individual cats utilising the equation ME = ((GE of food consumed (kJ/d) - GE of faeces collected (kJ/d)) - GE of urine collected (kJ/d))/amount of food consumed (kg/d).
The MUET of δ15N was calculated as an alteration on the calculation for the faecal mean retention time of Thielemans et al. (Reference Thielemans, François and Bodart37):
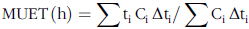 $${\rm{MUET}}\,{\rm{(h)}} = \sum {{\rm{t}}_{\rm{i}}}\,{{\rm{C}}_{\rm{i}}}\,{\rm{\Delta}}{{\rm{t}}_{\rm{i}}}{\rm{/}}\sum {{\rm{C}}_{\rm{i}}}\,{\rm{\Delta}} {{\rm{t}}_{\rm{i}}}$$
where ti is the average time between the collection time of sample i and that of sample i-1, Ci is the marker concentration in sample i, and Δti is the interval between ti and ti-1.
Histamine and pyrrolidine were not included in the calculation of total BA because several values were non-detectable when cats ate MM (histamine: n 2; pyrrolidine: n 3) and when cats ate WM (histamine: n 5; pyrrolidine n 1).
Molecular analysis
DNA extraction was performed with the Qiagen DNeasy®PowerLyzer® PowerSoil® Kit (ref 12855-100). The concentration of the DNA was measured using the Nanodrop ND-1000 spectrophotometer (Nanodrop Technologie). Ten µl genomic DNA extract was send out to LGC genomics GmbH where the 16S rRNA gene V3-V4 hypervariable region was amplified as described in Van Landuyt et al.(Reference Van Landuyt, Cimmino and Dumolin38). The PCR mix included 1 µl of 10× diluted DNA extract, 15 pmol of both the forward primer 341F 5’- NNNNNNNNNTCCTACGGGNGGCWGCAG and reverse primer 785R 5’- NNNNNNNNNNTGACTACHVGGGTATCTAAKCC(Reference Klindworth, Pruesse and Schweer39) in 20 µl volume of MyTaq buffer containing 1·5 units MyTaq DNA polymerase (Bioline), and 2 µl of BioStab II PCR Enhancer (Sigma-Aldrich). For each sample, the forward and reverse primers had the same unique 10-nt barcode sequence. PCR were carried out for 30 cycles using the following parameters: 2 min 96°C pre-denaturation; 96°C for 15 s, 50°C for 30 s and 70°C for 90 s.
DNA concentration of amplicons of interest were determined by gel electrophoresis. Next, about 20 ng of amplicon DNA of each sample was pooled for up to forty-eight samples carrying different barcodes. The amplicon pools were purified with one volume of AMPure XP beads (Agencourt) to remove primer dimer and other small mispriming products, followed by an additional purification on MinElute columns (Qiagen). Finally, about 100 ng of each purified amplicon pool DNA was used to construct Illumina libraries by means of adaptor ligation using the Ovation Rapid DR Multiplex System 1-96 (NuGEN). Illumina libraries were pooled, and size was selected by preparative gel electrophoresis. Sequencing was performed on an Illumina MiSeq using v3 Chemistry (Illumina).
Bioinformatics (16S rRNA gene profiling)
Read assembly and clean-up was largely derived from the MiSeq SOP described by the Schloss lab(Reference Schloss, Gevers and Westcott40,Reference Kozich, Westcott and Baxter41) . In brief, mothur (v.1.42.3) was used to assemble reads into contigs, perform alignment-based quality filtering (alignment to the mothur-reconstructed SILVA SEED alignment, v. 138.1), remove chimeras (vsearch v2·13·0), assign taxonomy using a naive Bayesian classifier(Reference Wang, Garrity and Tiedje42) and SILVA NR v138.1 and cluster contigs into operational taxonomic units (OTU) at 97 % sequence similarity. All sequences that were classified as Eukaryota, Archaea, Chloroplasts or Mitochondria and those that could not be classified at all were removed. For each out, representative sequences were picked as the most abundant sequence within that OTU and singletons were removed prior to further data analyses.
Statistical analyses
Based on a power analysis, a sample size of n 8 cats per group was found to be sufficient (Settings: Power = 0·8; α = 0·05/2 (to correct for multiple testing); d = 1·75 (based on the study of Depauw et al. (Reference Depauw, Hesta and Whitehouse-Tedd16)); two-sample t test; conducted in R 4.0.3. using the pwr package). The power analysis was based on the significant difference in indole values after cheetahs had consumed two different diets in Depauw et al. (Reference Depauw, Hesta and Whitehouse-Tedd16). The effect size d (i.e. difference between the means divided by the pooled standard deviation) was found to be 1·75. The outcome parameters can be grouped in apparent total tract digestibility, MUET, microbial composition and fermentation products, each with their unique statistical characteristics. All statistical analyses and graph visualisations were conducted in RStudio v3.6.3 and v.4.2.0 (faecal microbiota), using packages vegan v.2.6.2, microbiome v.1.18.0, phyloseq v.1.40.0 and ggplot2 v3.3.6. To compare the difference in food intake, faecal characteristics, apparent total tract digestibility and urine characteristics between WM and MM treatment, a linear regression was performed using lm function of the stats-package. To analyse the effect of both treatment (WM v. MM) and the difference between the baseline period (EXT preMM; EXT preWM) and the experimental period (postMM; postWM), a linear mixed model was used including both treatment and period and with cat as random factor using the lmer-function in the lmerTest-package(Reference Kuznetsova, Brockhoff and Christensen43).
Alpha diversity indices (Richness (observed OTU), Shannon, InvSimpson) were calculated on OTU after normalisation by scaling with ranked subsampling (SRS)(Reference Beule and Karlovsky44) at 35 688 sequences per sample. Differences in α diversity measures were further assessed by Kruskal–Wallis and pairwise Wilcoxon tests with Benjamini–Hochberg standard false discovery rate (FDR-BH) correction for multiple testing and significance threshold at P < 0·05.
Beta diversity was assessed using Bray–Curtis dissimilarities and visualised using principal coordinate analysis plots. permutational multivariate analysis of variance (PERMANOVA) was used to identify significant differences between the four groups (EXT preMM, EXT preWM, postMM and postWM). All PERMANOVA analyses were run with VEGAN function adonis with 1000 permutations. Pairwise group comparisons were assessed with the function pairwise.adonis, and P-values were adjusted with the false discovery rate correction.
For taxonomic composition and differential abundance analyses, OTU assigned to phyla and family whose relative median abundance was ≤ 1 % were removed from further analyses. Differences in taxonomic profiles at phylum and family level between the four groups were analysed by Kruskal–Wallis and pairwise Wilcoxon tests with FDR-BH correction and significance threshold at P adj < 0·05.
Linear discriminant analysis effect size (LEfSe) was used to estimate which microbiome attributes differ significantly between cats fed MM (postMM) v WM (postWM). The Galaxy implementation of LEfSe with default options was used, including a threshold of 2·0 for the logarithmic linear discriminant analysis score for discriminate features. Differential abundance of OTU between EXT preMM and postMM, EXT preWM and WM, and postMM and postWM was determined with DESeq2 v.1.36.0. Original count data were used after filtering rows with fewer than five counts over the entire row and using the parametric Wald test in DESeq2 with alpha = 0·01.
Results
The average body weight loss of cats fed WM and MM was 1 % throughout the study. One cat from the MM group and one cat from the WM group did not defecate during the first collection period (EXT preMM; EXT preWM). One cat from the MM group was less active for 1 day during diet adaptation and seemed generally unwell. This cat also had outlying results for NH3 and agmatine and, therefore, all results from the fermentation end products were omitted from the analysis. No urine was collected from one cat who vomited after 15N-glycine was added to the diet.
Diet, food intake, nutrient digestibility, faecal characteristics and mean urinary excretion time
The chemical composition of EXT and the mice is presented in Table 1. The ME content of mice was lower when calculated using the Atwater factors than analysed (Table 1). Mincing the mice had no effect on food intake, faecal output, faecal score, faecal pH, nor apparent macronutrient digestibility (P > 0·10) (Table 2). Faecal DM percentage was higher (P = 0·01) when feeding MM compared with WM (Table 3). Cats fed MM had a mean (sd) MUET of 17·8 (4·3) h, which was not different (P = 0·33) to those fed the WM 14·5 (7·2) h.
Table 2. Food intake, faecal characteristics, apparent total tract macronutrient digestibility and urine characteristics of domestic cats fed minced mice (MM) or whole mice (WM)
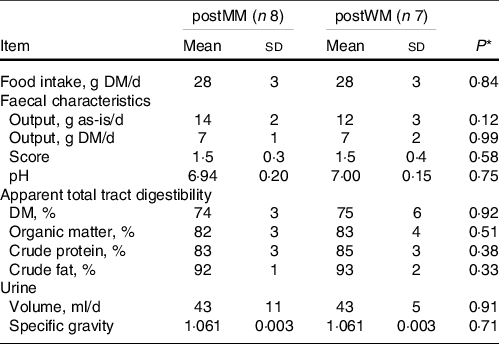
postMM, after eating minced mice; postWM, after eating whole mice.
* P-value indicating the effect of treatment in a linear regression model including minced mice v whole mice as fixed factor.
Table 3. Faecal DM, ammonia, SCFA, and biogenic amine concentrations (µmol/g of DM, unless defined differently) and volatile organic compounds (expressed as % AUC) of cats fed an extruded dry cat food (EXT; n 13) and minced mice (MM; n 7) or whole mice (WM; n 7)
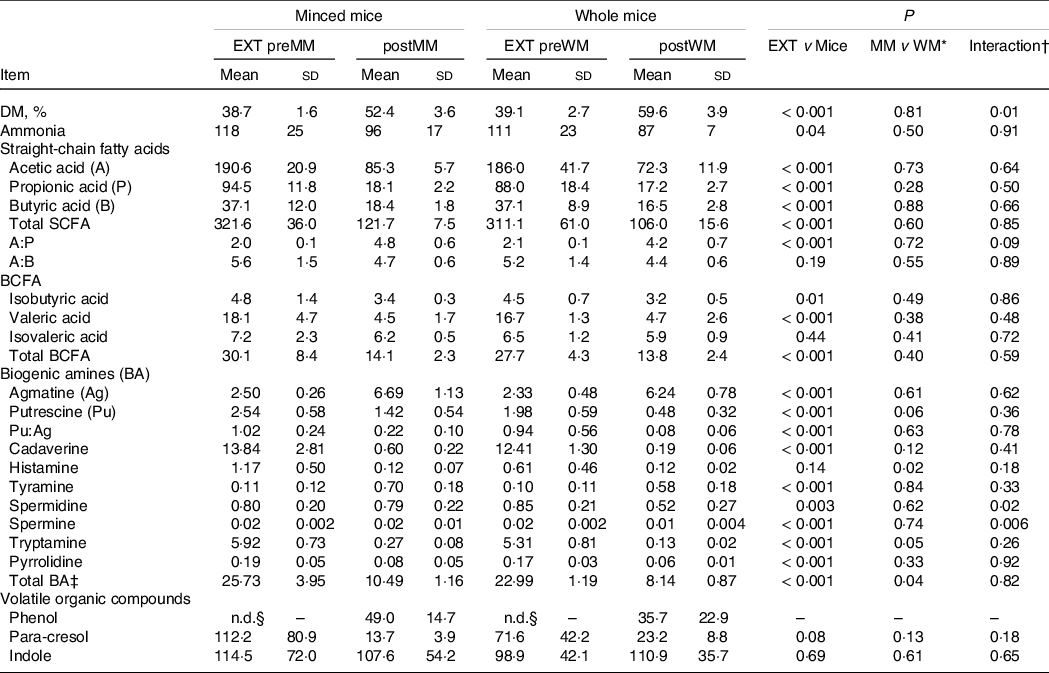
EXT preMM, extruded dry cat food before eating minced mice; postMM, after eating minced mice; EXT preWM, extruded dry cat food before eating whole mice; postWM, after eating whole mice; BCFA, branched-chain fatty acid; BA, biogenic amines.
* Comparison between the group minced mice (EXT preMM and postMM) and the group whole mice (EXT preWM and postWM).
† Interaction of group (minced mice v whole mice) and experimental time.
‡ Total biogenic amines = agmatine + putrescine + cadaverine + tyramine + spermidine + spermine + tryptamine.
§ Not detectable.
Mean (sd) DM intake of mice (WM + MM) was 28·1 (2·8) g/d which was lower (P < 0·001) than EXT(WM + MM) of 45·5 (4·4) g/d and resulted in a lower (P = 0·001) mean (sd) faecal score of 1·5 (0·3) v 2·2 (0·4), higher (P < 0·001) pH (6·96 (0·17) v 5·92 (0·15)) and higher faecal DM % (P < 0·001) (Table 3).
Faecal microbial populations
A total of 1 611 224 reads from twenty-eight faecal samples (median (IQR): 54 157 (20 991)) passed quality filtering and were assigned into 1537 OTU. After normalisation, 1215 OTU were retained with the number of OTU varying between 191 and 385 per sample (median: 278).
Alpha diversity indices (Richness, Shannon diversity, InvSimpson) are shown in Fig. 1. There was a decrease in richness (Wilcoxon, EXT preMM v. postMM, P adj = 0·002; EXT preWM v. postWM, P adj = 0·002) when cats were fed mice, but an increased diversity based on InvSimpson (Wilcoxon, EXT preMM v postMM, P adj = 0·002; EXT preWM v. postWM, P adj = 0·02) and Shannon diversity indices, though the latter was not significant (Wilcoxon, EXT preMM v postMM, P adj = 0·05; EXT preWM v. postWM, P adj = 0·15). Beta diversity, as measured by Bray–Curtis dissimilarities, showed clustering between cats fed EXT and cats fed mice (ADONIS, F = 24·25, P adj < 0·001) as well as a difference between cats fed MM v WM (ADONIS, F = 5·30, P adj = 0·002) (Fig. 2).
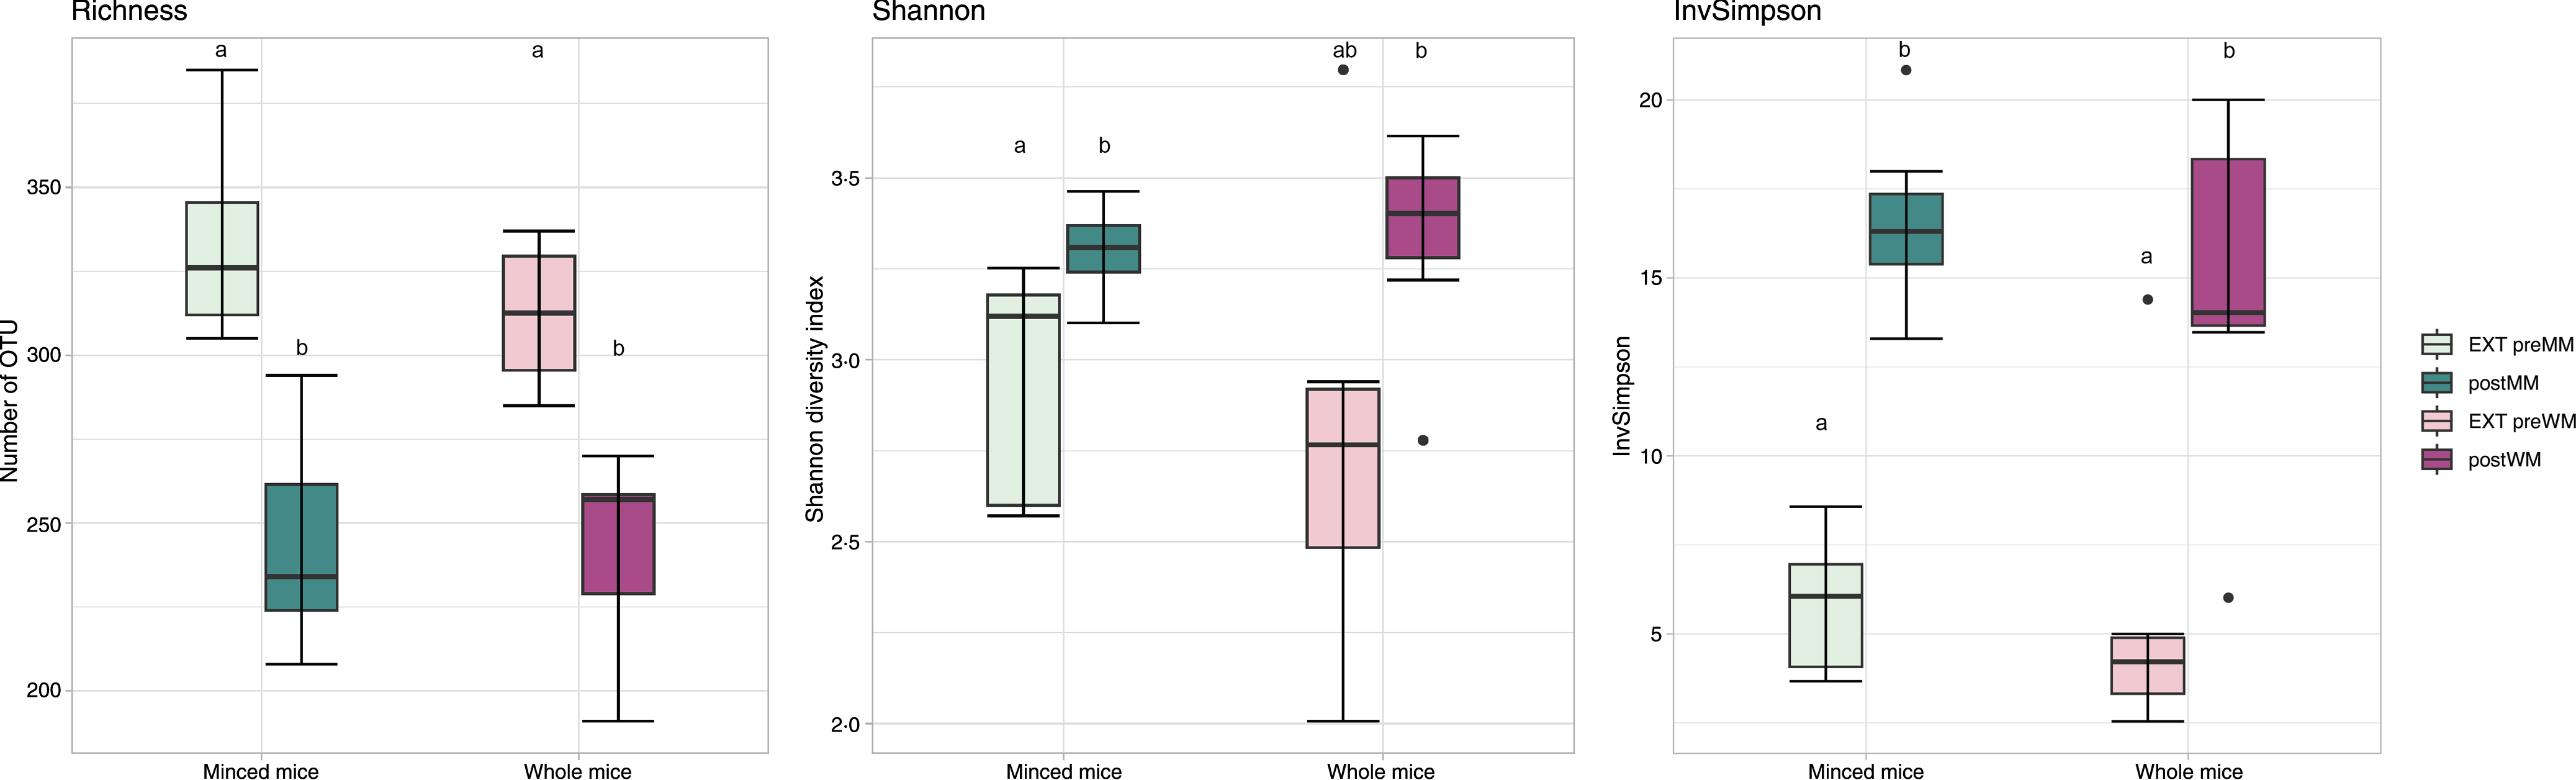
Fig. 1. Alpha diversity measures. Boxplot of microbial richness (number of observed OTU), Shannon diversity and InvSimpson from faecal samples of cats fed extruded food before changing to minced mice (EXT preMM; n 7) or whole mice (EXT preWM; n 6) and after feeding minced mice (postMM; n 8) or whole mice (postWM; n 7). The boxes denote interquartile ranges (IQR) with the median as a black line and whiskers extending up to the most extreme points within 1·5-fold IQR. Differences between groups with different letters are statistically significant as assessed by pairwise Wilcoxon tests with Benjamini–Hochberg false discovery rate correction for multiple testing and significance threshold at P < 0·05. OTU, operational taxonomic unit; EXT preMM, extruded dry cat food before eating minced mice; postMM, after eating minced mice; EXT preWM, extruded dry cat food before eating whole mice; postWM, after eating whole mice.
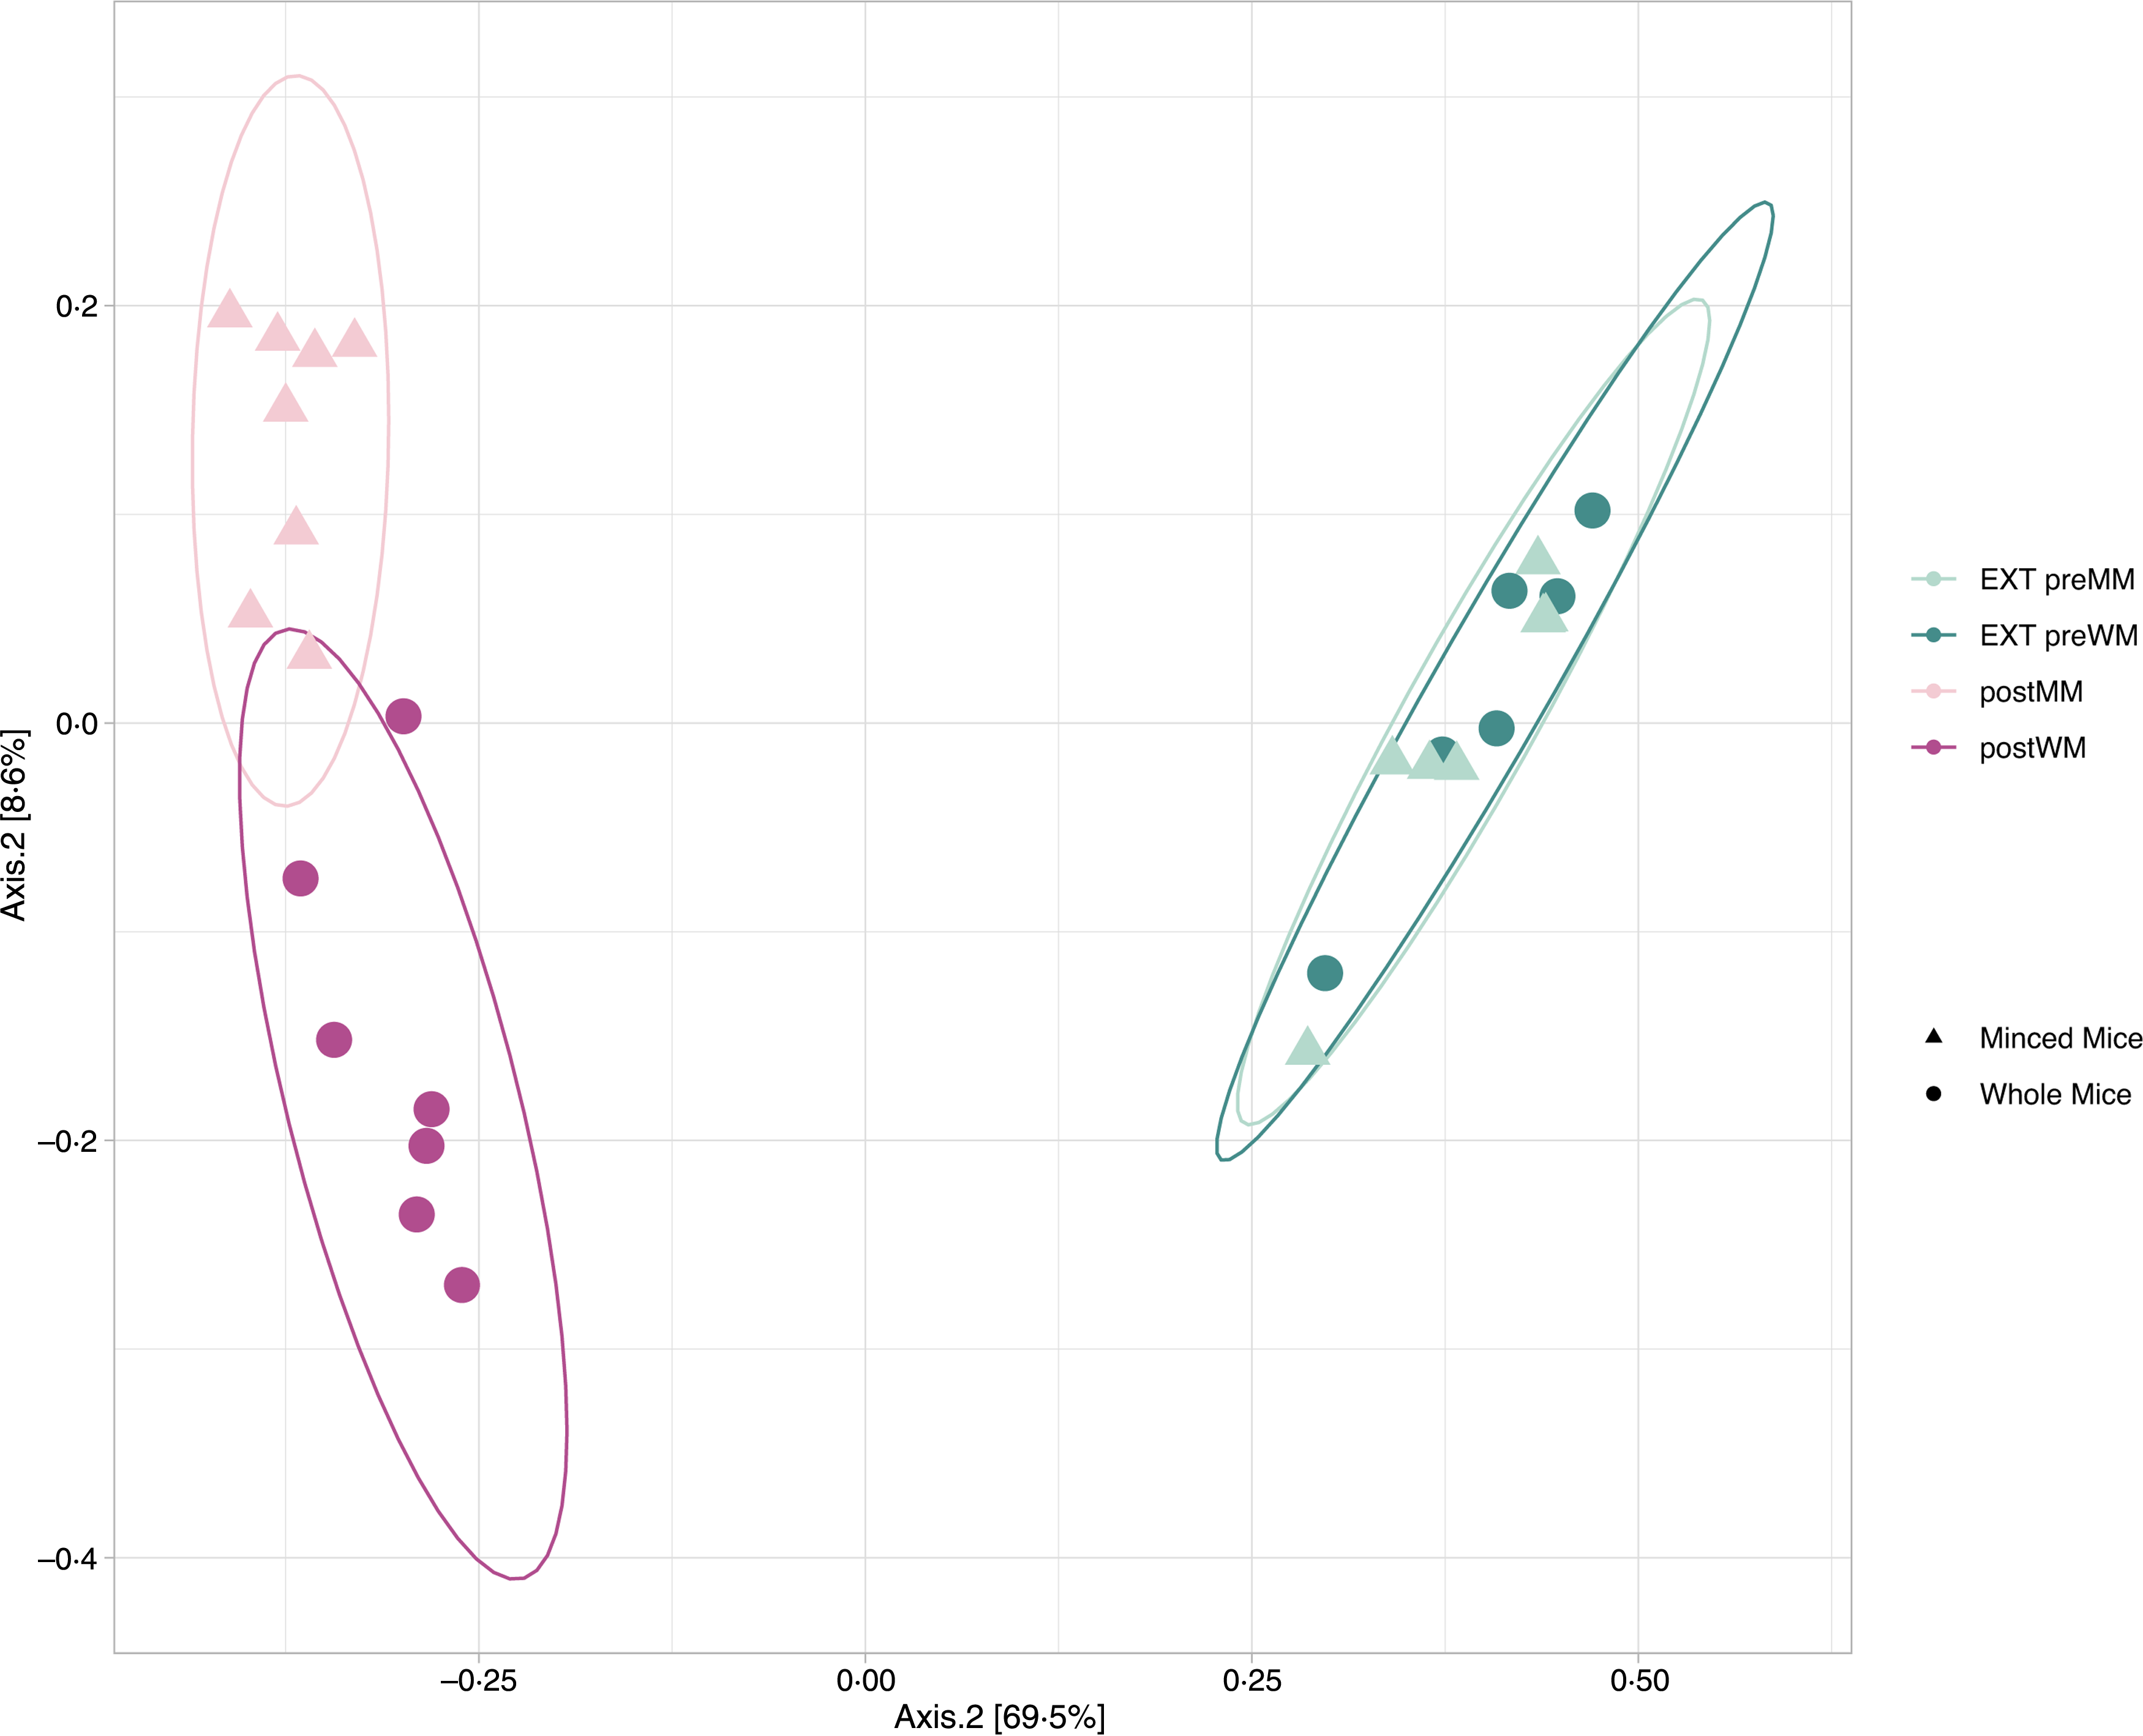
Fig. 2. Beta diversity. Principal coordinate analysis (PCoA) plot based on Bray–Curtis dissimilarities of microbial community structure in faecal samples of eight cats in the minced mice group (EXT preMM; postMM) and seven cats in the whole mice group (EXT preWM; postWM). Beta-diversity showed clustering between cats fed extruded diet and cats fed mice (ADONIS, F = 24·25, P adj < 0·001) as well as a difference between cats fed minced mice v whole mice (ADONIS, F = 5·30, P adj = 0·002). EXT preMM, extruded dry cat food before eating minced mice; postMM, after eating minced mice; EXT preWM, extruded dry cat food before eating whole mice; postWM, after eating whole mice.
At phylum level, the OTU were assigned to eleven phyla of which only five had a median relative abundance > 1 % (Fig. 3(a)). The low abundant phyla were removed from further analyses. Firmicutes was the most abundant bacterial phylum in cat faeces when eating MM (median (IQR): 67·2 % (0·05)) or WM (55·4 % (0·15)), followed by Bacteroidota (postMM: 13·2 % (0·05); postWM: 16·4 % (0·10)), Fusobacteriota (postMM: 14·2 % (0·06); postWM: 11·0 % (0·06)), Actinobacteriota (postMM: 4·6 % (0·02); postWM: 8·0 % (0·02)) and Proteobacteria (postMM: 1·0 % (0·01); postWM: 1·5 % (0·01)), with a significant difference in relative abundance between postMM and postWM groups for Firmicutes (Wilcoxon, P adj < 0·001), Bacteroidota (Wilcoxon, P adj = 0·01) and Actinobacteriota (Wilcoxon, P adj = 0·001). These differences were also seen with LEfSe analysis (online Supplementary Fig. 1).
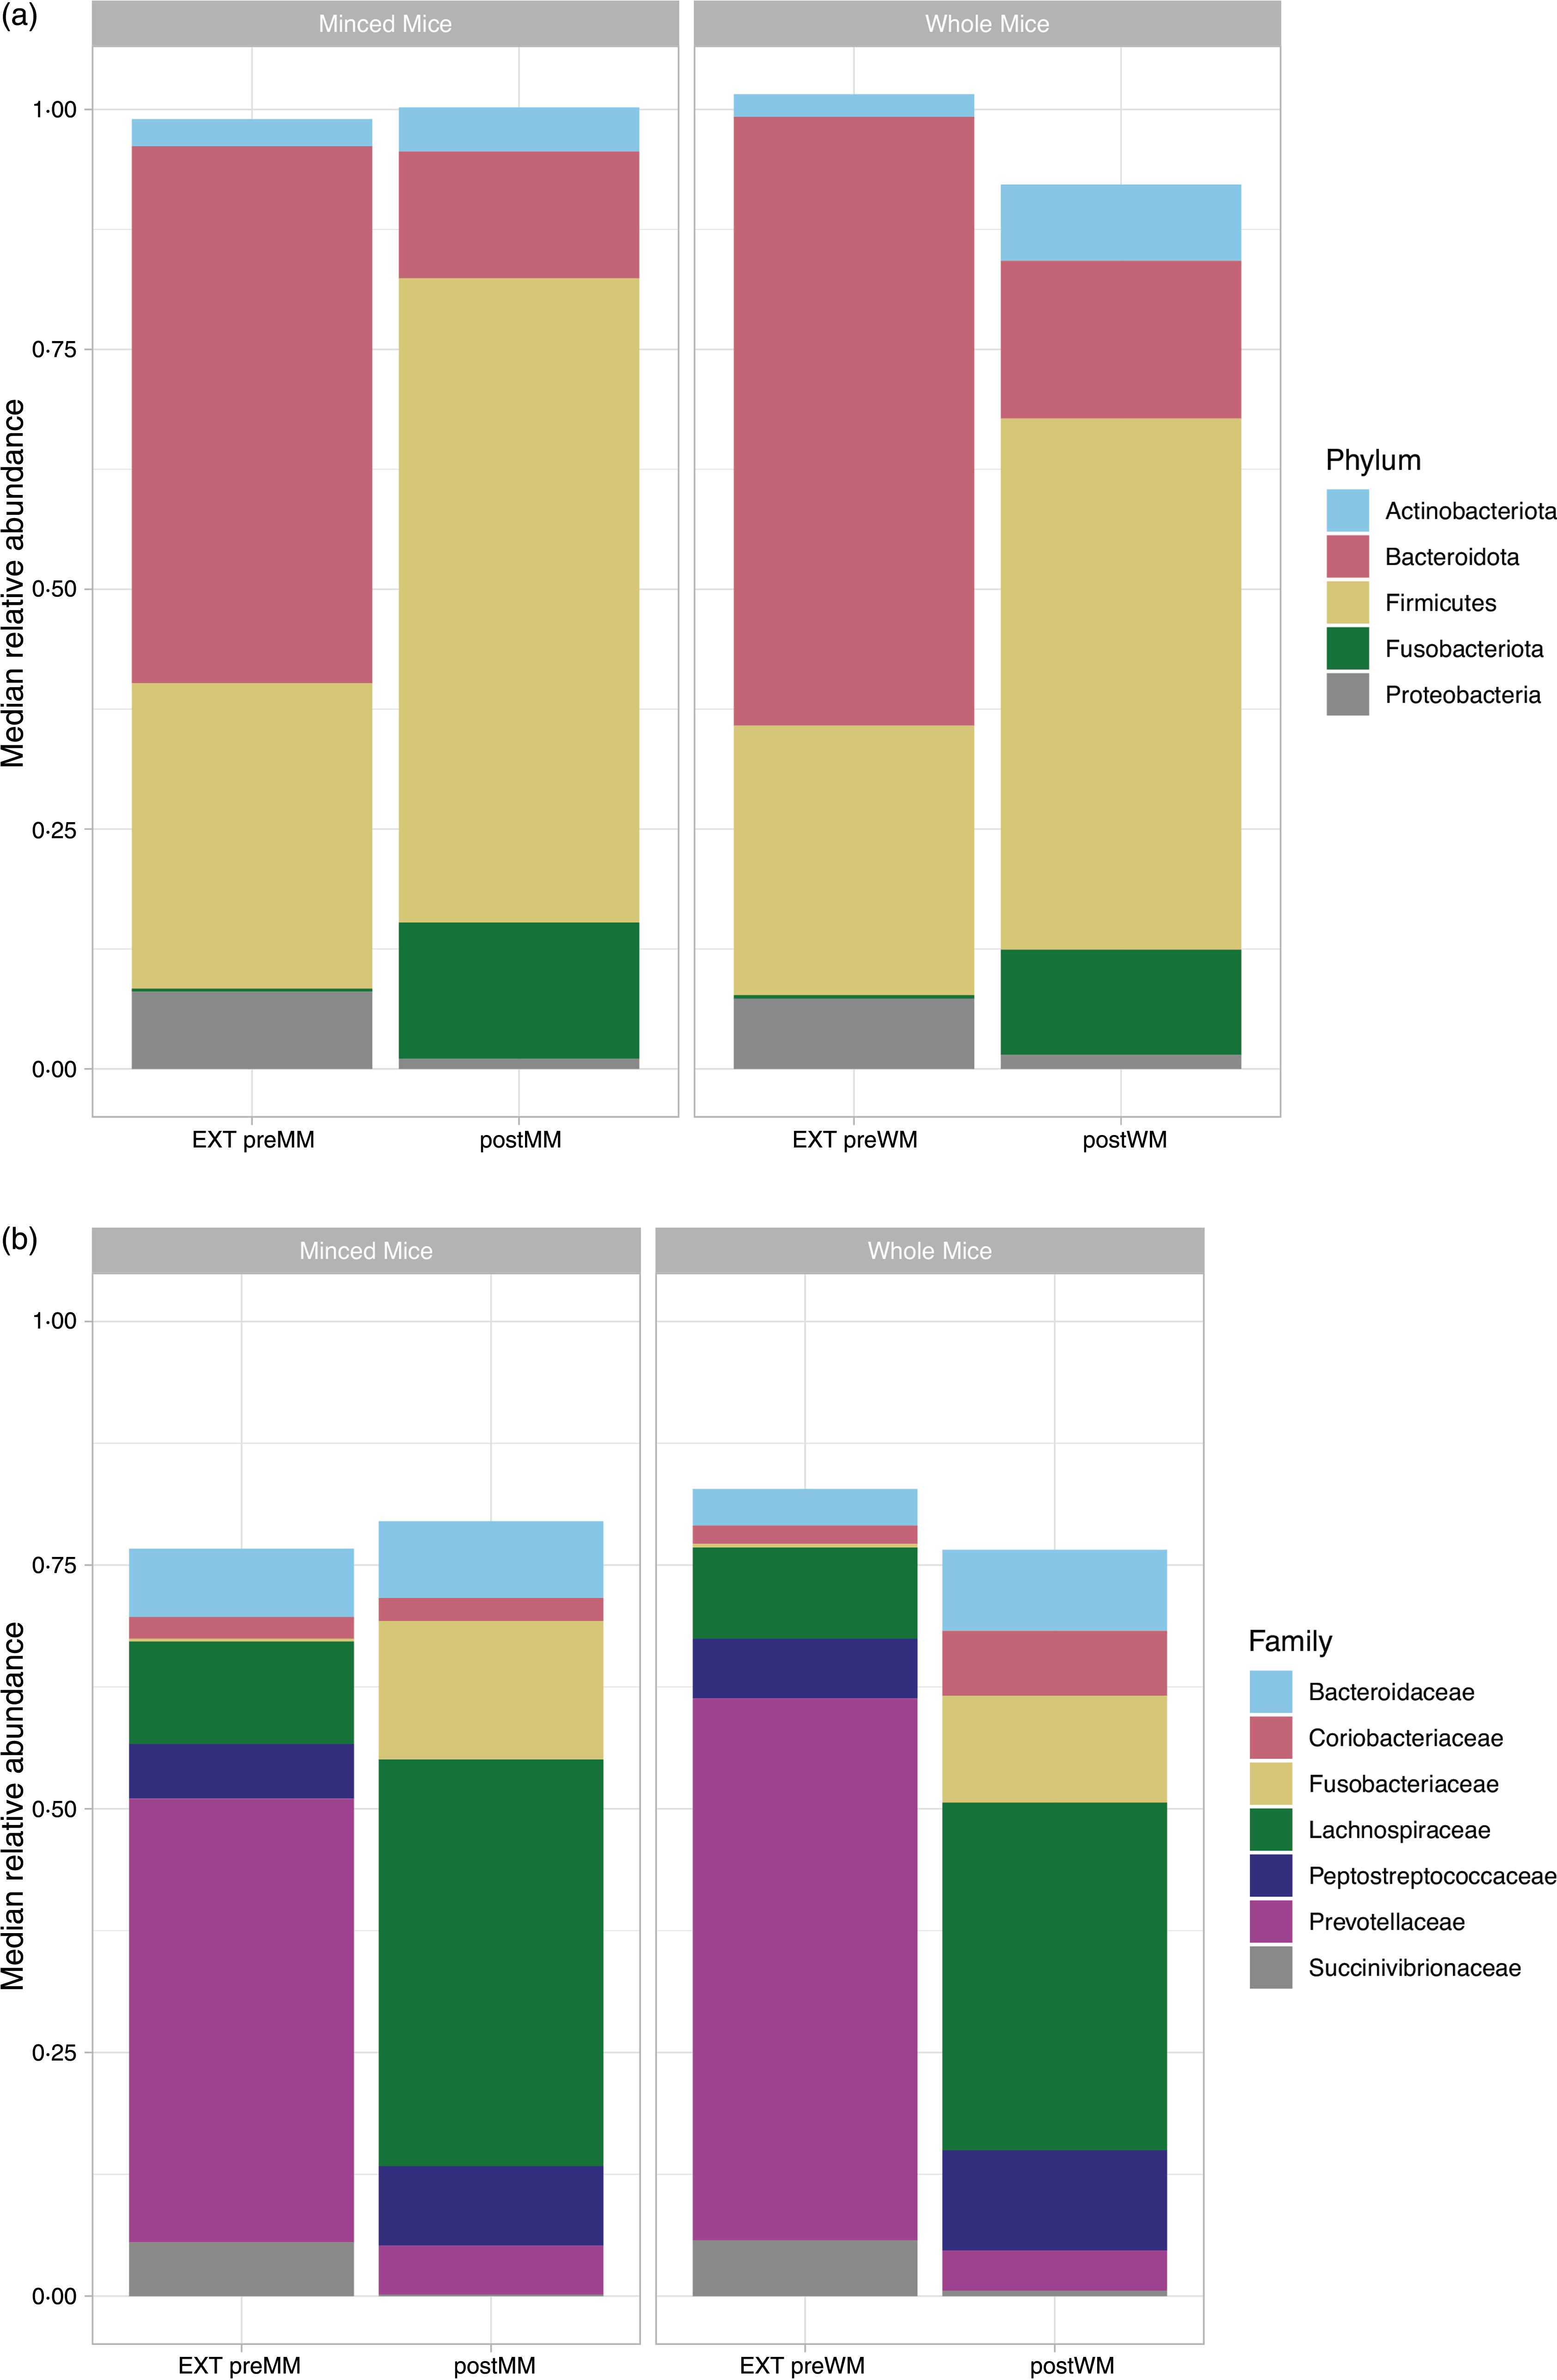
Fig. 3. Relative median abundance of phylotypes at phylum (a) and family (b) level in faecal samples collected from cats fed extruded food (EXT preMM; n 7) and after changing to minced mice (postMM; n 8) and from cats fed extruded food (EXT preWM; n 6) and after changing to whole mice (postWM; n 7). EXT preMM, extruded dry cat food before eating minced mice; postMM, after eating minced mice; EXT preWM, extruded dry cat food before eating whole mice; postWM, after eating whole mice.
When the food was changed from an extruded food to a mice diet, there was a significant decrease in relative abundance of Bacteroidota (Wilcoxon, P adj < 0·001,) and Proteobacteria (Wilcoxon, P adj < 0·001), and a significant increase of Firmicutes (Wilcoxon, EXT preMM v. postMM, P adj = 0·005; EXT preWM v postWM, P adj < 0·001) and Fusobacteriota (Wilcoxon, EXT preMM v. postMM, P adj = 0·006; EXT preWM v. postMM, P adj = 0·02). The relative abundance of Actinobacteriota was significantly increased in cats changing from extruded to WM diet (Wilcoxon, P adj = 0·001).
At family level, the OTU were assigned to sixty-seven families of which only seven had a median relative abundance > 1 % (Fig. 3(b)). The predominant families in cats fed mice were Fusobacteriaceae (postMM: 14·2 % (0·06); postWM: 11·0 % (0·06)), Peptostreptococcaceae (postMM: 8·2 % (0·04); postWM: 10·3 % (0·09)) and Lachnospiraceae of which the latter was significantly higher in relative abundance when cats were fed MM compared with WM (41·7 % (0·06) v. 35·7 % (0·16); X2 = 29, P < 0·001). For the family Succinivibrionaceae, a small difference between the group fed MM (0·16 % (0·002)) v. WM (0·55 % (0·003); X2 = 4·10, P = 0·04) was observed.
When switching from the EXT to the mice diets, there was a 41·2–51·5 % decrease (P adj < 0·001) in relative abundance of Prevotellaceae (phylum: Bacteroidota) and a 5·4–5·1 % decrease (P adj < 0·001) of Succinivibrionaceae (phylum: Proteobacteria). An increase of 10·7–13·9 % in relative abundance of Fusobacteriaceae was seen when switching to the mice diets (postMM, P adj = 0·006; postWM, P adj = 0·02) (Fig. 3(b)). For the most dominant family of the phylum Actinobacteriota, the Coriobacteriaceae, an increase was observed when cats were fed WM (EXT preWM: 1·9 % v postWM: 6·7 %) (Fig. 3(b)).
As determined by DEseq2 analysis, there were forty-five differentially abundant taxa (OTU) in faeces from cats fed MM compared with cats fed WM. The major group of taxa were classified as Lachnospiraceae. One OTU assigned to the genus Clostridium sensu stricto was 4·88 log2-fold lower when cats were fed WM (Fig. 4).
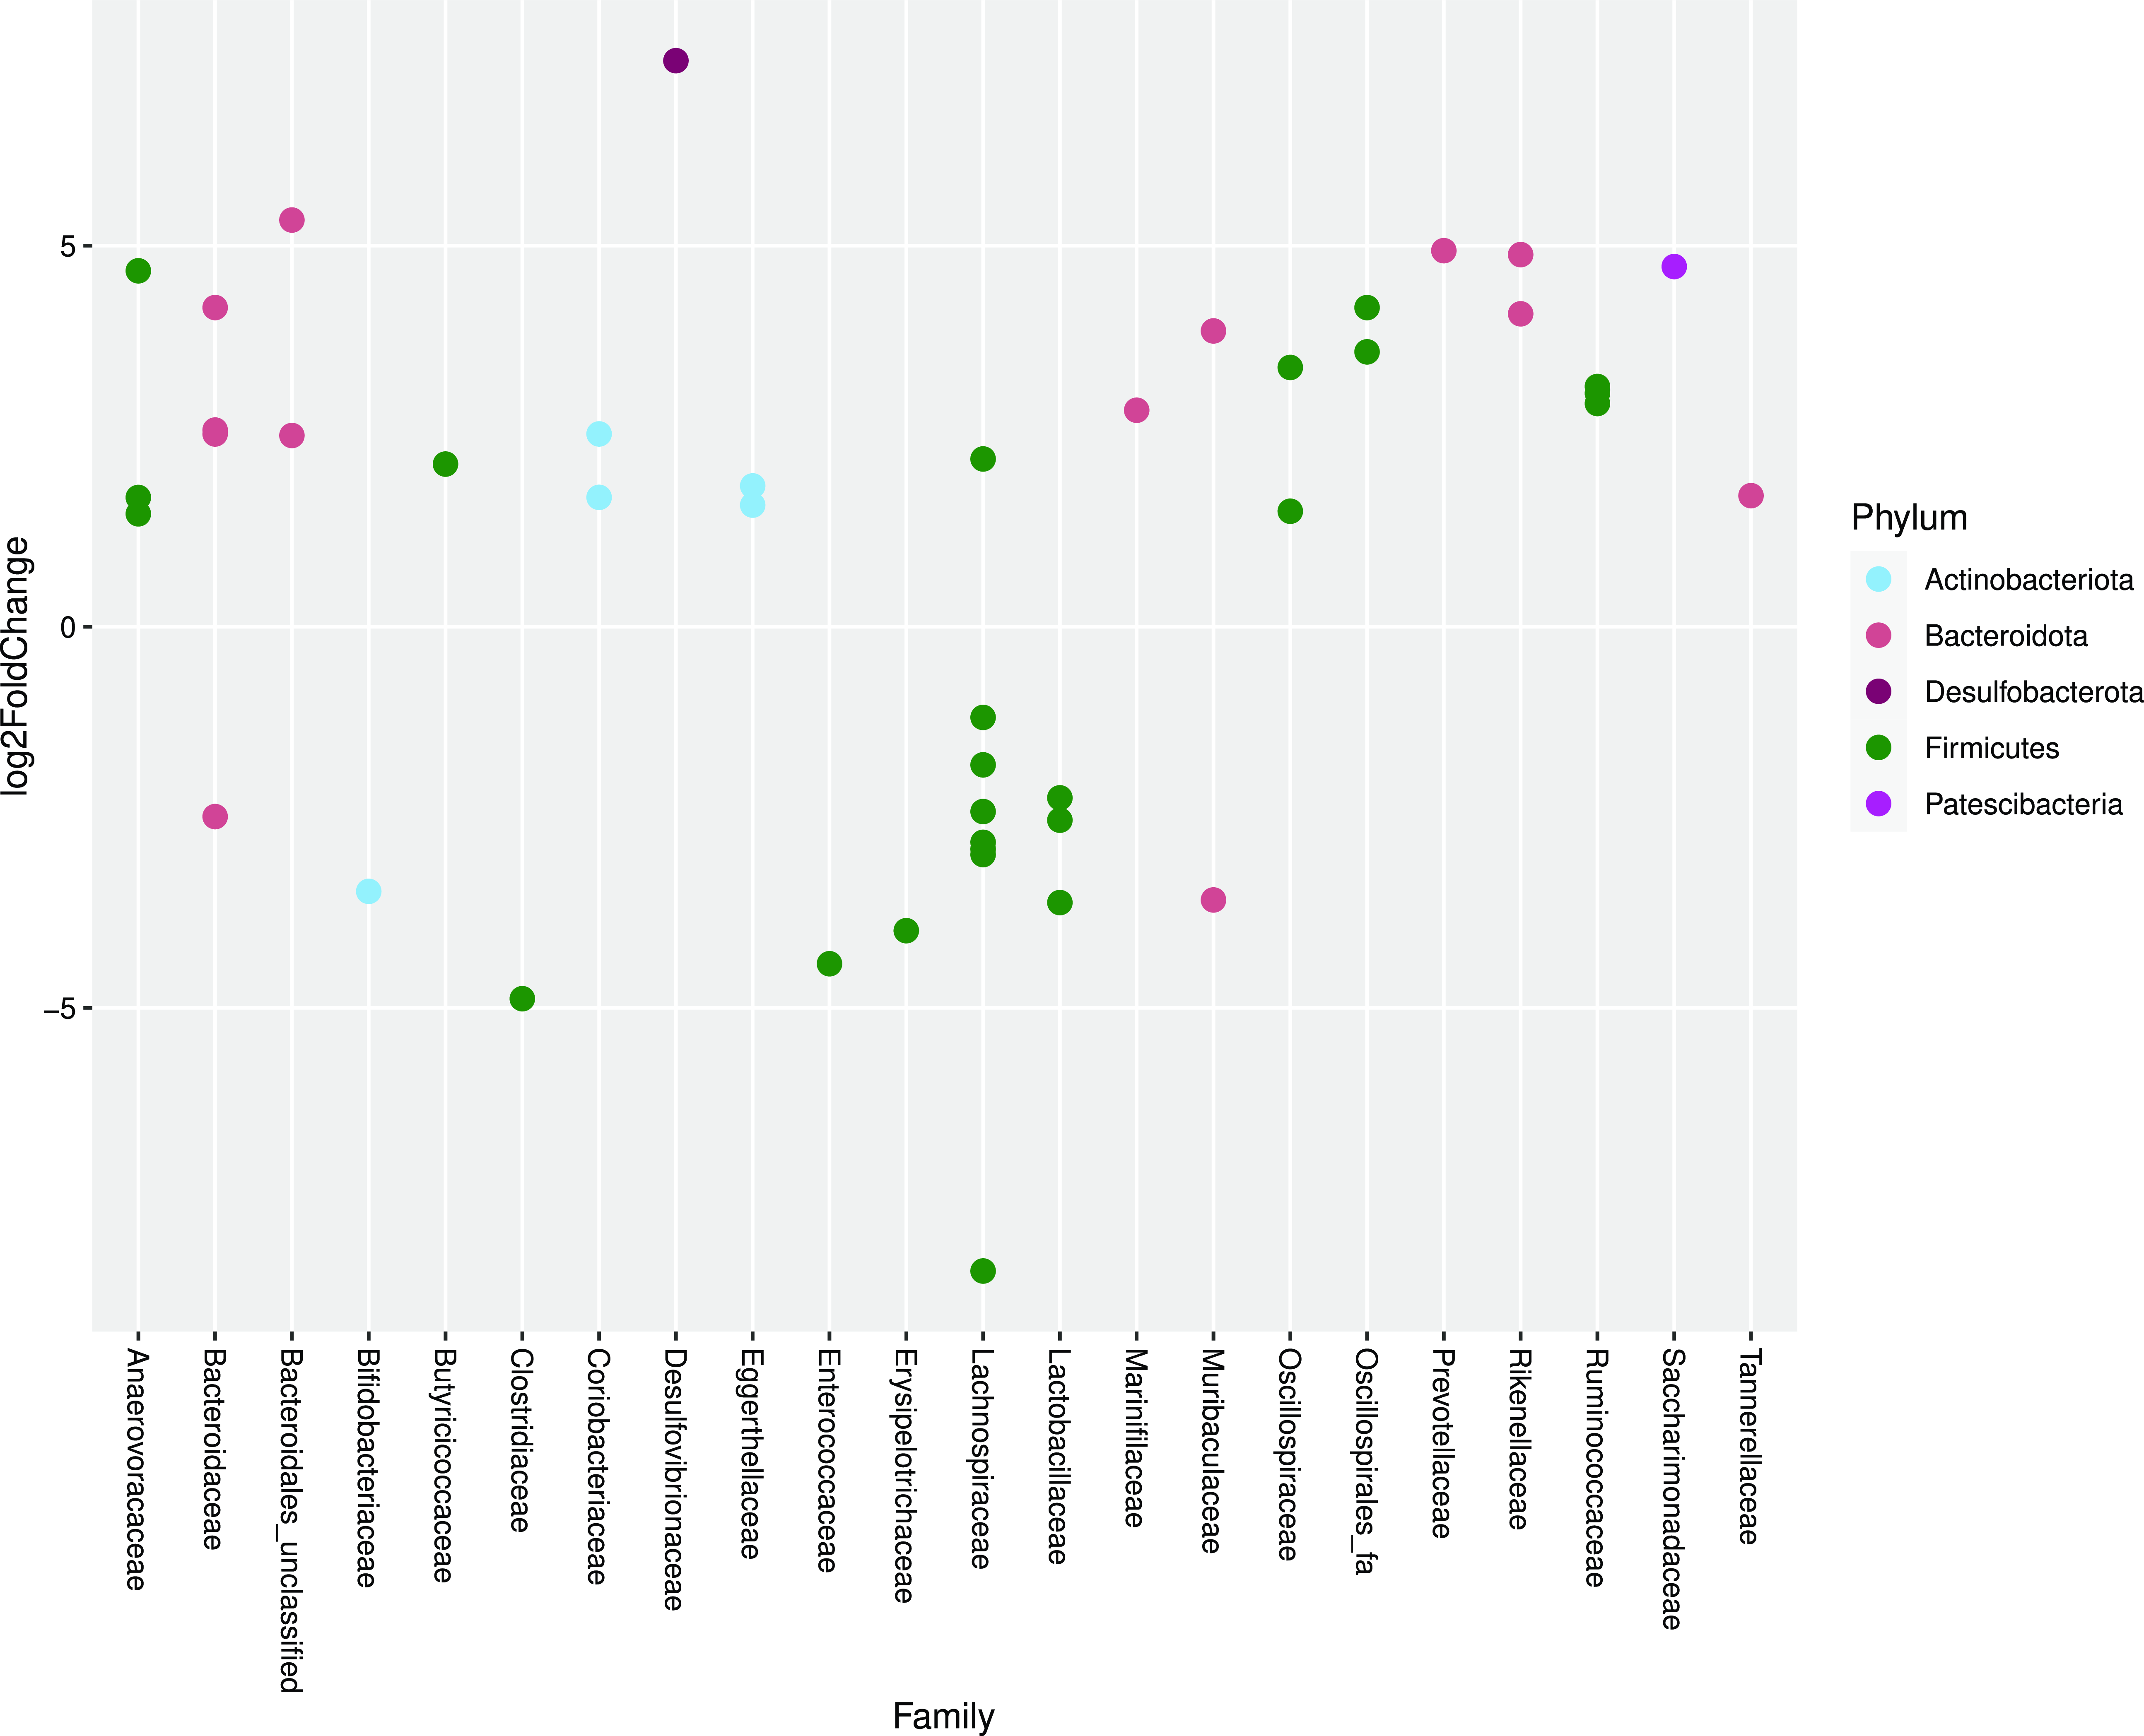
Fig. 4. Log2 fold change in abundance of taxa associated with cats fed minced mice or whole mice. A negative fold change implies a decrease in abundance when cats were changed to whole mice. Original count data were used after filtering rows with fewer than five counts over the entire row and using the parametric Wald test in DESeq2 with alpha = 0·01.
For the cats changing from EXT to MM, 160 OTU showed a significantly different abundance in response to the dietary change; of these, fifty-three species increased and 107 decreased in abundance after feeding MM (Fig. 5(a)). For the cats changing from EXT to WM, 138 OTU showed a significantly different abundance with forty-eight species increasing and ninety OTU decreasing in abundance after feeding WM (Fig. 5(b)). The outcome of the dietary change is comparable between those fed MM v WM. Of species known to be involved in the production of SCFA, Prevotella group 9 showed a significant decrease (13·01–13·16 log2-fold change) when changing from EXT to a mice diet. One OTU assigned to Fusobacterium, known to produce butyric acid and possibly phenol through protein fermentation(Reference Saito, Sato and Nomoto45,Reference Barcenilla, Pryde and Martin46) , increased significantly (5·10–5·28 log2 fold change) when feeding mice. Changing from EXT to a mice diet generated an increase in abundance (3·41–6·54 log2-fold change) of two OTU when fed MM and one OTU when fed WM assigned at genus level to Clostridium sensu stricto 1, another possible phenol producer(Reference Saito, Sato and Nomoto45).
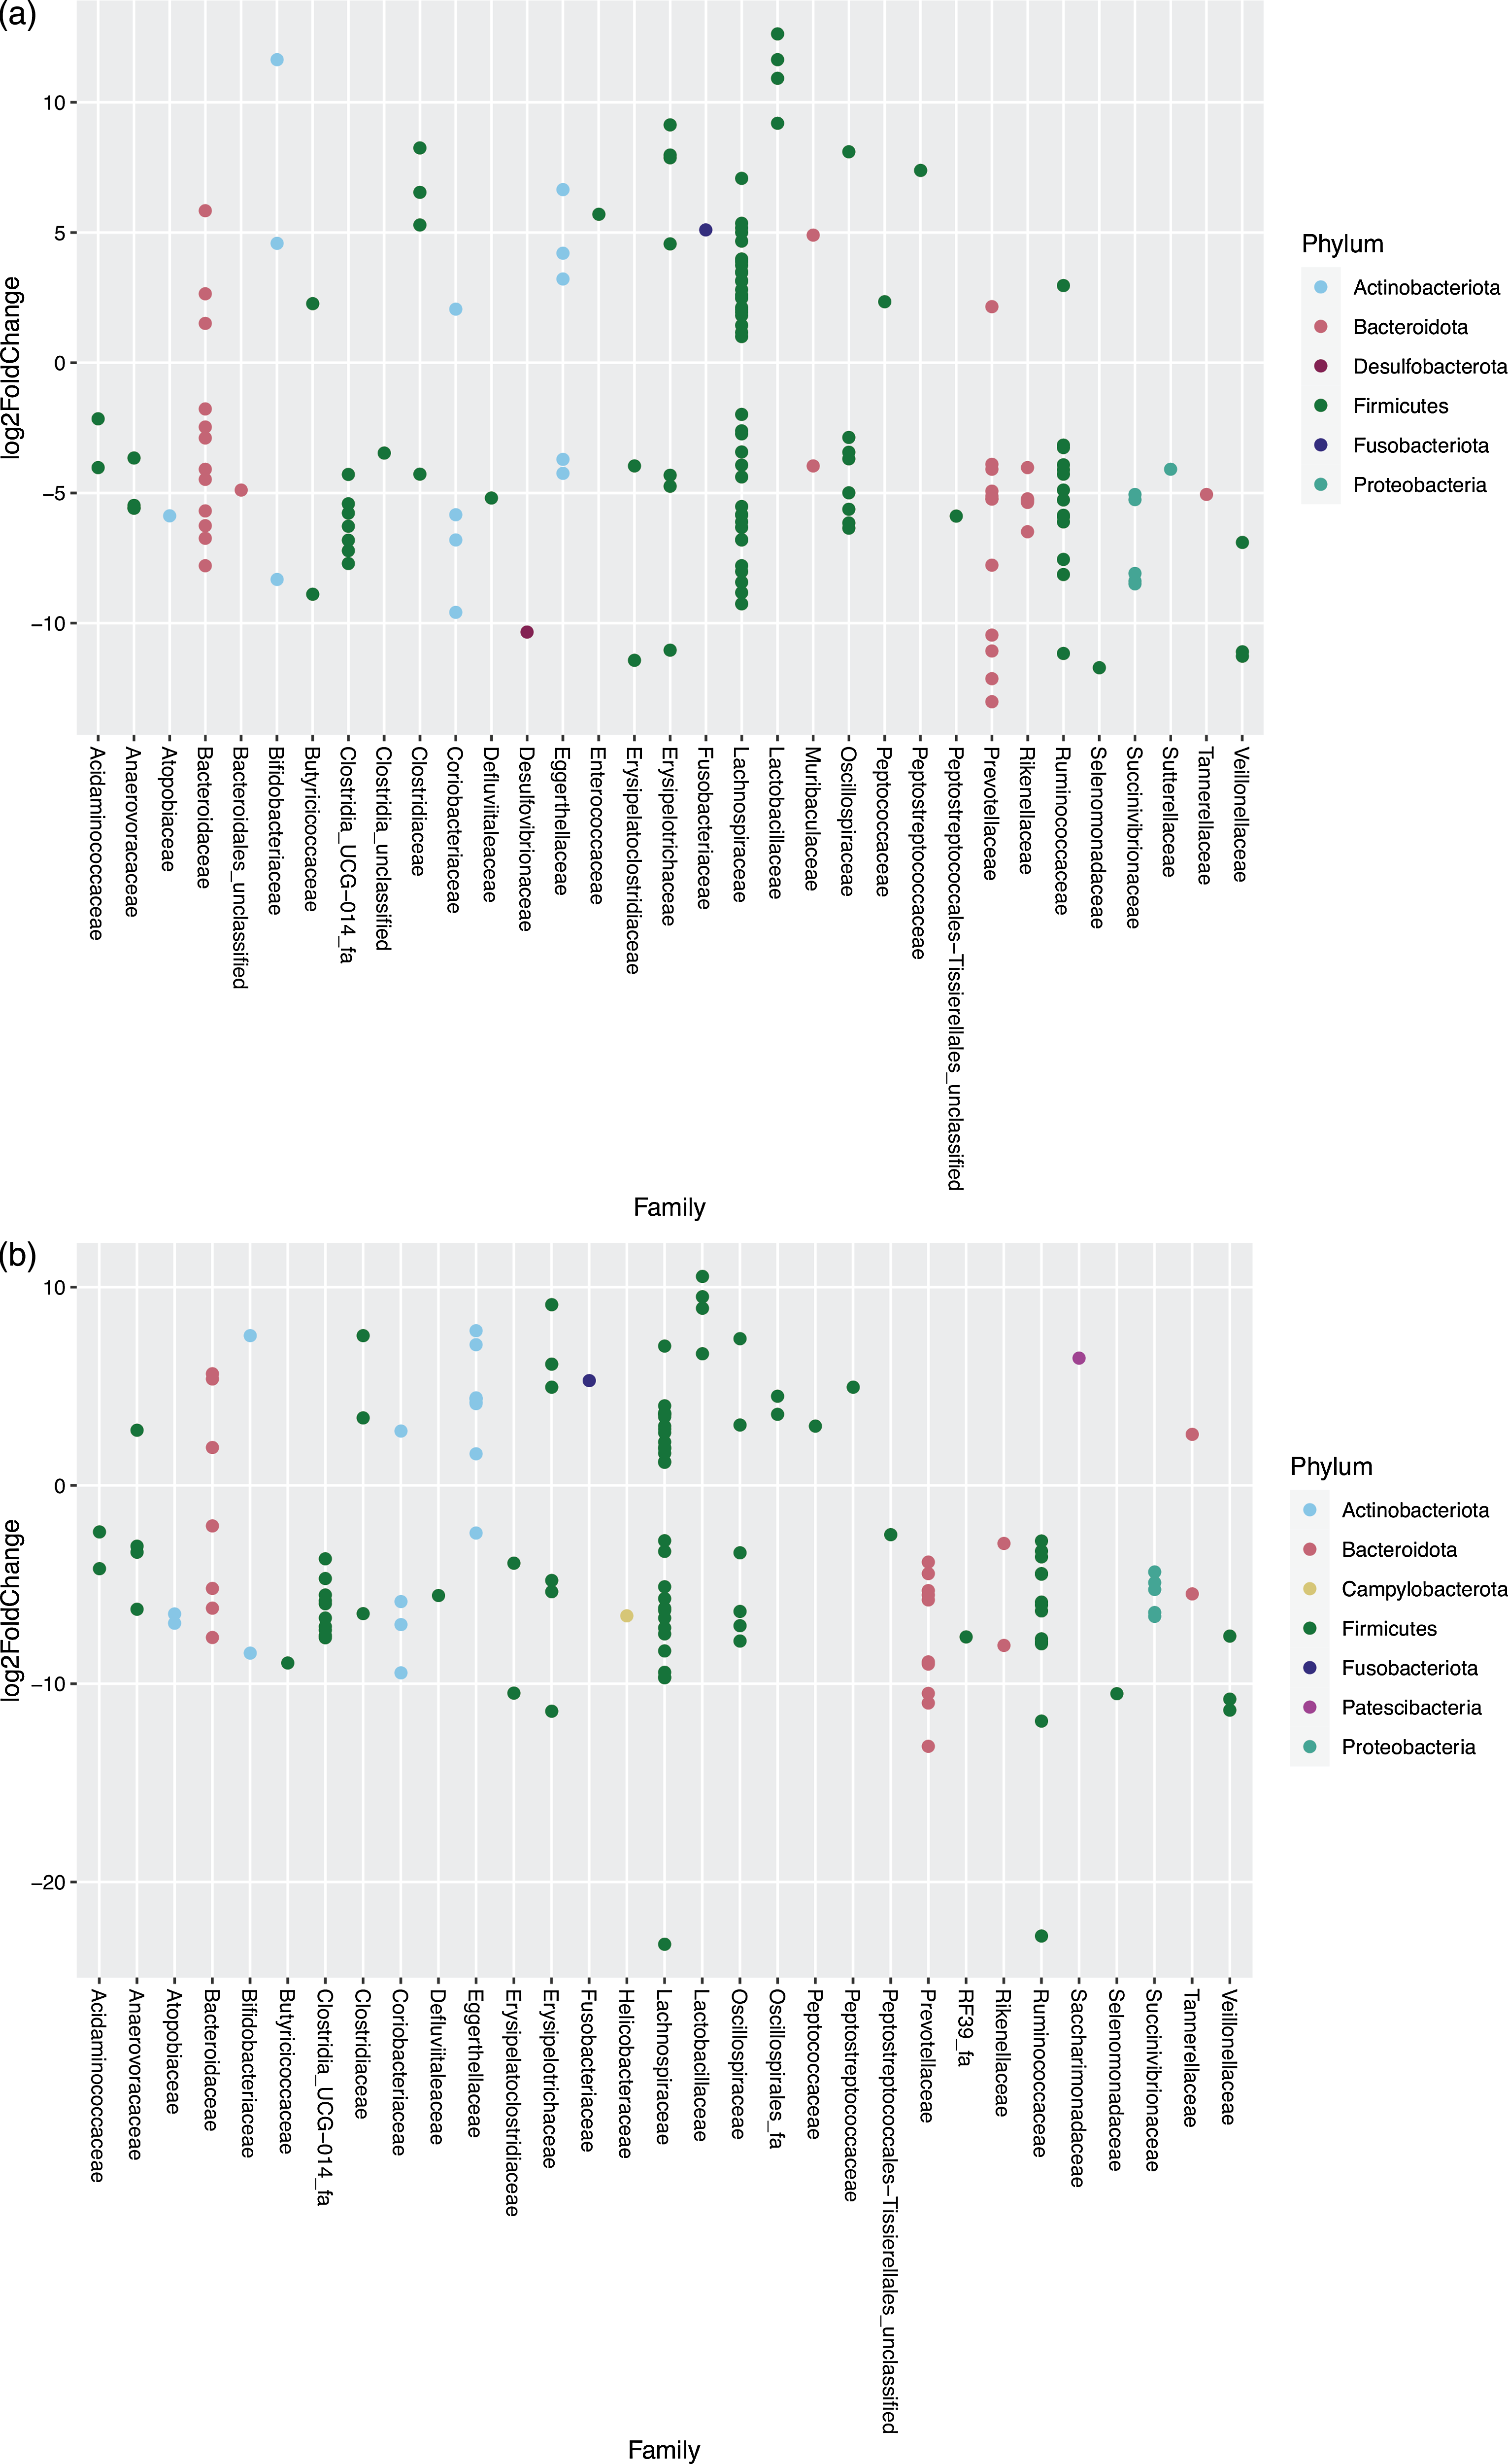
Fig. 5. Log2 fold change in abundance of taxa associated with changing the diet from an extruded dry cat food to minced mice (a) and an extruded diet to whole mice (b). A negative fold change implies a decrease in abundance when cats were changed to a mice diet. Original count data were used after filtering rows with fewer than five counts over the entire row and using the parametric Wald test in DESeq2 with alpha = 0·01.
Faecal fermentation concentrations
The ratio of acetic to propionic acid (P = 0·09) tended to be higher when mincing the mice (Table 3). Spermidine (P = 0·02) and spermine (P = 0·006) concentrations were greater in cats fed MM compared with WM. p-Cresol decreased when mincing the mice, but only numerically (P = 0·18) (Table 3). The concentrations of other volatile fatty acids, NH3, BA, phenol and indole were also not different between MM and WM (Table 3).
The SCFA and BCFA concentrations, except for isovaleric acid, were significantly lower when cats were fed the mice compared with the extruded food (Table 3). Ratios of acetic to propionic acid were lower (P < 0·001) when cats were fed EXT compared with the mice diet (Table 3). The NH3 (P = 0·04) and most BA concentrations were lower on the mice diets, except for a higher agmatine (P < 0·001) and tyramine concentration (P < 0·001) (Table 3). Phenol was not detectable when fed EXT, whereas p-cresol was greater (P = 0·08) when cats were fed EXT. Indole concentrations were not different compared with the mice diets (Table 3).
Discussion
Feeding whole prey to felids has shown to benefit their gastrointestinal health(Reference Depauw, Hesta and Whitehouse-Tedd16,Reference Whitehouse-Tedd, Lefebvre and Janssens47) . Whether this effect was caused by the chemical or physical nature of whole prey is unknown. We observed comparable microbial profiles for MM and WM and mainly numerical differences in the fermentation end products, which suggests a limited protective effect of food structure against proteolytic fermentation. A mouse diet, however, appears to be protective compared with an EXT because of the observed large shift in faecal proteolytic fermentation end products and microbiota. Whether such fermentation profile is associated with an improved gut health and promotes longevity requires further study.
Animal prey contains little plant fibre, but it does contain animal fibre, that is, indigestible fractions from tissues such as hair, bone, cartilage and skin, that have comparable effects as plant fibre(Reference Depauw, Hesta and Whitehouse-Tedd16), including impacting faeces consistency(Reference Sunvold, Fahey and Merchen17,Reference Fekete, Hullár and Andrásofszky48) . The animal fibre in the mice was likely responsible for firm faeces observed in the present study. Apart from collagen, most animal fibres behave as insoluble fibres, hence mitigating fermentation(Reference Depauw, Hesta and Whitehouse-Tedd16), similar to feeding straw to a ruminant. Mincing the mice seemed to reduce that effect, as reflected in the higher concentration of fermentation end products, albeit only significant for two of them. Smaller food particles provide a higher interaction surface between gut microbiota and their substrate but may also cause a shift in digestion site. Unfortunately, it was not possible to study ileal digestibility to provide that insight. In humans, it has been shown that less food structure increases digestibility, and therefore, less nutrients reach the hindgut to be fermented to produce SCFA(Reference Dagbasi, Lett and Murphy10), whilst mincing the mice renders higher SCFA concentrations. The higher SCFA and BCFA concentrations when mincing the mice were accompanied by a higher NH3 and higher BA concentrations, apart from histamine. Although the polyamines putrescine, spermidine and spermine are necessary for optimal growth and function of cells(Reference McDonald, Edwards and Greenhalgh49), high concentrations of BA are commonly considered as health-threatening(Reference Tabanelli50). These higher concentrations can be explained by more proteolytic fermentation in the colon and suggests a health benefit of physical structure in the diet, at least for carnivores such as cats but possibly as a feature for more species, including humans. Mincing is the first step of processing and may exert a higher ratio of fermentable protein to insoluble fibre in the intestine. Despite the changes seen in the fermentation profile, the microbial profile was comparable between the MM and the WM diet.
Whole prey feeding was expected to take longer to be digested and metabolised compared with minced prey, but this was not supported by the apparent total tract digestibility data (Table 2) and the MUET calculated from the urinary marker excretion between MM and WM. Due to difficulties to adapt cats to the environment of climate respiration chambers(Reference Gooding, Duncan and Atkinson51), the technique with stable isotopes and breath analysis(Reference Peachey, Dawson and Harper52) would have disturbed the results of the gastric emptying. Therefore, we alternatively developed the MUET technique which may not have been sensitive enough to detect a difference between the two mice diets. The higher variation of MUET in the WM may, however, point to a more heterogeneous gastric emptying which warrants for further investigation.
A remarkable finding in the present study was the large shift in fermentative end products and faecal microbiota when cats went from the extruded dry cat food to the mice diets. Straight-chain fatty acid, BCFA and total BA concentrations all decreased by feeding MM and WM. Although this shift was confounded by time, these differences can almost exclusively be attributed to the diets as the cats were maintained in a controlled environment and were their own control. The microbial profile and the fermentation end products in the cats on the EXT were similar for both groups (Fig. 2, Table 3). The values obtained for the EXT are highly comparable to those of other studies where healthy cats are also fed an extruded dry cat food(Reference Barry, Wojcicki and Middelbos5,Reference Butowski, Thomas and Young53–Reference Detweiler, He and Mangian55) and reflect normal colon values of cats fed extruded diets (online Supplementary Table 1).
The differences in SCFA abundance and profile between EXT and the mice diets can be considered functionally important. The high production of SCFA and isobutyric acid when EXT was fed relates to the abundance of Prevotella as the dominant genus, a known fermenter of complex carbohydrates(Reference De Filippo, Cavalieri and Di Paola56). In humans, propionic acid production resulting from carbohydrate and protein fermentation is comparable, but total SCFA, acetic acid and butyric acid production is lower from protein fermentation(Reference Aguirre, Eck and Koenen57). The butyryl-CoA:acetate CoA:transferase pathway dominates in omnivores and herbivores for butyric acid production. In carnivores, the butyrate kinase pathway dominates, which produces butyrate from protein(Reference Vital, Gao and Rizzo58). Therefore, the butyric acid production from protein fermentation is possibly not lower than that from carbohydrate fermentation. Because it was shown that proteolytic fermentation renders lower concentrations of SCFA than carbohydrate fermentation(Reference Aguirre, Eck and Koenen57), with the possible exception of butyrate, this partly explains the greater concentration of SCFA in cats fed EXT compared with mice. Certain species of Prevotella have shown to produce succinate in mouse models(Reference De Vadder, Kovatcheva-Datchary and Zitoun59) which could then be metabolised to propionic acid. The concentration of propionic acid was also greater when domestic cats were fed a kibble diet compared with when they were fed a raw diet in a study of Butowski et al. (Reference Butowski, Thomas and Young53). Despite lower NH3, the faecal pH increased when feeding mice, suggesting that the reduction in SCFA was the main cause of the pH increase.
The median relative abundance of Fusobacterium spp., which has been implicated in proteolytic fermentation in vitro (Reference Smith and MacFarlane60), increased when cats were fed the mice diets. It has been associated in humans with liver cirrhosis, appendicitis(Reference Swidsinski, Dörffel and Loening-Baucke61), various oral cavity infections(Reference Bennett and Eley62) and colorectal cancer, where putrescine and histidine pathways were most common(Reference Kaur, Das and Mande63). However, a study of Hooda et al. (Reference Hooda, Vester Boler and Kerr64) showed that kittens stayed healthy, also the kittens with a higher abundance of Fusobacterium after being fed a high-protein, low-carbohydrate diet compared with when kittens were fed a moderate-protein, moderate-carbohydrate diet. The phylum Fusobacteriota has also been observed in healthy dogs(Reference Vázquez-Baeza, Hyde and Suchodolski65). The higher faecal concentrations of putrescine and histamine when fed EXT can indicate that a higher abundance of Fusobacterium does not necessarily mean more proteolytic fermentation and a potential health risk. Fusobacterium spp. is one of the bacterial genera that produce butyric acid through catabolism of glutamate and lysine(Reference Anand and Kaur66). Butyric acid has many beneficial functions(Reference Rivière, Selak and Lantin67), but these may be reduced when it is produced through protein fermentation: butyric acid uptake in the colonocytes is decreased because NH3 generates inflammation and, therefore, butyric acid transporter expression is reduced(Reference Villodre Tudela, Boudry and Stumpff68). Colonocyte proliferation can also be decreased by p-cresol due to inhibition of cell respiration(Reference Andriamihaja, Lan and Beaumont69). The higher NH3 and p-cresol concentrations in faeces from cats fed EXT implies that there was more proteolytic fermentation compared with the mice diets.
The higher total BA concentrations, except for agmatine and tyramine, confirm the higher proteolytic fermentation on the extruded diet. Arginine decarboxylase can convert arginine (highest in the mice diets) to agmatine with agmatinase able to further convert agmatine into putrescine. The putrescine:agmatine ratio can be an indicator for agmatinase and was, therefore, calculated. It clearly shows that the conversion by this enzyme was greater when cats were fed EXT than when they were fed the mice diets. This ratio was also numerically greater when cats were fed MM compared with cats fed WM. Because lipopolysaccharide induces a dose-dependent stimulation of agmatinase whilst it decreases arginine decarboxylase(Reference Sastre, Galea and Feinstein70), this finding could indicate that a finer structure and processing leads to increased inflammatory compounds.
Tyrosine is the precursor of p-cresol and tyramine. This amino acid was higher in the mice diets than in EXT but not of a magnitude that can explain the large increase in tyramine and especially not the drop in p-cresol. Certain strains that belong to Coriobacteriaceae can produce phenol and p-cresol, and certain strains of Fusobacteriaceae and Clostridium sensu stricto 1 can produce phenol(Reference Saito, Sato and Nomoto45). The cats fed EXT had a greater median relative abundance of Coriobacteriaceae compared with cats fed WM, which supports the theory of more proteolytic fermentation. In contrast, there was a greater median relative abundance of Fusobacteriaceae in the mice diets and Clostridium sensu stricto 1 in the MM diet, which is in line with the observed phenol concentrations.
Cadaverine is used by bacteria to protect themselves against acidic pH(Reference Samartzidou, Mehrazin and Xu71,Reference Moreau72) and is formed by direct decarboxylation of L-lysine. Despite the higher lysine concentration in the mice diets, the faecal concentration of cadaverine was greater when cats were fed EXT. In addition, BCFA, which were significantly higher when cats were fed EXT, are produced exclusively through the fermentation of branched-chain amino acids and therefore reliable markers of proteolytic fermentation(Reference Diether and Willing73). In humans, BCFA, NH3, indoles and phenols have been associated with increased colon cancer(Reference Norat and Riboli74) and ulcerative colitis(Reference Ramakrishna, Roberts-Thomson and Pannall75). The mice clearly had a protective effect against the overall production of BA, suggesting a large effect of animal fibre as a chemical component, but the difference between MM and WM was mainly numerical, which suggest a limited protective effect of food structure against proteolytic fermentation.
The standardised amino acid digestibility of mice using the precision-fed cecectomised rooster assay(Reference Kerr, Kappen and Garner76) was, for most amino acids, higher than the apparent ileal amino acid digestibility of dogs fed an EXT diet(Reference Muir, Murray and Fahey77–Reference Hendriks, Thomas and Bosch79) (online Supplementary Table 2). The apparent ileal amino acid digestibility is strongly correlated with the apparent ileal N digestibility(Reference Hendriks, Van Baal and Bosch80). Therefore, we may assume that part of the CP content of mice is more digestible than the CP content of EXT. Another part of the CP content of the mice diets is the poorly digestible animal fibre protein. This protein may act as poorly fermentable insoluble fibre, hence reducing fermentation, which is not present in the EXT diet that has a lower CP content than mice. In addition, the non-digested fractions of EXT may be more fermentable than that of mice.
As mentioned above, most animal fibre sources in prey, such as hair, skin and bone, seem to reduce fermentation, similar to insoluble plant fibres such as cellulose(Reference Depauw, Bosch and Hesta81). In addition, Depauw et al.(Reference Depauw, Hesta and Whitehouse-Tedd16) showed in cheetahs that feeding whole rabbit resulted in higher A/P compared with when feeding supplemented beef, which is associated with slower fermentation rates due to dietary insoluble fibre(Reference Sunvold, Fahey and Merchen17). The reduction in faecal concentrations of NH3, SCFA and BCFA (except isovaleric acid) and the higher A/P when switching from an EXT to a mice diet agrees with that mechanism. This means that the fermentation rate by intestinal microbiota was slower because most animal fibres act as insoluble fibres(Reference Depauw, Hesta and Whitehouse-Tedd16,Reference Sunvold, Fahey and Merchen17) or because of a lack of fermentable carbohydrates as an energy source for the microbiota. The lower rate of protein fermentation seen in the study of Depauw et al. (Reference Depauw, Hesta and Whitehouse-Tedd16) was possibly due to the physical barrier between bacteria and substrate.
Besides the differences in digestibility, there is also the difference in macronutrient composition of the EXT diet compared with the mice diets. Consequently, the fermentable substrates available for the gastrointestinal microbiota for fermentation is altered(Reference Depauw, Hesta and Whitehouse-Tedd16,Reference Depauw, Bosch and Hesta81) . This will impact microbiota population as was also seen in a study of Kerr et al. (Reference Kerr, Dowd and Swanson82). We acknowledge that the gut microbiota might not have been stable at the time of sampling, but it was already possible to demonstrate remarkable differences. Richness is typically perceived as a positive trait, and the decrease in richness when cats were fed mice could suggest that this diet is less optimal. However, carnivores have a lower microbial diversity than herbivores and omnivores, and the diversity also depends on the variety of the diet(Reference Reese and Dunn83). Because the cats were only fed mice for a period of time, without added plant fibres, this can explain the decrease in richness. The difference in microbiota between the EXT and the mice diets cannot be attributed to any single factor or nutrient but only to the entire diet. Despite the mice diet having a similar macronutrient profile to the diet estimated for feral cats(Reference Plantinga, Bosch and Hendriks6), further research is necessary to investigate if variation in prey will influence intestinal fermentation. Additionally, the nutrient uptake from whole prey diets needs to be explored and to what extent animal fibre need to be included in a carnivore’s diet to ensure the best health effect.
In conclusion, the comparison between cats consuming whole v MM demonstrated a lack of effect on digestibility and the MUET. The microbial profile was comparable between MM and WM, and there were mainly numerical differences in the fermentation end products that would indicate a protective effect of food structure against proteolytic fermentation. We postulate, from the marked reduction in proteolytic fermentation products in our study when shifting from an extruded to mice diet, that part of the CP of mice is more digestible than that of EXT and that the animal fibres in prey such as mice can protect against harmful protein fermentation. Another possible explanation is that there are insufficient fermentable carbohydrates that can be used as an energy source when consuming mice leading to an overall reduction in metabolic activity of the large intestinal microbiota. These findings can be used to optimise processing conditions in pet foods but may warrant further investigations in the health support function of food structure in all species, including humans.
Acknowledgements
The authors would like to thank the personnel of the feline unit of the research facility Carus, Wageningen University for their help during the study and the personnel of Laboratory of Animal Nutrition and Animal Product Quality (LANUPRO), Ghent University, for the assistance with laboratory work.
This study was funded by the Research Foundation – Flanders (grant number 1S72019N) and Wageningen University & Research. Research Foundation Flanders had no role in the design, analysis or writing of this article. Wageningen University & Research provided the test infrastructure and performed part of the analyses.
Conceptualization: S. M-T. J. D., G. B., G. P. J. J.; Data Curation: S. M-T. J. D., G. B., M. S., A. C., A. A. M. J. B., G. P. J. J.; Formal Analysis: S. M-T. J. D., A. C., A. A. M. J. B., G. P. J. J.; Funding Acquisition: W. H. H., G. P. J. J.; Investigation: S. M-T. J. D., G. B., M. S., G. P. J. J.; Methodology: S. M-T. J. D., G. B., G. P. J. J.; Project Administration: S. M-T. J. D., G. B., G. P. J. J.; Resources: S. M-T. J. D., G. B., W. H. H., G. P. J. J.; Software: A. C., A. A. M. J. B.; Supervision: S. M-T. J. D., G. B., G. P. J. J.; Validation: S. M-T. J. D., G. B., A. C., A. A. M. J. B., G. P. J. J.; Visualization: S. M-T. J. D., G. B., A.C., A. A. M. J. B., W. H. H., G. P. J. J.; Writing - Original Draft: S. M-T. J. D., G. B, A. C., A. A. M. J. B., W. H. H., G. P. J. J.; Writing - Review & Editing: S. M-T. J. D., G. B., A. C., A. A. M. J. B., W. H. H., G. P. J. J.; All authors read and approved the final version of the manuscript. The authors declared that they have no conflict of interest.
Supplementary material
For supplementary material/s referred to in this article, please visit https://doi.org/10.1017/S0007114523002039


