


Refeeding syndrome is a potentially fatal condition caused by rapid or excessive administration of feeding, whether oral, enteral or parenteral, after a period of relative or absolute starvation(Reference Weinsier and Krumdieck1). A constellation of metabolic disturbances with the development of severe fluid and electrolyte imbalances, along with neurological, pulmonary, cardiac, neuromuscular and haematological complications, could result from the refeeding syndrome(Reference Solomon and Kirby2, Reference Mehanna, Moledina and Travis3). Hospitalised patients are those most at risk of developing this problem, while the true incidence remains unknown.
The hallmark biochemical feature of the refeeding syndrome is hypophosphataemia, but the syndrome may also feature abnormal Na and fluid balance, hypokalaemia, hypomagnesaemia, and changes in glucose, protein and fat metabolism(Reference Klein, Stanek and Wiles4). Carbohydrate metabolism requires thiamin that is not stored in large amounts in the body, hence heart failure and encephalopathy secondary to thiamin deficiency may be precipitated by refeeding(Reference Solomon and Kirby2, Reference Mehanna, Moledina and Travis3). These features are often subtle before initiation of feeding, but once feeding is started, these may escalate into life-threatening biochemical abnormalities with major fluid and electrolyte shifts(Reference Mehanna, Moledina and Travis3). Morbidity and mortality from the refeeding syndrome may be significantly reduced if reliable predictive markers could be identified. The evidence base for predicting the refeeding syndrome is poor and consists mainly of cohort studies, case series and consensus expert opinion(5). It is not surprising therefore that the UK National Institute of Clinical Excellence (NICE) guidelines on the identification of patients at high risk of refeeding problems include recommendations based on expert opinion and ‘good clinical practice’(6). The difficulty in predicting those at high risk is further compounded by the need for a thorough and precise history obtained from the patient, spanning the preceding 3–6 months. Hospitalised patients may often be either too confused or simply unable to provide an accurate history. The NICE criteria also have the potential to identify a number of patients as at risk when they may not be, thus delaying the establishment of full nutritional support.
The well-known case of a healthy performance artist who did not consume any energy for 44 d revealed that while most of his biochemical measurements were unchanged before refeeding, there were striking alterations in leptin and insulin-like growth factor 1 (IGF1) concentrations(Reference Korbonits, Blaine and Elia7). This is not surprising as several nutritional factors regulate leptin and IGF1 production(Reference Villanueva and Myers8, Reference Nindl and Pierce9). Both decline significantly in conditions of starvation(Reference Korbonits, Blaine and Elia7), through potentially independent mechanisms(Reference Gómez, Maravall and Gómez10). Our hypothesis was that concentrations of leptin and IGF1 decline more significantly in patients who are at risk of the refeeding syndrome, and that, together, leptin and IGF1 could provide a useful ‘refeeding index’ (RI) as a predictive tool for this potentially serious and difficult to diagnose condition.
Materials and methods
Between January and April 2009, new inpatients referred to our team for initiation of parenteral nutrition (PN) were recruited. Exclusion criteria comprised patients who were on oral or enteral feeding at the same time as when the parenteral feed was started, as well as those who had already been commenced on PN before being referred to us. None of the patients received dextrose or Ca infusions with PN. The total number of patients eligible for the present study was thus thirty-five. The present study was conducted according to the guidelines laid down in the Declaration of Helsinki, and all procedures involving patients were approved by the King's College Hospital Ethics Committee (Denmark Hill, London, UK). Verbal informed consent was obtained from all patients, and this was witnessed and formally recorded. The study has been registered in the ClinicalTrials.gov registry. The registration number is NCT01227850. Routine blood samples were taken between 06.00 and 09.00 hours in the morning before initiation of PN. Patients were assessed for nutritional status to determine whether or not they were malnourished, according to the NICE guidelines(6), while nutritional intake and the number of days a patient was nil by mouth (NBM) were recorded. The Schofield equation(Reference Schofield11) was used to estimate BMR and adjusted for activity and stress to give the approximate energy requirements(Reference Dewar, Horvath, Todorovic and Micklewright12). Patients were identified to be at ‘high risk’ of developing refeeding problems according to the guidelines set out by the NICE(6) for identifying such patients. These patients were started on 25 % of their daily energy requirements for the first 48 h with gradual increase to meet or exceed requirements by 4–7 d. Patients who were NBM for more than 5 d or clinically malnourished according to the NICE guidelines (either BMI < 18·5 kg/m2 or unintentional weight loss >10 % within the last 3–6 months, or BMI < 20 kg/m2 and unintentional weight loss >5 % within the last 3–6 months)(6) were commenced on 50 % of their daily energy requirements for the first 48 h(6). Feeding rates were then increased to meet the nutritional needs, provided the patients did not show a significant decrease in phosphate, K or Mg. Kabiven® PN bags or part bags (Fresenius Kabi Limited, Runcorn, Cheshire, UK) were selected based on each patient's energy requirements with the addition of electrolytes, vitamins and minerals as required either in the PN bag or as separate infusions.
Blood tests were repeated daily between 08.00 and 09.30 hours, for at least a week once PN was started. Samples were analysed for electrolytes (including phosphate, K or Mg), liver and renal function on the Advia 2400 (Siemens Healthcare Diagnostics, Camberley, Surrey, UK). Patients were subsequently followed up for a period of 1 month to determine mortality.
Insulin-like growth factor 1 and leptin measurements
Serum was separated and stored frozen at − 20°C. IGF1 was analysed using an immunochemiluminescent assay run on the Immulite 2000 (Siemens Healthcare Diagnostics). The intra- and inter-assay CV were less than 8 %. Since the lowest limit of detection for the IGF1 assay was 25 μg/l, we considered any value of less than this for purposes of analysis as 25 μg/l. Leptin was measured using an ELISA kit (Diagnostic Systems Laboratories, Inc., Webster, TX, USA). The intra-assay CV for leptin was less than 5 % at all concentrations.
Deriving the ‘refeeding index’
Age- and sex-unified mean values for leptin and IGF1 were calculated from reference ranges used in our laboratory(Reference Brabant, von zur Mühlen and Wüster13, Reference Unal, Eskandari and Muşlu14). This was done by deriving the means of the given age- and sex-adjusted reference ranges for each analyte, and then by calculating their mean values. This value was 21 μg/l for leptin and 134 μg/l for IGF1. The product of these two numbers is 2800 (rounded to two significant figures), which forms the basis for the denominator to derive a ‘RI’, defined as the product of leptin and IGF1 divided by 2800; in well-nourished patients, this should give a value of approximately 1·0. This index was therefore derived in a similar way to the homeostatic model assessment for insulin resistance index, which is based on multiplying the glucose concentration by the insulin concentration and then dividing by a factor (product of mean glucose and insulin values), which normalises to 1·0(Reference Holzinger, Kitzberger and Fuhrmann15).
Statistics
Statistical analysis was conducted using ‘Analyse-It’ version 2.21 (Analyse-It Limited, Leeds, UK). Receiver-operator curves were constructed; hence, sensitivity and specificity were obtained for each of IGF1, leptin and RI against a ≥ 30 % phosphate drop as well as against death within 1 month of starting PN.
As the leptin and IGF1 data were not normally distributed, non-parametric statistical tests were used for all data analyses. The Mann–Whitney test was used to determine the relationship between IGF1, leptin and the RI and other variables such as patient's sex, days NBM ≥ 5 d, whether or not a patient was clinically malnourished and mortality. The Kruskal–Wallis ANOVA test was used to assess the association of the afore-mentioned parameters, as well as death, against patient location and estimated glomerular filtration rate, which consisted of three categories as given in Table 1. The association of the three parameters (IGF1, leptin and the RI) with age was determined using the Spearman rank correlation test, while Fisher's exact test was used to compare phosphate drop with mortality, whether a patient was malnourished and NBM ≥ or < 5 d.
Table 1 Summary of the patient data
ITU, intensive treatment units; GFR, glomerular filtration rate.
Results
Demographics and clinical evaluation
A total of thirty-five patients, nineteen males and sixteen females, mean age 53 (sem 3·29; range 18–83) years, were included in the present study. Of these patients, thirteen were admitted to a liver intensive treatment unit, five to other intensive treatment units and seventeen patients were from various non-intensive therapy wards.
We identified seven patients as at ‘high risk’ of refeeding problems. In total, eleven patients were NBM for 5 d or more, while four other patients had an unclear energy intake for the weeks preceding admission. After clinical examination, fifteen patients were deemed to be malnourished, while five other patients were difficult to categorise, based on vague history and inconclusive clinical evaluation.
Table 1 demonstrates that eight patients died (five from liver intensive treatment unit, two from general wards and one from other intensive treatment units); seven patients died within 10–14 d of initiation of PN, while one died 4 weeks after PN was started. None of the patients developed clinical features of the refeeding syndrome.
Electrolyte trends
Despite supplementation of phosphate, K or Mg in anticipation of suspected decreases after starting PN, we observed phosphate concentrations decreasing significantly between 12 and 36 h of starting PN in nine patients. The phosphate decrease in these patients was observed to be >30 % and fell below the lower limit of our laboratory's reference range of 0·80 mmol/l in all nine patients. The other patients had either no decrease of phosphate or a ≤ 21 % decrease. Of the nine patients who exhibited a significant decrease in phosphate, five were identified before starting PN as at risk of the refeeding syndrome based on either being NBM for ≥ 5 d and/or being malnourished on clinical assessment. On the other hand, fourteen patients who were defined as either clinically malnourished(6) and/or NBM for ≥ 5 d showed no significant decrease in their phosphate concentrations after starting PN. Table 2 shows the mean values and standard deviations of phosphate concentrations for all patients and for patients who died, before and after starting PN, with those who had a significant decrease in serum phosphate compared with the group with no significant decrease. K, Mg and Na showed minimal variations in the week following initiation of PN.
Table 2 Comparison of phosphate concentrations in all patients v. those who died, with either a ≥30 % or a <30 % drop in phosphate before and after starting parenteral nutrition (PN), against the refeeding index measured before starting PN†
(Mean values, standard deviations, ranges and number of patients)

* Mean values were significantly different (P < 0·05; t test).
† Reference interval for phosphate is 0·80–1·40 mmol/l.
Leptin, insulin-like growth factor 1 and the refeeding index
Table 3 shows the results for leptin, IGF1 and the RI (calculated from the first two parameters as described earlier in the Materials and methods section). Relevant clinical details for each patient are also given in this table. Receiver-operator curves plotted against a ≥ 30 % phosphate drop showed that the RI had the greatest area under the curve compared with IGF1 or leptin alone (0·75 v. 0·64 and 0·65, respectively; 95 % CI 0·55, 0·94; P 0·006), as indicated in Fig. 1. The cut-off value for the RI, which conveys the best sensitivity and specificity for a significant decrease in phosphate, is 0·19, with a likelihood ratio of 3·4. At this cut-off value, the sensitivity is 78 % (95 % CI 40, 97 %), the specificity is 77 % (95 % CI 60, 90 %), and the positive and negative predictive values for the occurrence of a ≥ 30 % phosphate drop are 54 and 91 %, respectively.
Table 3 Clinical details of individual patients, as well as results for insulin-like growth factor 1 (IGF1), leptin, the refeeding index (RI) and those who had a ≥30 % phosphate drop on day 2 or 3 of starting parenteral nutrition
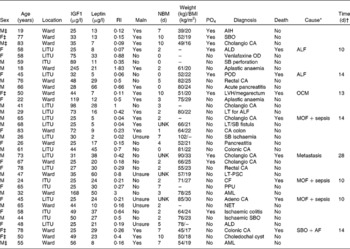
Maln, malnourished; NBM, nil by mouth; PO4, phosphate drop of >30 %; M, male; AIH, autoimmune hepatitis; F, female; SBO, small-bowel obstruction; CA, cancer; LITU, liver intensive care unit; ALD, alcoholic liver disease; ALF, acute liver failure; OD, overdose; SB, small bowel; ITU, other intensive care units; POD, paracetamol overdose; LVH, left ventricular hypertrophy; OCM, obstructive cardiomyopathy; LT, liver transplant; MOF, multiorgan failure; UNK, unknown; PSC, primary sclerosing cholangitis; CF, cystic fibrosis; PPU, perforated pyloric ulcer; AML, acute myeloid leukaemia; NET, neuroendocrine tumour; AF, atrial fibrillation.
* Cause of death as documented in the death certificate.
† Time of death from starting parenteral nutrition.
‡ The patients who were identified as being at ‘high risk’ of refeeding problems.
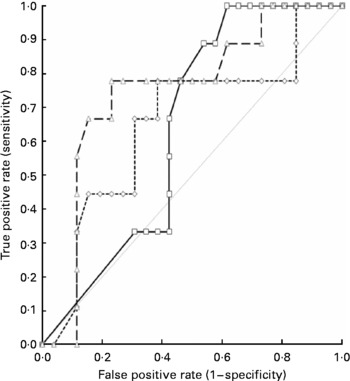
Fig. 1 Receiver-operator curves showing the area under the curve (AUC) for the thirty-five patients, when the outcome of the phosphate drop of >30 % on days 2–3 of starting parenteral nutrition is tested against insulin-like growth factor 1 (IGF1, –□–), leptin (–-◇–-) and the ‘refeeding index’ (RI, –△–), which employs the former two parameters. The AUC for IGF1 is 0·64, for leptin is 0·65 and for the RI is 0·75, indicating the superiority of the RI over IGF1 or leptin alone in predicting the occurrence of refeeding problems. ![]() , No discrimination.
, No discrimination.
Receiver-operator curves plotted against death within 1 month of starting PN showed that IGF1 had the greatest area under the curve compared with either leptin or the RI (0·79 v. 0·62 and 0·75, respectively; 95 % CI 0·64, 0·94; P < 0·0001), as indicated in Fig. 2. The cut-off value for IGF1, which conveys the best specificity and sensitivity for the occurrence of death, is 33 μg/l, with a likelihood ratio of 2·6. At this cut-off value, the sensitivity is 88 % (95 % CI 47, 99·7 %) and the specificity is 67 % (95 % CI 46, 84 %).
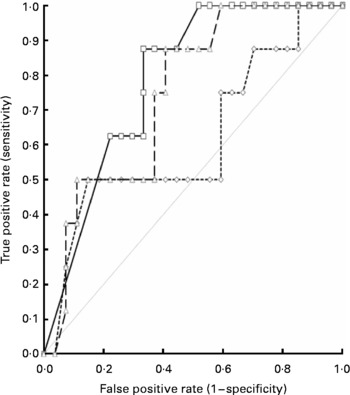
Fig. 2 Receiver-operator curves showing the area under the curve (AUC) for the thirty-five patients, when the outcome of death within 1 month (eight patients) of starting parenteral nutrition (PN) is tested against insulin-like growth factor 1 (IGF1, –□–), leptin (–-◇–-) and the ‘refeeding index’ (RI, –△–), which employs the former two parameters. The AUC for IGF1 is 0·79, for leptin is 0·62 and for the RI is 0·75, indicating that IGF1 alone is superior over leptin or the RI in predicting the occurrence of death. Note that seven out of eight patients died within the first 2 weeks of starting PN. ![]() , No discrimination.
, No discrimination.
Other correlations
There was no significant association between the values of either IGF1 or the RI and the presence of malnourishment, but leptin was significantly lower in those who were defined as being malnourished as opposed to others (mean leptin was 16·1 (sem 4·0) v. 28·3 (sem 3·1) μg/l, respectively; P = 0·004). There were no significant correlations between the measured analytes (IGF1 and leptin) and, therefore, the RI and patient's sex, age, location or estimated glomerular filtration rate. A low RI, on the other hand, was significant regarding ≥ 5 d NBM (P = 0·04). There was no significant correlation between a decrease in phosphate of ≥ 30 % and whether a patient was clinically malnourished, the number of days NBM before starting PN, estimated glomerular filtration rate, patient's location, age or sex. Mortality was also not found to be significantly related to the latter variables but was significantly associated with a phosphate drop of ≥ 30 % (P = 0·004). IGF1 was not found to be correlated with C-reactive protein but was correlated with albumin concentrations (95 % CI 0·21, 0·72; P = 0·0017). Leptin did not correlate with either.
Discussion
We demonstrate, for the first time, that the ‘RI’, formulated from leptin and IGF1 concentrations, may predict a decrease in phosphate as observed in the refeeding syndrome, following the initiation of PN, and is a more powerful tool than either IGF1 or leptin alone. It therefore appears that a combination of a significantly low IGF1 and leptin presents a biochemical hallmark for predicitng the refeeding syndrome.
Refeeding syndrome is commonly underdiagnosed and may present with minimal clinical indicators that could easily be masked by a multitude of pre-existing medical problems in hospitalised patients. Moreover, criteria for the identification of patients at high risk of developing this syndrome are based on a history from patients or relatives, which is often equivocal, difficult to obtain and plagued with subjectivity. Even though the nutritional state of the patient can be estimated through history and clinical examination, we have shown in the present study that the number of days NBM and clinical signs of malnutrition, unlike the RI, are not significantly associated with a decrease in phosphate concentrations. These findings suggest that history and clinical assessment may be suboptimal predictive tools of the refeeding syndrome. This problem is compounded by the fact that electrolyte imbalances before initiating feeding are often minimal(6) as we have demonstrated.
Significant reduction in phosphate concentrations after initiation of feeding appears to be the most reliable biochemical marker that the refeeding syndrome has occurred(Reference Marvin, Brown and Portlock16–Reference Adkins18). This reduction was observed in approximately 26 % of our patients, consistent with the incidence reported in the literature that varies between 18 and 34 %(Reference Martinez, Matrinez and Montero17, Reference Marik and Bedigan19). It is important to note that the acute decrease in serum phosphate observed was despite additional phosphate supplementation, in those predicted to develop the refeeding syndrome(6). Moreover, only four patients had an initial phosphate concentration below the reference interval (0·80–1·40 mmol/l) before feeding; the lowest concentration in these patients was 0·65 mmol/l.
An interesting finding was the relationship between low IGF1 values and mortality; IGF1 alone being superior to the RI denotes that leptin is not as strongly linked to death. The cause of death for the majority of these patients was single or multiple organ failure. None of them had clinical signs of the refeeding syndrome; although such metabolically compromised patients may have had subclinical refeeding syndrome, which could have tipped the delicate balance irreversibly. Another explanation could be that patients with organ failure, particularly liver failure, would be more prone to have lower concentrations of IGF1. The patient's location on a liver intensive care unit was not found to be significantly associated with mortality, suggesting that liver failure alone would not account for the present findings. Moreover, the fact that a decrease in phosphate of ≥ 30 % was significantly linked to mortality denotes that the refeeding syndrome may have played a role in these patients before death; though this syndrome remains clinically difficult to recognise.
Previous reports have observed the association of low IGF1 concentrations with cell death(Reference Sanchez, Oskowitz and Pochampally20). The IGF1 signalling pathway has been established as a key modulator of ageing and longevity(Reference Laron21). Yet, conflicting evidence surrounds the effect of a low IGF1 on death, as lifelong IGF1 deficiency causes early ageing, but not premature death(Reference Laron21). Specifically, in the cardiovascular system, heart failure has been associated with reduced local expression of IGF1(Reference Hambrecht, Schulze and Gielen22), denoting a cardioprotective role of IGF1, with low concentrations being detrimental to cardiac function. Moreover, a link between IGF1 and morbidity in hospitalised patients has previously been suggested, and it has been found to be one of the predictors of survival in cancer patients on palliative care(Reference Sullivan and Carter23, Reference Fouladiun, Körner and Bosaeus24). Although IGF1 has been suggested to be a marker of the acute inflammatory response, particularly following surgery(Reference Holdaway, Lethaby and Mason25), we did not find a correlation between IGF1 and acute-phase reactants such as C-reactive protein in our patient cohort. However, a significant correlation has been found between IGF1 and albumin concentrations, suggesting that other factors besides inflammation can influence IGF1, most notably protein–energy undernutrition(Reference Sullivan and Carter23).
Despite abiding by the recommended guidelines(6, Reference Dewar, Horvath, Todorovic and Micklewright12) for electrolyte replacement during PN in those suspected to be at risk of refeeding, a decrease in phosphate of ≥ 30 % occurred in several of our patients, even though only four patients had a low serum phosphate before starting PN. There remains a lack of clear guidance on effective management of potential refeeding syndrome. The decrease in phosphate in patients who were not identified to be at risk of the refeeding syndrome may be explained by the lack of additional supplemented phosphate and the normal rate of intravenous administration of the prescribed PN. The use of the RI may therefore help to identify more subtle cases and hence avoid the repercussions of inappropriate feeding or insufficient electrolyte replacement.
The main limitation of the present study was the relatively small study population, and hence further work is warranted in order to create better defined cut-off values for the RI to improve its positive predictive value by using more sensitive IGF1 assays and employing a larger study population. Other limitations were the inability of our IGF1 assay to accurately quantify concentrations below 25 μg/l and the fact that age- and sex-unified values of IGF1 and leptin were employed to obtain a single factor to calculate the RI. The latter would be particularly affected by the IGF1 values since it was derived from a larger set of reference ranges influenced by both age and sex; thus, expansion of our work is needed to create age- and sex-tailored cut-off values that could introduce greater sensitivity and specificity to the RI. However, the value of the RI in the present study was found to be surprisingly unaffected by age and sex on statistical analysis. It must also be acknowledged that there is still no ‘gold standard’ for defining the refeeding syndrome, and thus a significant decrease in phosphate is currently the best surrogate marker to be used as a benchmark for further studies on the RI(Reference Marvin, Brown and Portlock16–Reference Adkins18).
The present findings suggest that the ‘RI’ as a normalised product of IGF1 and leptin is a novel and specific marker that can be helpful in identifying patients before starting PN who are at risk of developing the refeeding syndrome.
Acknowledgements
We would like to thank Tracy Dew from the clinical biochemistry team at King's College Hospital, for her technical assistance in some parts of the present study. The authors declare that there is no conflict of interest. The present study received no specific grant from any funding agency in the public, commercial or not-for-profit sectors. The contribution of each author was as follows: M. O. E. supervised the design of the study, collection and analysis of the data and writing of the manuscript. J. A.-Z. and C. W. l. R. were responsible for the experimental design, editing of the manuscript and provision of significant consultation. C. M. edited the manuscript and provided significant consultation. R. S. and M. A. A. were involved in the statistical analysis of the data and editing of the manuscript.


