Introduction
A biogeographic distribution may include flux and directional shift components, as well as accounts of major ecosystem attractants and deterrents with respect to species’ occurrences. Cetacean researchers continue to value opportunistic or incidental data in documenting occurrences, given the paucity of information about many species and the impediments to undertaking designed quantitative surveys (e.g. Santillan, Reference Santillan2011; Foote et al., Reference Foote, Kuningas and Samarra2014; Reinhart et al., Reference Reinhart, Fortune, Richard and Matthews2014; Accardo et al., Reference Accardo, Ganley, Brown, Duley, George, Reeves, Heide-Jorgensen, Tynan and Mayo2018; Gibson et al., Reference Gibson, Williams, Dunlop and Beck2020). Incidental sightings vary from point-location ‘first records’ of a single animal (e.g. Accardo et al., Reference Accardo, Ganley, Brown, Duley, George, Reeves, Heide-Jorgensen, Tynan and Mayo2018; Towers et al., Reference Towers, Pilkington, Mason and Mason2022) to, collectively numerous individuals of various resident species over very large areas (Delefosse et al., Reference Delefosse, Rahbek, Roesen and Clausen2018). Extensive routine sightings have been documented in recent decades for many marine ecosystems, but the number of unusual opportunistic sightings is relatively small. Even a few novel or ‘first record’ opportunistic data can be particularly informative about ecosystem influences on organisms.
Structured seasonal-spatial patterns of use by an individual provide evidence of well-developed ‘fidelity’ to a geographic area, including the use of particular prey resources. Incorporating observation effort into fidelity studies helps determine, for example, whether an animal chooses to frequent a particular area, or is seen more in the area because more potential observers are present. Generally, effort considerations do not accompany presentations of opportunistic especially novel data, leaving investigators to couch reporting in greater uncertainty or diminish the contributions of their work to understanding fidelity. This effect need not be the end state (e.g. Ochoa-Pachas, Reference Ochoa-Pachas2021); although opportunistic data tend to fall in the qualitative domain, many of these data can also be standardized and often calibrated by quantitative means, providing additional valuable information (Bain et al., Reference Bain, Wayne and Bencini2014). Qualitative determinations of area-specific effort draw heavily on Purposeful or Purposive sampling (also Judgmental or Authoritative) (Explorable.com, 2009; Lopez and Whitehead, Reference Lopez, Whitehead, Schneider and Whitehead2013; Palinkas et al., Reference Palinkas, Horwitz, Green, Wisdom, Duan and Hoagwood2013) where, from a body of potential observers, the investigator selects one or more who have substantial knowledge of area usage (information-rich).
In the contexts of biogeographic change and fidelity, scattered public accounts have reported sightings of a killer whale (Orcinus orca, ‘orca’) in the greater Gulf of Maine (GoM, Figure 1) from time to time in recent years. It is unusual to see killer whales in most areas of the NW Atlantic Ocean, especially the GoM (Forney and Wade, Reference Forney, Wade, Estes, Demaster, Doak, Williams and Brownell2006). Extended groups, thought to be tiny, may number no more than 10–12 individuals but inhabit 10,000s km2 of ocean (e.g. COSEWIC, 2008). As a consequence, sparse scientific information exists for killer whales in the region, despite the conservation designation ‘special concern’ for eastern Canadian waters (COSEWIC, 2008). Conservationists face a comparable situation for eastern USA waters (NOAA, Reference Waring, Josephson, Maze-Foley and Rosel2015). Jourdain et al. (Reference Jourdain, Ugarte, Vikingsson, Samarra, Ferguson, Lawson, Vongraven and Desportes2019) declare that there is an urgent need to collect data on killer whales off NE North America.

Figure 1. Terrain map of the greater Gulf of Maine highlighting major marine sub regions, selected seascape features and adjacent land jurisdictions. Ocean letter codes/symbols: CC, Cape Cod; CM, Coastal Maine; GB, Georges Bank; OF, Outer Fundy; SS, Scotian Shelf; straight lines, sub region boundaries. West boundaries of OF and SS approximate Canada–US international boundary. Seascape/select subunit codes: gb, German Bank; gm, Grand Manan; n/i, Digby neck and islands; ns, Nantucket Shoals; sb, Stellwagen Bank. Land letter codes, states/provinces: NS, Nova Scotia; NB, New Brunswick; Me, Maine; Ma, Massachusetts. Inset credit, anonymous German tourist.
As the first objective, this study formulates a qualitative image-based approach to establishing cetacean sightings’ effort at an ecosystem scale, here the Gulf of Maine. In parallel I investigate sightings of the killer whale indicated previously, and propose that they represent a rare example (without effort) of unusually high long-term consistency. The synthesis uses opportunistic observations, reported mainly by recreational mariners and commercial fishers, incorporated into data manipulations anonymously. Adding effort using the qualitative approach, I then investigate the hypothesis that the killer whale sightings constitute seasonal-spatial fidelity to the greater GoM, the first documentation of fidelity patterns in the western Atlantic hemisphere. Analyses include a validity test of sightings’ activity importance in relation to effort, and comparisons to frequency distributions of single killer whales in the GoM in the historical past as a baseline, i.e. post World War II ‒ a landmark event of great stress to whales generally (e.g. Trumble et al., Reference Trumble, Norman, Crain, Mansouri, Winfield, Sabin, Potter, Gabriele and Usenko2018). The possibility of killer whale fidelity, such as seasonal migratory movements, in the NW Atlantic has been raised repeatedly (Mitchell and Reeves, Reference Mitchell and Reeves1988; Reeves and Mitchell, Reference Reeves and Mitchell1988; Lawson and Stevens, Reference Lawson and Stevens2014; Matthews and Ferguson, Reference Matthews and Ferguson2014), and hinted at by several apparent re-sightings of a few recognizable individuals (anonymous reviewer, personal communucation).
Finally, the fidelity analysis reveals a substantial spatial anomaly in the recent sightings data for the northeastern GoM (Figure 1). Observations (Melville, Reference Melville2023 and unpub.) suggest mainly a fish-eating habitude for the killer whale in the GoM, with a focus on Atlantic herring (Clupea harengus). An explanation for the emergent anomaly is pursued by analyses of indicators of the availability of herring [fisheries landings, Atlantic puffin (Fratercula arctica) chick diets] as potential prey in the NE gulf.
Materials and methods
Study system
The greater GoM, covering ~180,000 km2, consists of a semi-enclosed shallow sea bounded by Georges Bank to the south (middle), the west end of the Scotian Shelf (right) and most of the Nantucket Shoals (left) (Figure 1). It has many tidally-mixed areas which distribute incoming nutrients e.g. the Bay of Fundy, making this Large Marine Ecosystem one of the most productive areas of the ocean (Longhurst, Reference Longhurst1990). As a complement, topographic Rossby waves propagating across the continental shelf are thought give rise to the transport of nutrient-laden continental slope water up onto the shelf. The conjunction of polar and subtropical climatic conditions (Longhurst, Reference Longhurst1990) ultimately causes the characteristically dynamic, highly variable circulation. It has supported major fisheries for centuries, for which a great many data exist (e.g. Sosebee, Reference Sosebee2022), although substantial data gaps, inconsistencies and access issues abound. Major migratory predators including sharks, whales and seabirds arrive in pursuit of prey such as herring on a seasonal basis, peaking in abundance in mid-to-late summer (e.g. NOAA, Reference Waring, Josephson, Maze-Foley and Rosel2015; Diamond, Reference Diamond2021). Waters are warmest in the late summer, and coldest in February-March.
Complementary investigation (Melville, Reference Melville2023) shows that the killer whale of record in this study forages in the company of white-sided dolphins (Lagenorhynchus acutus) (Supplementary Figure), known to eat herring as small as ~7.5 cm long (age 1; but usually >18 cm, age ⩾2; Craddock et al., Reference Craddock, Polloni, Hayward and Wenzel2009) on about 25% of sighting days. In addition to Atlantic herring, the observations suggest he probably preys on other small schooling fish in the GoM ‒ Atlantic mackerel (Scomber scombrus) and juvenile Atlantic pollock (Pollachius virens) [and perhaps even sand lance (Ammodytes sp.)]. Similar prey seemed to be the focus for single killer whales occasionally encountered historically in the GoM (e.g. Katona et al., Reference Katona, Beard, Girton and Wenzel1988). As well, he has taken Atlantic Halibut (Hippoglossus hippoglossus) off commercial fishing hooks (J. Peterson, personal communucation) and eaten fishing-bait scraps, although most sightings of the male by commercial fishers do not involve catch-related feeding. Especially notable, on one occasion, without any overt behavioural actions he suddenly captured a Harbour Porpoise (Phocoena phocoena) adjacent a boat (J. Swift, personal communucation). Overall his putative diet, particularly of schooling-fish with emphasis on herring, might include supplements of harbour porpoise (sensu Remili et al., Reference Remili, Dietz, Sonne, Samarra, Rikardsen, Kettemer, Ferguson, Watt, Matthews, Kiszka, Jourdain, Borga, Ruus, Granquist, Rosing-Asvid and McKinney2023) and occasionally other species in the greater GoM.
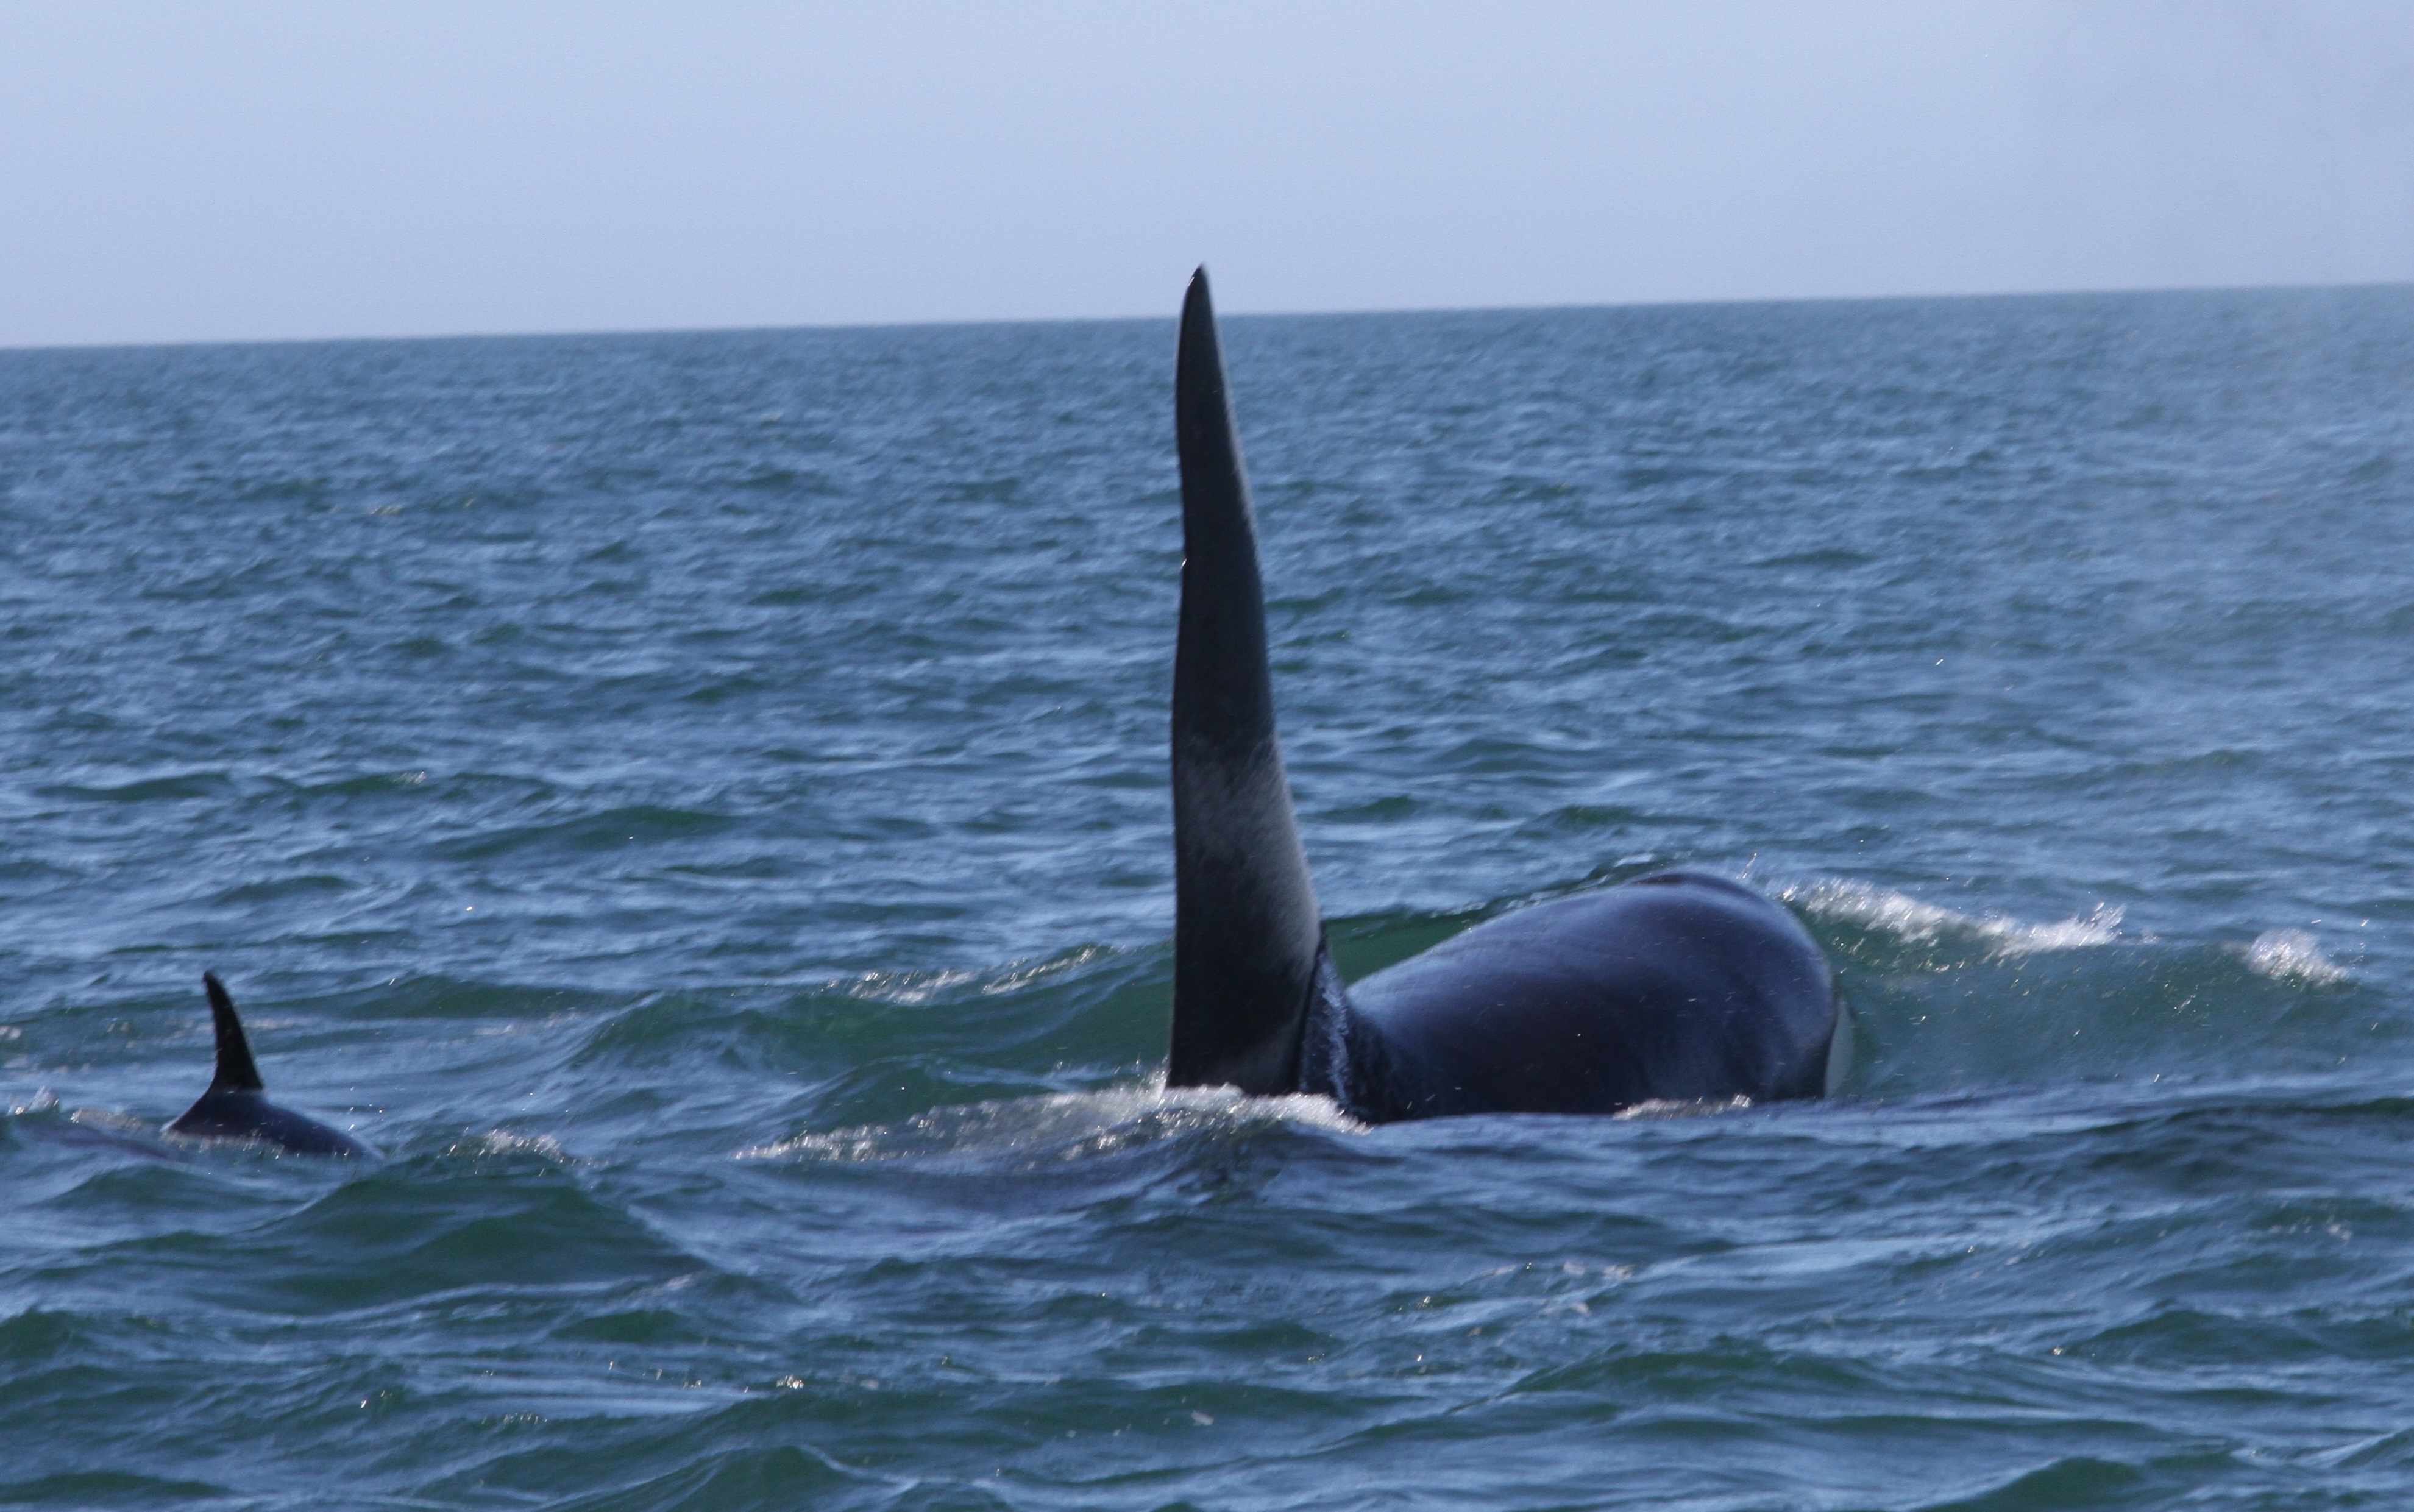
The killer whale, with his unique dorsal fin (Figure 2), has been variously described as active, of reasonable weight, normal colour and in good health. Popular accounts have tended to mention him as being a very large killer whale, but he has grown substantially since I first observed him in 2010. A stand-alone study of his mid life growth and maturation is currently underway, using opportunistic observations from close approaches: this will report precise estimates of some basic biological characteristics (e.g. Melville, Reference Melville2023). Nothing is known about is his social history. Most often people refer to him as ‘Old Thom’ (or similar spelling), other names less so.

Figure 2. The mature male killer whale in the Outer Fundy, showing nick (x) on trailing/posterior edge of upper dorsal fin. Telephoto credit, J. Melville. Inset: putative prey, Atlantic herring, ⩽45 cm long (not to scale), credit NOAA.
Opportunistic effort
I incorporate large-scale opportunistic viewing effort as an index by rating the sighting-potential for five sub regions (Figure 1), each consisting of three subunits, while treating the decade as a single time unit. Ratings (Table 1) vary from high effort = 4 to low effort = 1, while values of 3 and 2 equate to high-moderate and low-moderate respectively. I independently assign a new rating four times per subunit, one for each of the periods January through March, April–June, July–September, and October–December, then sum these seasonal ratings. The ultimate assignment of a subunit rating is determined by one-to-one relational comparisons (two values each) with other ratings within each column (four columns) and across each row (15 rows) (Table 1), resulting in 4{15!/[2!(15-2)!]} = 420 and 15{4!/[2!(2!(4-2)!]} = 90 comparisons respectively (e.g. Hare et al., Reference Hare, Morrison, Nelson, Stachura, Teeters, Griffis, Alexander, Scott, Alade, Bell, Chute, Curti, Curtis, Kircheis, Kocik, Lucey, McCandless, Milke, Richardson, Robillard, Walsh, McManus, Marancik and Griswold2016). The order of determination is: probable 4s, 1s, 3s, then 2s, and includes where appropriate the question, ‘is the overall potential effort re a higher rating substantially more than that represented in a rating one unit smaller, or at least ~5/3 > the latter?’ A fraction facilitates separation of ratings, and 5/3 (e.g. vs 4/3) adds modest protection against overestimation of potential effort in individual sightings. A final index value for a sub region is calculated from the three subunit totals (Table 1). Effort for each sub region is then employed as a proportion of the effort assigned across the whole GoM.
Table 1. Effort index values based on sighting-potential for areas and seasons in the greater Gulf of Maine, as in Figure 1

The data used to assess the maritime activities contributing ‘eyes on the water’ (Table 2), i.e. to potential effort values, initially derive from judgements of the relative importance (re ~spatial-temporal coverage) of major activities within each of the subunits in Figure 1. Heuristically, four major groupings encompass the effort activities, with three possible constituents per group (Table 2). Ideally activities conceptually overlay the subunit terrain or seascapes, with each subunit becoming a terrain-informed image or single-pattern ‘datum’, like a medical x-ray (Melo et al., Reference Melo, Scarpin, Amaro, Passos, Sato, Friston and Price2011). A trained medical professional can diagnose from an x-ray and suggest differential (alternative) possibilities in a matter of seconds (Melo et al., Reference Melo, Scarpin, Amaro, Passos, Sato, Friston and Price2011), through non-analytical reasoning based on experience (Norman et al., Reference Norman, Young and Brooks2007). Time to diagnose is not a consideration in this study, rather it seeks some form of basic image-component articulation as a result for, ultimately, transcription of data between disparate scientific reasoning approaches and accuracy-standard development.
Table 2. Human maritime activities ‒ potential contributors to the designation of observation-effort values, i.e. ‘eyes on the water’, in subunits of the GoM

Inclusion of a major activity in a priority (‘most important’) group is determined in a categorical (yes/no) manner, and the priority group then represents the sightings’ potential for the spatial subunit. The activities (Table 2) are similar to the suits in a deck of playing cards used in the game of poker (CMU, 1992), where the suits share the same importance probability scale. Potential differences in importance ratings between activities are inevitable but the use of the same scale diminishes them. Here, where there might be two most important activities instead of one in a subunit for example, the two (some overlap assumed) do not change the assigned status ‒ collectively, activity in the subunit is simply assessed as ‘most important’. The maximum number of activities per subunit is also set at four regardless of importance level. Collective importance levels within an activity, thus subunit, are coded using the same number sequence (least important = 1 to most important = 4) as in comparisons between subunits for consistency and ease of translation.
Comparable to card games, extraordinary elements and inequities invoke conventions. Any on-water activity in the GoM connected with Atlantic bluefin tuna (Thunnus thynnus) is a potential ‘most important’ wild card, given the connection with killer whales in the GoM (Katona et al., Reference Katona, Beard, Girton and Wenzel1988). Accounting for gross background information inequities between Cape Cod subunits and the other subunits, the ‘most important’ effect level for Cape Cod is capped at two activities although all possibilities are acknowledged. I ignored personal local knowledge of the inshore Outer Fundy in judging the importance of maritime activities, to minimize possible bias in scaling up potential effort to the sub region level. Unlike comparisons between subunits, less emphasis is placed on activities judged to be least important within subunits since there can be many, especially proximal to Cape Cod. To test the validity of using importance to indicate potential eyes on the water, foreshadowing sufficient sample sizes, I undertake frequency comparisons of activities resulting in sightings in the Outer Fundy. Evaluation of numerical superiority between subunits is left to the comparisons outlined in the first paragraph of this section.
The effort ratings factor in a number of basic considerations contributing to reliability and mixed-method numerical transparency for example (Noble and Smith, Reference Noble and Smith2015; Hare et al., Reference Hare, Morrison, Nelson, Stachura, Teeters, Griffis, Alexander, Scott, Alade, Bell, Chute, Curti, Curtis, Kircheis, Kocik, Lucey, McCandless, Milke, Richardson, Robillard, Walsh, McManus, Marancik and Griswold2016). Inherent in the study design, the potential for sightings is lower for areas farther from the mainland, those with fewer seascape features (e.g. Figure 1), winter periods and fishing closures. However, while variable from one fishery to another, winter fishing across the GoM is relatively intense, often maintaining at least moderate sightings potential. Also, a pre-analysis indicates GoM effort ratings present no pattern in relation to subunit areas, based on a ranking of the latter variable. Analyses include a simulation in which sightings (n = 9 d) in the vicinity of Grand Manan Island (Outer Fundy, Figure 1), near the eastern boundary of the Coastal Maine region, are reassigned to the latter unit. This a posteriori ‘thought experiment’ examines the extent to which a substantial spatial bias at the subunit level, e.g. an incorrect or ‘wrong’ placement of sightings would affect the frequency results of sightings system-wide.
The killer whale records
Personal viewings (2010 and later), sightings by colleagues, and those by other knowledgeable observers make up many of the records from the NE GoM through 2008–2017, the study period. Additional records were derived from searches of internet sources such as news outlets, postings from research institutions and recreational tour operations, and experiences recounted on social media. Observations were made from many types of seagoing as well as island-based (four occasions) viewing platforms. Multiple sightings on a single day are considered a single record to avoid pseudo-replication. Photographs and or videos representing 47 sightings’ days were ultimately viewed for the majority of the sightings I accept, other than those duplicated in databases such as OBIS-SEAMAP (OBIS, 2022).
Basal information included here about confirmed and allowed-probable killer whale sightings consists of an identification based on a description of his physical features, season and approximate location. Five nominally probable sightings with information deficiencies (each multiple sources but missing specifics; little description overlap), largely related to commercial fishing in the Outer Fundy, were omitted from analyses. Identification from photos, videos, and some verbal descriptions build on Bigg (Reference Bigg1982), focusing for example on one or more of: dorsal fin (Figure 2) ‒ vertical and apex orientations, polynomial outlines of apex and posterior edge, including nick, height-to-lateral width ratios; saddle patch ‒ shape, details near posterior junction of back with dorsal fin, ephemeral details; more general transitory elements re body surface. Collectively the sightings constitute more of a true statistical sample than most strict photo-identification studies, because acceptance of some probable sightings accepts the possibility of (admittedly very small) sampling error. All third-party data and observations in this study were made anonymous (PDPC, 2018), which tends to be most useful with respect to indirect personal identifiers and the activities of fishers (Acheson and Gardner, Reference Acheson and Gardner2014; Chiu, Reference Chiu2017).
Historical or ‘baseline’ records of single-killer whale occurrences in the GoM are found in Appendix 1 of Katona et al., (Reference Katona, Beard, Girton and Wenzel1988, excludes case 132 and related, presumed end-of-life) with records spanning 38 years, 1949 through 1986. No animal ages are known, and potential observation effort is not assessed for the baseline period.
Coastal Maine herring
Regression analysis of herring decadal landings (SW New Brunswick), available through 2017, uses fixed-gear data (juvenile herring, ages 1–3) from DFO (2018) and references therein. Puffin herring-forage data (Machias Seal Island, SW of Grand Manan, Figure 1) for the same period (herring ages 1~2) appear in Depot et al., (Reference Depot, Scopel, Kress, Shannon, Diamond and Elliott2020) and Diamond (Reference Diamond2021; courtesy L. Scopel, Univ. of New Brunswick, CA), as part of compilations of fish biomass delivered annually to puffin chicks. Herring are the preferred prey of puffins, although variable year-to-year and as prey can at times indicate herring availability.
Preacher (Reference Preacher2001) outlines the Chi-square test of independence for comparing sightings’ frequencies across spatial units. The Custom variant allows one to specify expected frequencies of one's choosing, for example distributions expected based on effort and history. The Yates’ correction improves the null-condition (no effect) sampling distribution, particularly if some sampling frequencies are very low. In the validity test of using importance to indicate potential eyes on the water, the minimum frequency is set = 2 sightings per importance grouping by subtracting the appropriate count from the maximum activity-specific total; this manipulation, to meet test procedural requirements results in a conservative statistical evaluation.
Regression analyses use ordinary least squares (Sokal and Rohlf, Reference Sokal and Rohlf1981) for the herring-related time series, where 2000 is year = 0 and 2017 = 17, the last year for which data are available. Slopes and intercepts reflect these domain values, while the trends represent those over the time series expressed in years. Since puffin herring-forage values are percentages, they are arcsine transformed to minimize distortions in the distribution of the percentages, by compression of the middle of the % spectrum (Sokal and Rohlf, Reference Sokal and Rohlf1981).
Results
The killer whale was seen on multiple occasions every year for a total of 65 different days over the study period (65 decade−1), in contrast to single-sightings during the historical baseline of 6.1 decade−1. The increase, an order of magnitude, occurred despite a much shorter (75% less) observation period. No trend in numbers occurred through the baseline, although eight single-animal sightings occurred 1979–1981. Katona et al. (Reference Katona, Beard, Girton and Wenzel1988) do not state details of the eight historical sightings but a few probably were re-sightings. Given the spread of almost four decades it is assumed that most baseline sightings were of different animals despite killer whale longevity. In the recent decade, 92.3% of sightings are considered confirmed identifications, while the remainder are designated probable.
Records without effort
Aggregate sightings by season in the recent (male killer whale) and baseline periods are both typical, peaking in late summer (Figure 3). The larger recent sample size probably helps spread the distribution, contributing to higher frequencies during spring and fall.

Figure 3. Records without effort: sightings by season in the greater Gulf of Maine, for the male killer whale and for single killer whales in the historical baseline, i.e. post World War II.
Records with effort
The killer whale was seen in four of the five major sub regions, especially (82%) throughout the Outer Fundy (Figure 4; ‘conservative’, given the five case omissions). Sightings for this area are triple the number of sightings expected based on estimated effort. There are no reports of sightings for Coastal Maine, contrary to the number expected which equals that for the Outer Fundy. Sightings in Outer Fundy drop to 68% in the ‘wrong placement’ simulation, in which sightings (n = 9 d) in the vicinity of Grand Manan Island (Outer Fundy, Figure 1), near the eastern boundary of the Coastal Maine region, are reassigned to the latter unit. The effect on the overall regional distribution of sightings is minimal, supported by a comparison of the simulation frequency with that of sightings expected based on effort (Custom Yates’ χ 2 = 49.226, P = 0, df = 4; Scotian Shelf expected value 6) (here ~2.5 times expected).

Figure 4. Records with effort: sightings of the male killer whale, actual and expected, and of single killer whales historically, by sub region in the greater Gulf of Maine.
The frequency of killer whale sightings by region during the baseline period mimics that expected according to effort in the recent decade, with eastern observations split between Outer Fundy and Coastal Maine (Figure 4). One difference occurs, in that more baseline killer whale sightings were reported for the Cape Cod region than expected recently (frequencies expressed as percentages, Custom Yates’ χ 2 = 35.781, P = 3.2e-7, df = 4). The striking difference between the Outer Fundy and the paucity of recent sightings in Coastal Maine does not occur in the baseline.
Sighting’ counts correspond with importance level when 1 maritime activity predominates, and are more even when higher importance levels are shared among activities (Figure 5). With shared importance in the Grand Manan subunit, frequencies are no different from those expected in an even distribution (as %s, Custom Yates’ χ 2 = 2.627, P = 0.269, df = 2). Having different single predominate activities, the frequency distributions in the Neck/Islands and German Bank subunits are markedly different (as %s, Custom Yates’ χ 2 = 59.401, P = 0, df = 2). Working transit (WT, Table 2) activities reported no sightings in the latter subunits, so WT is not included in Figure 5.

Figure 5. Frequency of activities (Table 2; CF, DS, RP) by subunit (Figure 1; gm, n/i, gb) importance level resulting in male killer whale sightings; data are for summers in the Outer Fundy sub region (half of all sightings). Frequency comparisons illustrate the validity of using importance to indicate sightings’ potential, i.e. ‘eyes on the water’. Dark grey = most important, medium grey = important, white = less important (a priori). Dashed lines = subunit averages.
Coastal Maine revisited
Recent herring landings, Canadian but symptomatic of eastern Coastal Maine forage, declined dramatically (6% year−1 since 2000, Figure 6; R 2 = 0.690, Pearson r = − 0.842, ‘strong’, P < 0.0001, df = 15; 2007 outlier 30,100 t omitted), to the point of fishery near-collapse by 2017. Inclusion of the 2007 outlier results in very similar pattern but decreases the R 2 to 0.487. The pattern of juvenile herring delivered to puffin chicks is more complex, as indicated by the polynomial curve fit (Figure 7, R 2 = 0.999), showing some stability (x2 term) before a steep decline during the recent period of GoM male killer whale sightings.

Figure 6. Decline of Atlantic herring landings in the weir/shutoff fishery since 2000, north of Grand Manan, Outer Fundy (Figure 1), part of the Coastal Maine stock component. Dashed lines, two-tailed 95% confidence limits. Outlier value for 2007 omitted. Data, representing juvenile herring, ages 1–3, from DFO (2018) and references.

Figure 7. Relative quantity of Atlantic herring in forage delivered to Atlantic puffin chicks since 2000, Machias Seal Island SW of Grand Manan, Outer Fundy (Figure 1); herring part of the Coastal Maine stock component. Y-axis - mean year−1, 3 year ‘bins’. Puffin data, representing juvenile herring ages 1~2, appear in Depot et al., (Reference Depot, Scopel, Kress, Shannon, Diamond and Elliott2020) and Diamond (Reference Diamond2021; originally courtesy of L. Scopel, Univ. of New Brunswick, CA).
Discussion
The male killer whale provides the first patterns of interannual site fidelity for killer whales in the western half of the Atlantic hemisphere, demonstration enabled by the qualitative image-based approach to observation effort. The contrast with historical comparisons adds additional support for the recent fidelity. Inclusion of effort greatly reduces the uncertainty with respect to seasonality and the likelihood of detection which arises in incidental surveys, even when observed survey distributions (e.g. Delefosse et al., Reference Delefosse, Rahbek, Roesen and Clausen2018) are highly consistent, include larger sample sizes across multiple species, and can be attributed to causes. In this manner, inclusion of effort such as the type of index here would serve as a natural complement to valuable incidental survey methods, such as those employed by Delefosse et al. (Reference Delefosse, Rahbek, Roesen and Clausen2018) on oil rigs in the North Sea. Single activities considered to be important sources of sightings appear to provide adequate levels of relative observation effort, at least at the basal level introduced in this study. Adding other potentially important sources of sightings does not necessarily increase the total number of sightings, but they would serve as robust backup effort in more complicated analyses. Dedicated service activities provide sporadic sightings’ options because their primary purpose is to look, albeit often for other reasons. Since a fundamental qualitative entity is not based on quantitative data i.e. without standards, necessary for retrospection (after Norman et al., Reference Norman, Young and Brooks2007), consistency of description in image interpretation is the only consideration available in making credible assessments of activity importance.
The approach could also serve as a precursor to the development of monitoring in well-established management domains (Hare et al., Reference Hare, Morrison, Nelson, Stachura, Teeters, Griffis, Alexander, Scott, Alade, Bell, Chute, Curti, Curtis, Kircheis, Kocik, Lucey, McCandless, Milke, Richardson, Robillard, Walsh, McManus, Marancik and Griswold2016), perhaps even highly sophisticated models (Pace et al., Reference Pace, Giacomini, Campana, Paraboschi, Pellegrino, Silvestre, Alessi, Angeletti, Cafaro, Pavan, Ardizzone and Arcangeli2019) which in most resource-limited situations are not practical. Regions rich in specific data types but with very large temporal-spatial gaps would also benefit from the complementary coverage rooted under a qualitative umbrella. Using data generated by observers on ferries in the northern Mediterranean, Arcangeli et al. (Reference Arcangeli, Atzori, Azzolin, Babey, Campana, Carosso, Crosti, Garcia-Garin, Gregorietti, Orasi, Scuderi, Tepsich, Vighi and David2023) found that indicators of low-density cetacean behaviour were representative when tied to areas of survey effort but limited otherwise. Domain constraint issues aside, conservation developments for Grizzly bears (Ursus arctos horribilis) offer a model of at least some of what could be targeted in the development of marine activity-efforts. In their approach (Morgan et al., Reference Morgan, Proctor, Mowat, McLellan, Hamilton and Turney2019) bear population units have similarities to killer whale sightings within subunits, while environmental threat activities (Environmental Reporting BC, 2020) are analogous to sightings’ activities in this study. Given the degree of activity monitoring consistency across the GoM it will be some time before empirical or ‘measurement’ data sets provide enough coverage to portray most subunits as numerical data-driven entities.
In the greater GoM, sightings indicate that the male killer whale shifts his activities from the S and W to the N and E during the warm seasons, at times starting the progression in the Cape Cod sub region. By mid summer-early autumn, he concentrates on the Outer Fundy sub region, similar to white-sided dolphins if they forage in the northeastern gulf (Sampson et al., Reference Sampson, Merigo, Lageux, Rice, Cooper, Weber, Kass, Mandelman and Innes2012). The Outer Fundy focus of both the killer whale and dolphins here corresponds to the main area of herring habitat in the extended Gulf of Maine during the warm seasons [e.g. ‘larval retention area’, Figure 1c in Boyce et al. (Reference Boyce, Petrie and Frank2019)]. Residual elements of the herring stocks off SW Nova Scotia use the area for spawning, egg incubation, larval development and feeding according to various spatial-temporal schedules (e.g. DFO, 2018). The general correspondence between GoM male killer whale occurrences and herring habitat is similar to that exhibited by killer whales in pursuit of herring in Norwegian (Simila et al.,Reference Simila, Holst and Christensen1996) and Icelandic (Samarra et al., Reference Samarra, Tavares, Beesau, Deecke, Fennell, Miller, Petursson, Sigurjonsson and Vikingsson2017) waters, and mackerel off Norway (Nottestad et al., Reference Nottestad, Sivle, Krafft, Langard, Anthonypillai, Bernasconi, Langoy and Ferno2014). Summer and fall data suggest similar movements for harbour porpoise in the GoM (Read and Westgate, Reference Read and Westgate1997).
Herring analyses with respect to the far northern edge of the Outer Fundy, contiguous with Coastal Maine, raise the hypothesis of herring depletion as the cause of the absence of recent killer whale sightings in the latter sub region. Although fished in Canadian waters, these herring are considered the NE extension of herring which frequent Coastal Maine, and are managed by the US as a consequence. Knowledge of the fishery and resultant stock responses remains cursory. Fishers, for example tend to rig fewer weirs if a decrease in herring catch is anticipated, often after a previous decline, which introduces a lag in effort reduction. The 2007 spike in the weir catch was partly associated with a brief spike in the number of active weirs, following a period of years of broad socio-political flux affecting regional fisheries management considerations (e.g. Wiber et al., Reference Wiber, Young and Wilson2012 and references). The weir fishery has never been monitored for fishery-independent herring abundance. Locally, salmonid net-pen acquaculture also has negative impacts on herring, eliminating small-scale habitat and disrupting herring movements (Wiber et al., Reference Wiber, Young and Wilson2012). With links to recurrent themes (Diamond, Reference Diamond2021), the puffin analysis corroborates the fisheries findings with solid independent evidence, at a larger scale, of the herring decline indicated to this point. While highly probable, the proposed effects of herring depletion on the male killer whale movements may be difficult to explore further with such large antecedent knowledge gaps.
This discussion of predation on herring embodies a long-standing challenge re proof of diet i.e. ingestion and retention (if not partial digestion) in wild killer whales, especially when the body sizes of putative prey are relatively small. A sidebar but necessary caveat, broad studies of killer whale prey rely heavily on behaviour as evidence (Samarra et al., Reference Samarra, Bassoi, Beesau, Eliasdottir, Gunnarsson, Mrusczok, Rasmussen, Rempel, Thorvaldsson and Vikingsson2018; Terrapon et al., Reference Terrapon, Kiszka and Wagner2021). Samarra et al. (Reference Samarra, Bassoi, Beesau, Eliasdottir, Gunnarsson, Mrusczok, Rasmussen, Rempel, Thorvaldsson and Vikingsson2018) document only three accounts (3/35) of killer whale stomach contents, none with fish, from Icelandic waters, however fish make up half of the prey accounts. Herring as prey constitute 26% of the accounts (Event 8), but there are no descriptions of predator-prey interactions. Combining their data for larger fish with those of Terrapon et al. (Reference Terrapon, Kiszka and Wagner2021) (halibut, sharks, rays), 5/12 accounts (42%) explicitly describe killer whales eating the fish, and four others killing fish without specifying ingestion. The consumption off commercial fishing lines in the former study is most telling; almost all halibut are clearly eaten and although the settings are manipulated, selected over other fish species such as redfish (Sebastes sp.). The weight of interaction evidence surrounding killer whale prey makes up a credible interim knowledge base, which should stimulate further investigation with respect to tangible proof of killer whale diets.
The effort analysis indicates that the male leaves the GoM proper for a relatively short time mid winter, as there is a lull in sightings unrelated to continuing observer effort, after early winter sightings from lobster fishing boats. He may move somewhat south to proximal warmer waters and perhaps farther offshore, the historical winter extent of GoM Atlantic herring (e.g. NEFSC, 2018), similar to many other species including harbour porpoise (Read and Westgate, Reference Read and Westgate1997). The observations of the male illustrate a diversification of activities as killer whale populations attempt recovery in the changing environments of the NW Atlantic. A decline in killer whale numbers through the baseline period, suggested with respect to the GoM and brought about by way of meta population processes (e.g. dispersal), could have reflected threats to killer whales in the North Atlantic. These include: whaling mortality, and killings and removals associated with government, industry and others (Jourdain et al., Reference Jourdain, Ugarte, Vikingsson, Samarra, Ferguson, Lawson, Vongraven and Desportes2019), simultaneous declines in many species which could serve as alternate prey for killer whales (Roberts, Reference Roberts2007) and, importunely less scavenging on great whales with the cessation of whaling (Whitehead and Reeves, Reference Whitehead and Reeves2005). Lawson and Stevens (Reference Lawson and Stevens2014) estimate a minimum of only 67 identified animals in the recent period for the whole NW Atlantic. The male might well be a remnant of a larger regional population, with unknown (pre)historical connections to other killer whales in the NW Atlantic prior to the baseline period.
Conservation implications
Concurrent with the theoretical reemphasis of individual differences (Bolnick et al., Reference Bolnick, Svanback, Fordyce, Yang, Davis, Hulsey and Forister2003), Kareiva (Reference Kareiva2001) highlighted the necessity of conserving individuals one by one for any species which had declined to the point where such action could save a population. Even a single male can contribute to population success, by way of male-mediated gene flow among killer whale lineages when and where overlap occurs (Foote et al., Reference Foote, Kuningas and Samarra2014). Systemic over-fishing of potential prey, especially Atlantic herring (Melville, Reference Melville, McNeely, Janowicz, Chang, Chamberlain, Rolston and Wells2018; Archibald et al., Reference Archibald, McIver and Rangeley2020; NEFMC, 2020; EAC, 2023) constitutes an immediate threat to many piscivorous species at both system and smaller spatial scales (e.g. Breton and Diamond, Reference Breton and Diamond2014; Melville, Reference Melville, McNeely, Janowicz, Chang, Chamberlain, Rolston and Wells2018). Similar threats exist for prospective alternate killer whale prey (Atlantic Mackerel, also Atlantic Pollack), species at times greatly diminished in the study system (Sosebee, Reference Sosebee2022). Fidelity here supports a fine-grained conservation perspective with respect to killer whale occurrences which includes reliance on harvested fish stocks, since killer whale prey availability is a must in the face of predator preferences (Lefort et al., Reference Lefort, Matthews, Higdon, Peterson, Westdal, Garroway and Ferguson2020). Community fisheries management (Mangel and Levins, Reference Mangel and Levins2005) must be implemented jointly by both Canada and the US, since all of the species of concern regularly move across the shared international boundary.
Knowledge of geographical movement and regional connectivity remains a priority to evaluate threats to killer whales (Foote et al., Reference Foote, Kuningas and Samarra2014; Jourdain et al., Reference Jourdain, Ugarte, Vikingsson, Samarra, Ferguson, Lawson, Vongraven and Desportes2019). Overall the species faces severe threats to its’ existence worldwide (Reeves et al., Reference Reeves, Pitman and Ford2017), and since extirpation looms for small killer whale populations no threat can be overlooked (Beck et al., Reference Beck, Foote, Kotter, Harries, Mandleberg, Stevick, Whooley and Durban2014). Based entirely on qualitative analysis, they determine the connectivity of a tiny population of killer whales in the Atlantic off the western UK and Ireland, now down to nine known animals (five males, four females) after the death of the young female adult ‘Lulu’ by entanglement in late 2015. With additional development of corroborative approaches such as the observation effort based on qualitative analyses here, it is possible to chip away at impediments to the research of many challenging cetacean populations, not just killer whales (e.g. Bain et al., Reference Bain, Wayne and Bencini2014).
Supplementary material
The supplementary material for this article can be found at https://doi.org/10.1017/S002531542300084X.
Data availability statement
All killer whale data analysed (season, approximate location) are contained in the manuscript. Additional enquiry with respect to specific sightings is welcome, adhering to the spirit and intent of anonymization.
Acknowledgements
I thank the people who contributed observations to this presentation. Fellow Captains J. Swift and R. Small contributed several noteworthy biological observations, and the Atlantic puffin data (published by A.W. Diamond) are originally from L.C. Scopel. C.K. Melville assisted with literature acquisition. GOMA created the bathymetric base map Figure 1 using USGS data. Several anonymous reviewers and other readers made suggestions which improved the manuscript. Y. Cuttle, R. St Pierre and J. Melville kindly read full drafts. In memory of Ed Maly.
Financial Support
No funding was received to undertake this research.
Competing interests
None.
Ethical standards
The author abides by ethical standards in using the personal experiences and accounts of others in the study.