

Original text and correction:
The authors mistakenly used ‘mg/dl’ instead of ‘g/dl’ to express Haemoglobin concentration; please see corrections below.
ORIGINAL TEXT (page 1, Abstract)
After supplementation, the mean changes in Hb concentration in the women in the low-groundwater-Fe areas (0·10 mg/dl) was higher than that in the pregnant women in the high-groundwater-Fe areas (–0·08 mg/dl; P = 0·052).
CORRECTION
After supplementation, the mean changes in Hb concentration in the women in the low-groundwater-Fe areas (0·10 g/dl) was higher than that in the pregnant women in the high-groundwater-Fe areas (–0·08 g/dl; P = 0·052).
ORIGINAL TEXT (page 7, Results)
Table 2 Haemoglobin, serum ferritin and folate concentrations in the study participants at baseline and after 3·5 months supplementation period, and the difference between baseline and post supplementation, by areas with low- and high-iron in the groundwater
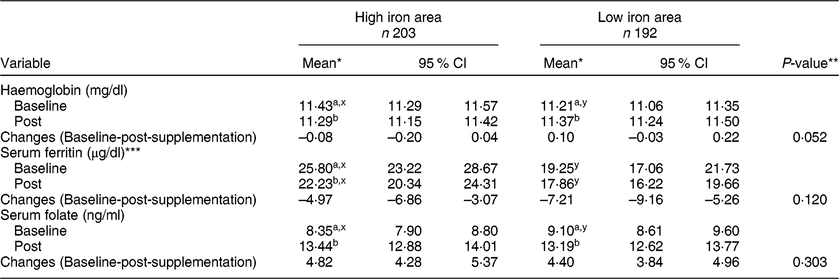
* Repeated measures ANOVA with time as repeated measures, was performed.
a,bMean values within a column (within each iron area) with unlike subscript letters were significantly different (P < 0·05).
x,yMean values across the rows for each of the variables (at each time point) with unlike subscript letters were significantly different (P < 0·05).
** Based on the general linear model with change in concentration as the dependent variable and adjusted for corresponding baseline value, total number of tablets consumed, husband’s occupation and possession of cultivable land.
Serum ferritin was adjusted for elevated serum CRP and AGP, by mathematical correction.
*** P-values based on log-transformed serum ferritin concentrations.
CORRECTION
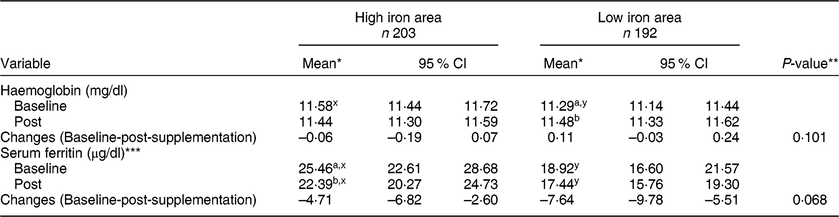
Table 2 Haemoglobin, serum ferritin and folate concentrations in the study participants at baseline and after 3·5 months supplementation period, and the difference between baseline and post supplementation, by areas with low- and high-iron in the groundwater

* Repeated measures ANOVA with time as repeated measures, was performed.
a,bMean values within a column (within each iron area) with unlike subscript letters were significantly different (P < 0·05).
x,yMean values across the rows for each of the variables (at each time point) with unlike subscript letters were significantly different (P < 0·05).
** Based on the general linear model with change in concentration as the dependent variable and adjusted for corresponding baseline value, total number of tablets consumed, husband’s occupation and possession of cultivable land.
Serum ferritin was adjusted for elevated serum CRP and AGP, by mathematical correction.
*** P-values based on log-transformed serum ferritin concentrations.
ORIGINAL TEXT (page 9, Results)
The sample size, denoted by ‘n’, in Table 4 was also incorrectly reported.
Table 4 Haemoglobin, serum ferritin and folic acid concentrations in the study participants without haemoglobinopathies at baseline and after 3·5 months supplementation period, and the difference between baseline and post supplementation, by areas with low- and high-iron in the groundwater
* Repeated measures ANOVA with time as repeated measures, was performed.
a,bMean values within a column (within each area) with unlike subscript letters were significantly different (P < 0·05).
x,yMean values across the rows for each of the variables (at each time point) with unlike subscript letters were significantly different (P < 0·05).
** Based on the general linear model with change in concentration as the dependent variable and adjusted for corresponding baseline value, total number of tablets consumed, husband’s occupation and possession of cultivable land.
Serum ferritin was adjusted for elevated serum CRP and AGP, by mathematical correction.
*** P-values based on log-transformed serum ferritin concentrations.
CORRECTION
Table 4 Haemoglobin, serum ferritin and folic acid concentrations in the study participants without haemoglobinopathies at baseline and after 3·5 months supplementation period, and the difference between baseline and post supplementation, by areas with low- and high-iron in the groundwater
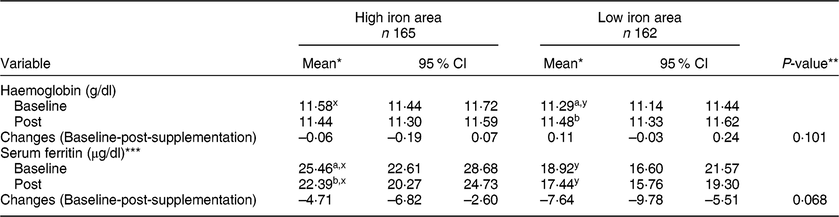
* Repeated measures ANOVA with time as repeated measures, was performed.
a,bMean values within a column (within each area) with unlike subscript letters were significantly different (P < 0·05).
x,yMean values across the rows for each of the variables (at each time point) with unlike subscript letters were significantly different (P < 0·05).
** Based on the general linear model with change in concentration as the dependent variable and adjusted for corresponding baseline value, total number of tablets consumed, husband’s occupation and possession of cultivable land.
Serum ferritin was adjusted for elevated serum CRP and AGP, by mathematical correction.
*** P-values based on log-transformed serum ferritin concentrations.
ORIGINAL TEXT (page 9, Discussion)
In the present study, we found a 0·10 mg/dl increase in Hb concentration only in the pregnant women living in the low-groundwater-Fe areas after IFA supplementation; this finding reinforces the effect of increased erythropoiesis due to increased Fe availability.
CORRECTION
In the present study, we found a 0·10 g/dl increase in Hb concentration only in the pregnant women living in the low-groundwater-Fe areas after IFA supplementation; this finding reinforces the effect of increased erythropoiesis due to increased Fe availability.


