


The authors regret the inclusion of the following errors detailed below in the above article.
Our data processing for SPICE-RACS-DR1 involved a two-stage process. First, image cubes were produced using the ASKAPsoft (Guzman et al., Reference Guzman, Whiting and Voronkov2019) pipeline, and scripts that made calls into components of it. Secondly, we processed the cubes using our own Arrakis v1.0 pipeline. Since the release of SPICE-RACS DR1, we have developed Arrakis v2, which now includes its own imaging module leveraging WSClean (Offringa et al., Reference Offringa, McKinley and Hurley-Walker2014; Offringa & Smirnov, Reference Offringa and Smirnov2017). This has allowed streamlined processing within a single managed pipeline environment.
In preparation for our second, all-sky, data release we have discovered an error in the reported flux densities in SPICE-RACS DR1. Notably, the Stokes Q and U images were scaled down by a factor of two. This has also resulted in the polarised intensity and polarisation fraction (and associated errors) as being misreported by a factor of two. We note, however, that the reported polarisation angles and rotation measures are unaffected by this.
We discovered this error through reprocessing of single scheduling-block (SBID) fields from RACS-low1 (McConnell et al., Reference McConnell, Hale and Lenc2020), RACS-low2, and the recently released third epoch, RACS-low3. Our reprocessed data, using Arrakis v2, demonstrated an apparent offset with both the SPICE-RACS DR1 catalogue and images. In Figure 1 we show the comparison of both polarised intensity (pI) and its associated error between the SPICE-RACS DR1 catalogue and newly processed fields. We have reprocessed the RACS-low1 field RACS_1357-18A (SBID 8584), which was included in the original processing for SPICE-RACS DR1. We have also processed the corresponding fields RACS_1357-18 (SBID 38959) and RACS_1403-18 (SB 57777) from RACS-low2 and RACS-low3, respectively.
We have confirmed the flux scaling of our new processing pipeline against reference values from Perley & Butler (Reference Perley and Butler2013) and Perley & Butler (Reference Perley and Butler2017) in total and polarised intensity, respectively. Using source positions from RACS-mid Duchesne et al. (Reference Duchesne, Grundy and Heald2024) we process RACS-low3 fields RACS_1326+32 (SBID 55799) and RACS_0526+18 (SBID 56118) which covered the well-known, linearly polarised sources 3C 286 and 3C 138, respectively. We show the measured spectra in comparison with the reference spectra in Figure 2.
Corrections to Thomson et al. (Reference Thomson, McConnell and Lenc2023)
In §4.1 of Thomson et al. (Reference Thomson, McConnell and Lenc2023) we discussed the noise properties of the DR1 catalogue. Our reported noise in Stokes Q and U should be ${2.66 \substack{+0.85\\-0.53}}$
mJy/PSF/channel and
${2.66 \substack{+0.85\\-0.53}}$
mJy/PSF/channel and ${2.52 \substack{+0.83\\-0.53}}$
mJy/PSF/channel, respectively. Further, our estimated band-averaged value should be
${2.52 \substack{+0.83\\-0.53}}$
mJy/PSF/channel, respectively. Further, our estimated band-averaged value should be ${157 \substack{+50\\-31}}$ $\unicode{x03BC} \mathrm{Jy/PSF}$
and
$\unicode{x03BC} \mathrm{Jy/PSF}$
and ${149 \substack{+49\\-31}}$ $\unicode{x03BC} \mathrm{Jy/PSF}$
for Q and U, respectively, and the median noise in linear polarisation is
$\unicode{x03BC} \mathrm{Jy/PSF}$
for Q and U, respectively, and the median noise in linear polarisation is ${159 \substack{+56\\-33}}$ $\unicode{x03BC} \mathrm{Jy/PSF}$
. Here we have also produced corrected versions of Figures 5 and 6 from Thomson et al. (Reference Thomson, McConnell and Lenc2023) in Figures 3 and 4, respectively.
$\unicode{x03BC} \mathrm{Jy/PSF}$
. Here we have also produced corrected versions of Figures 5 and 6 from Thomson et al. (Reference Thomson, McConnell and Lenc2023) in Figures 3 and 4, respectively.
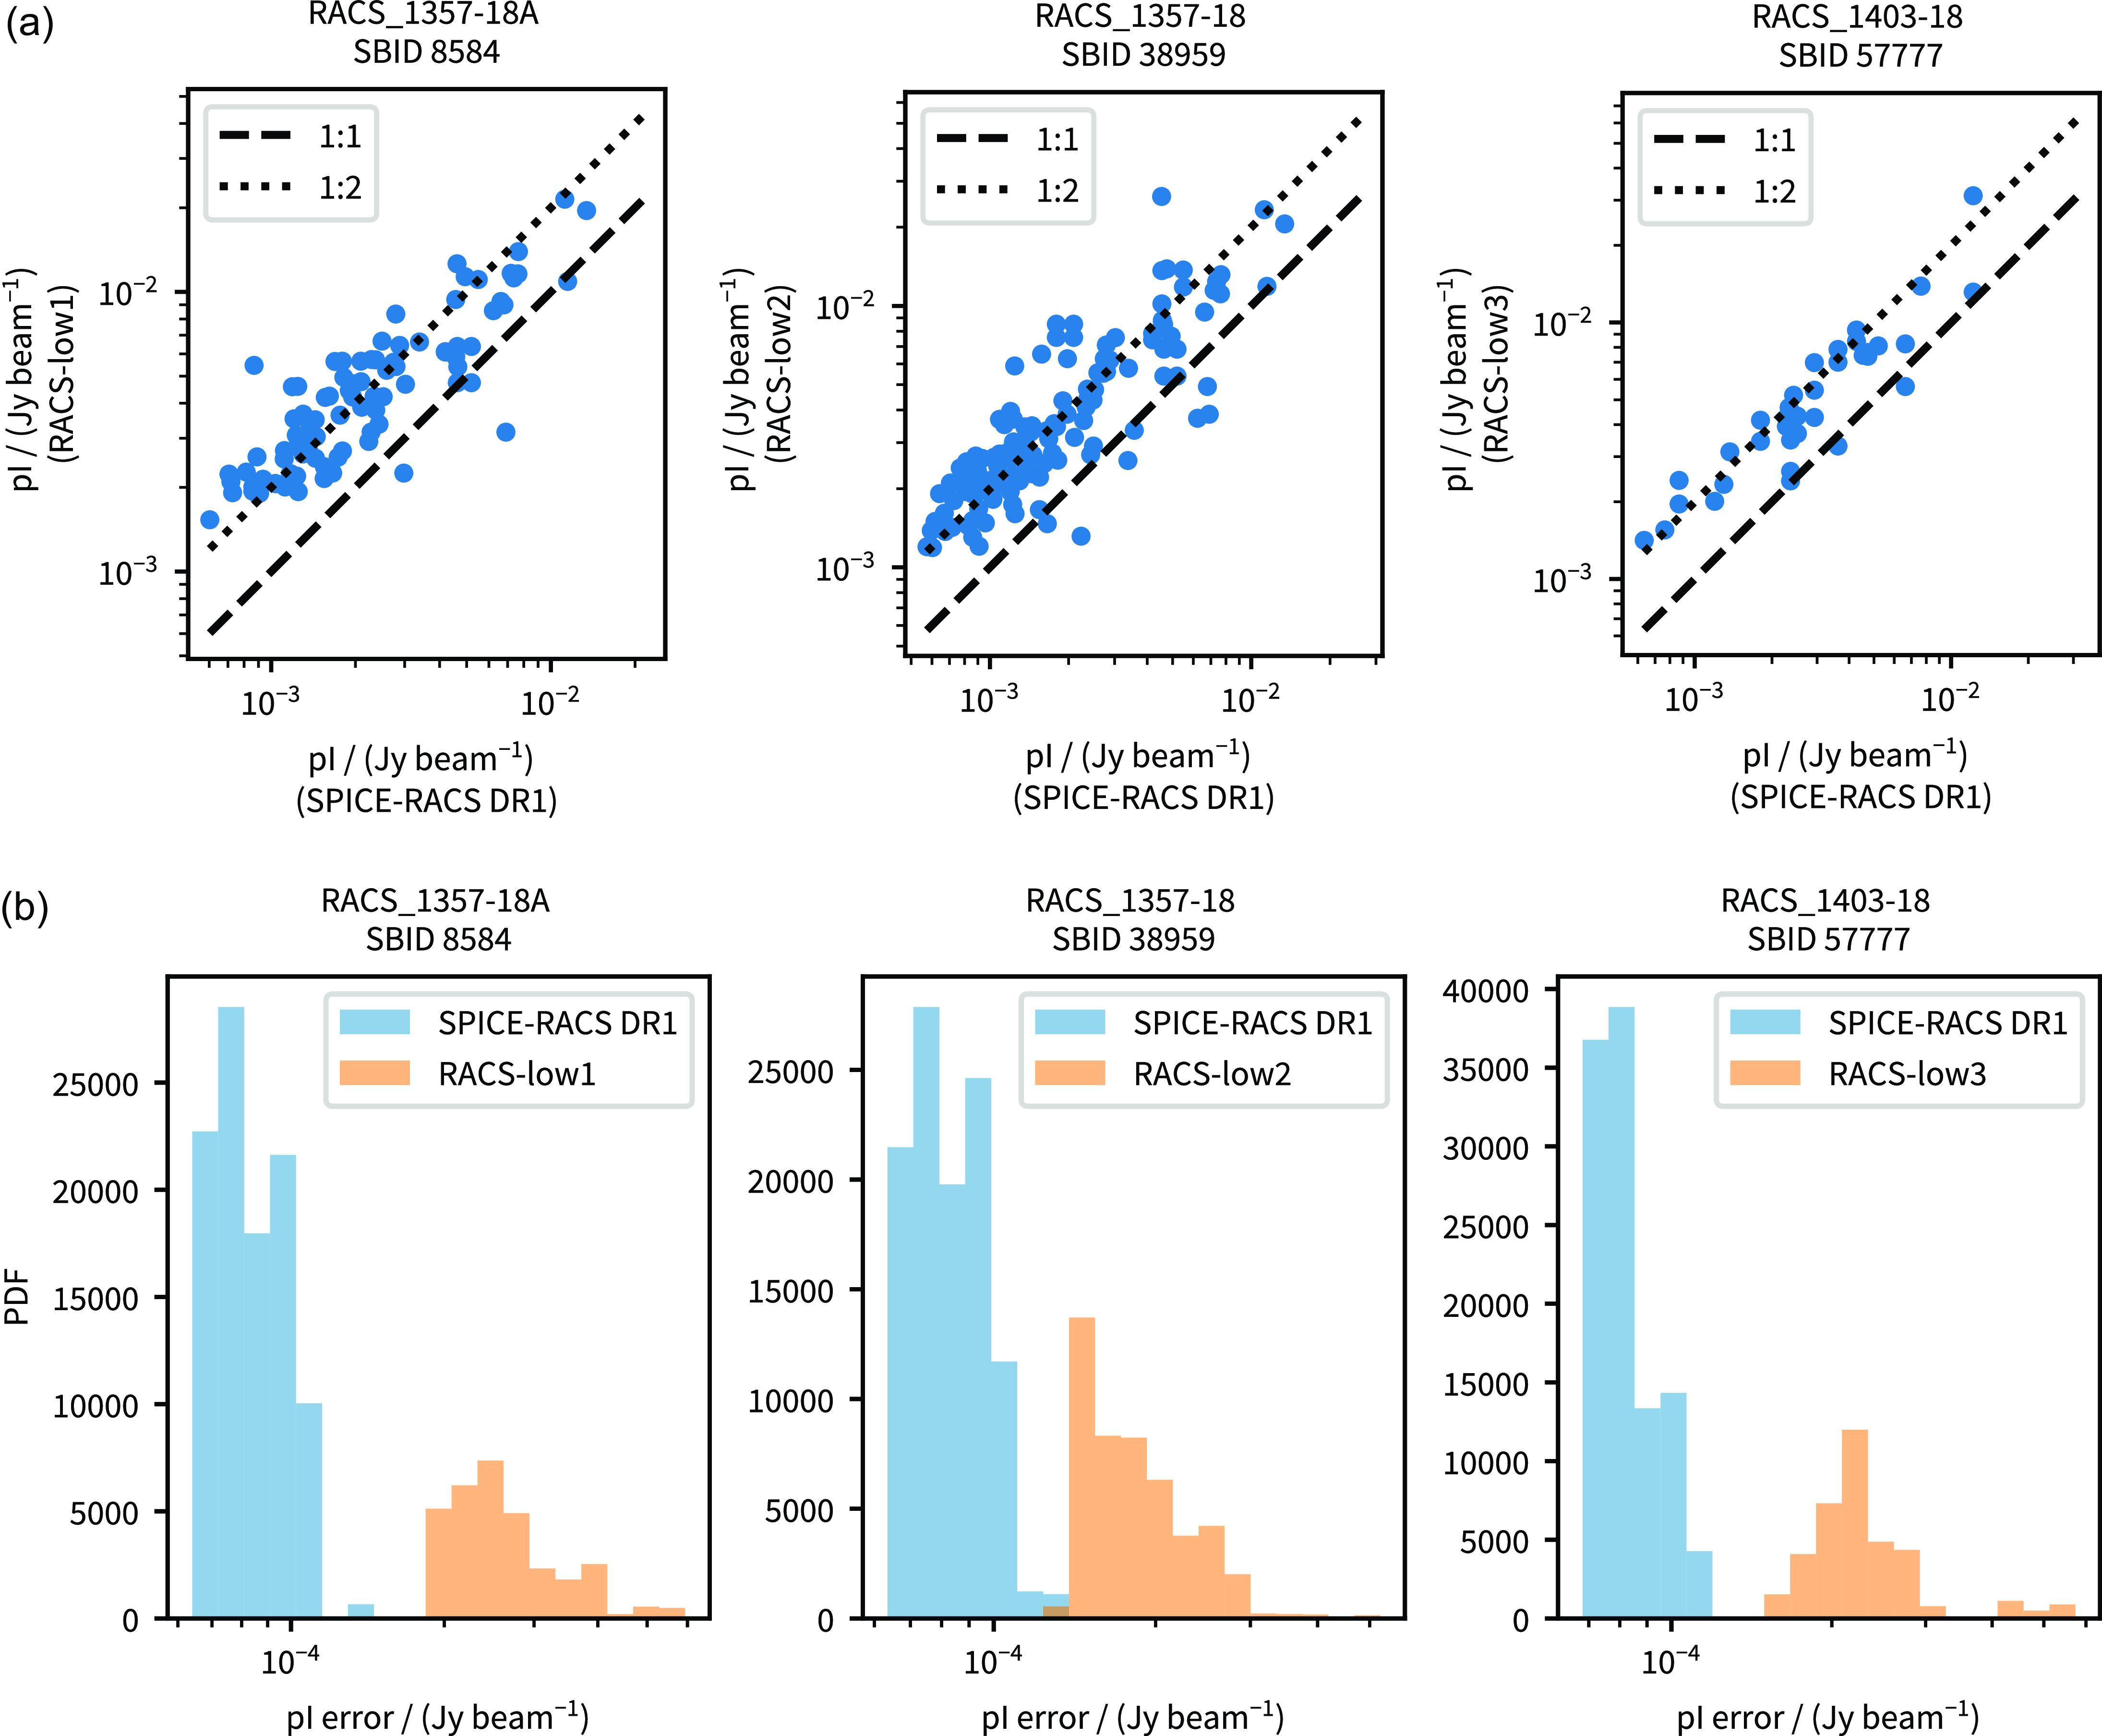
Figure 1. Comparisons of SPICE-RACS DR1 with newly processed data from RACS-low1, RACS-low2, and RACS-low3. (a) cross-matched polarised intensity (pI) from SPICE-RACS DR1 with newly processed overlapping fields. (b) The distribution of error in polarised intensity from the same set of cross-matched components.
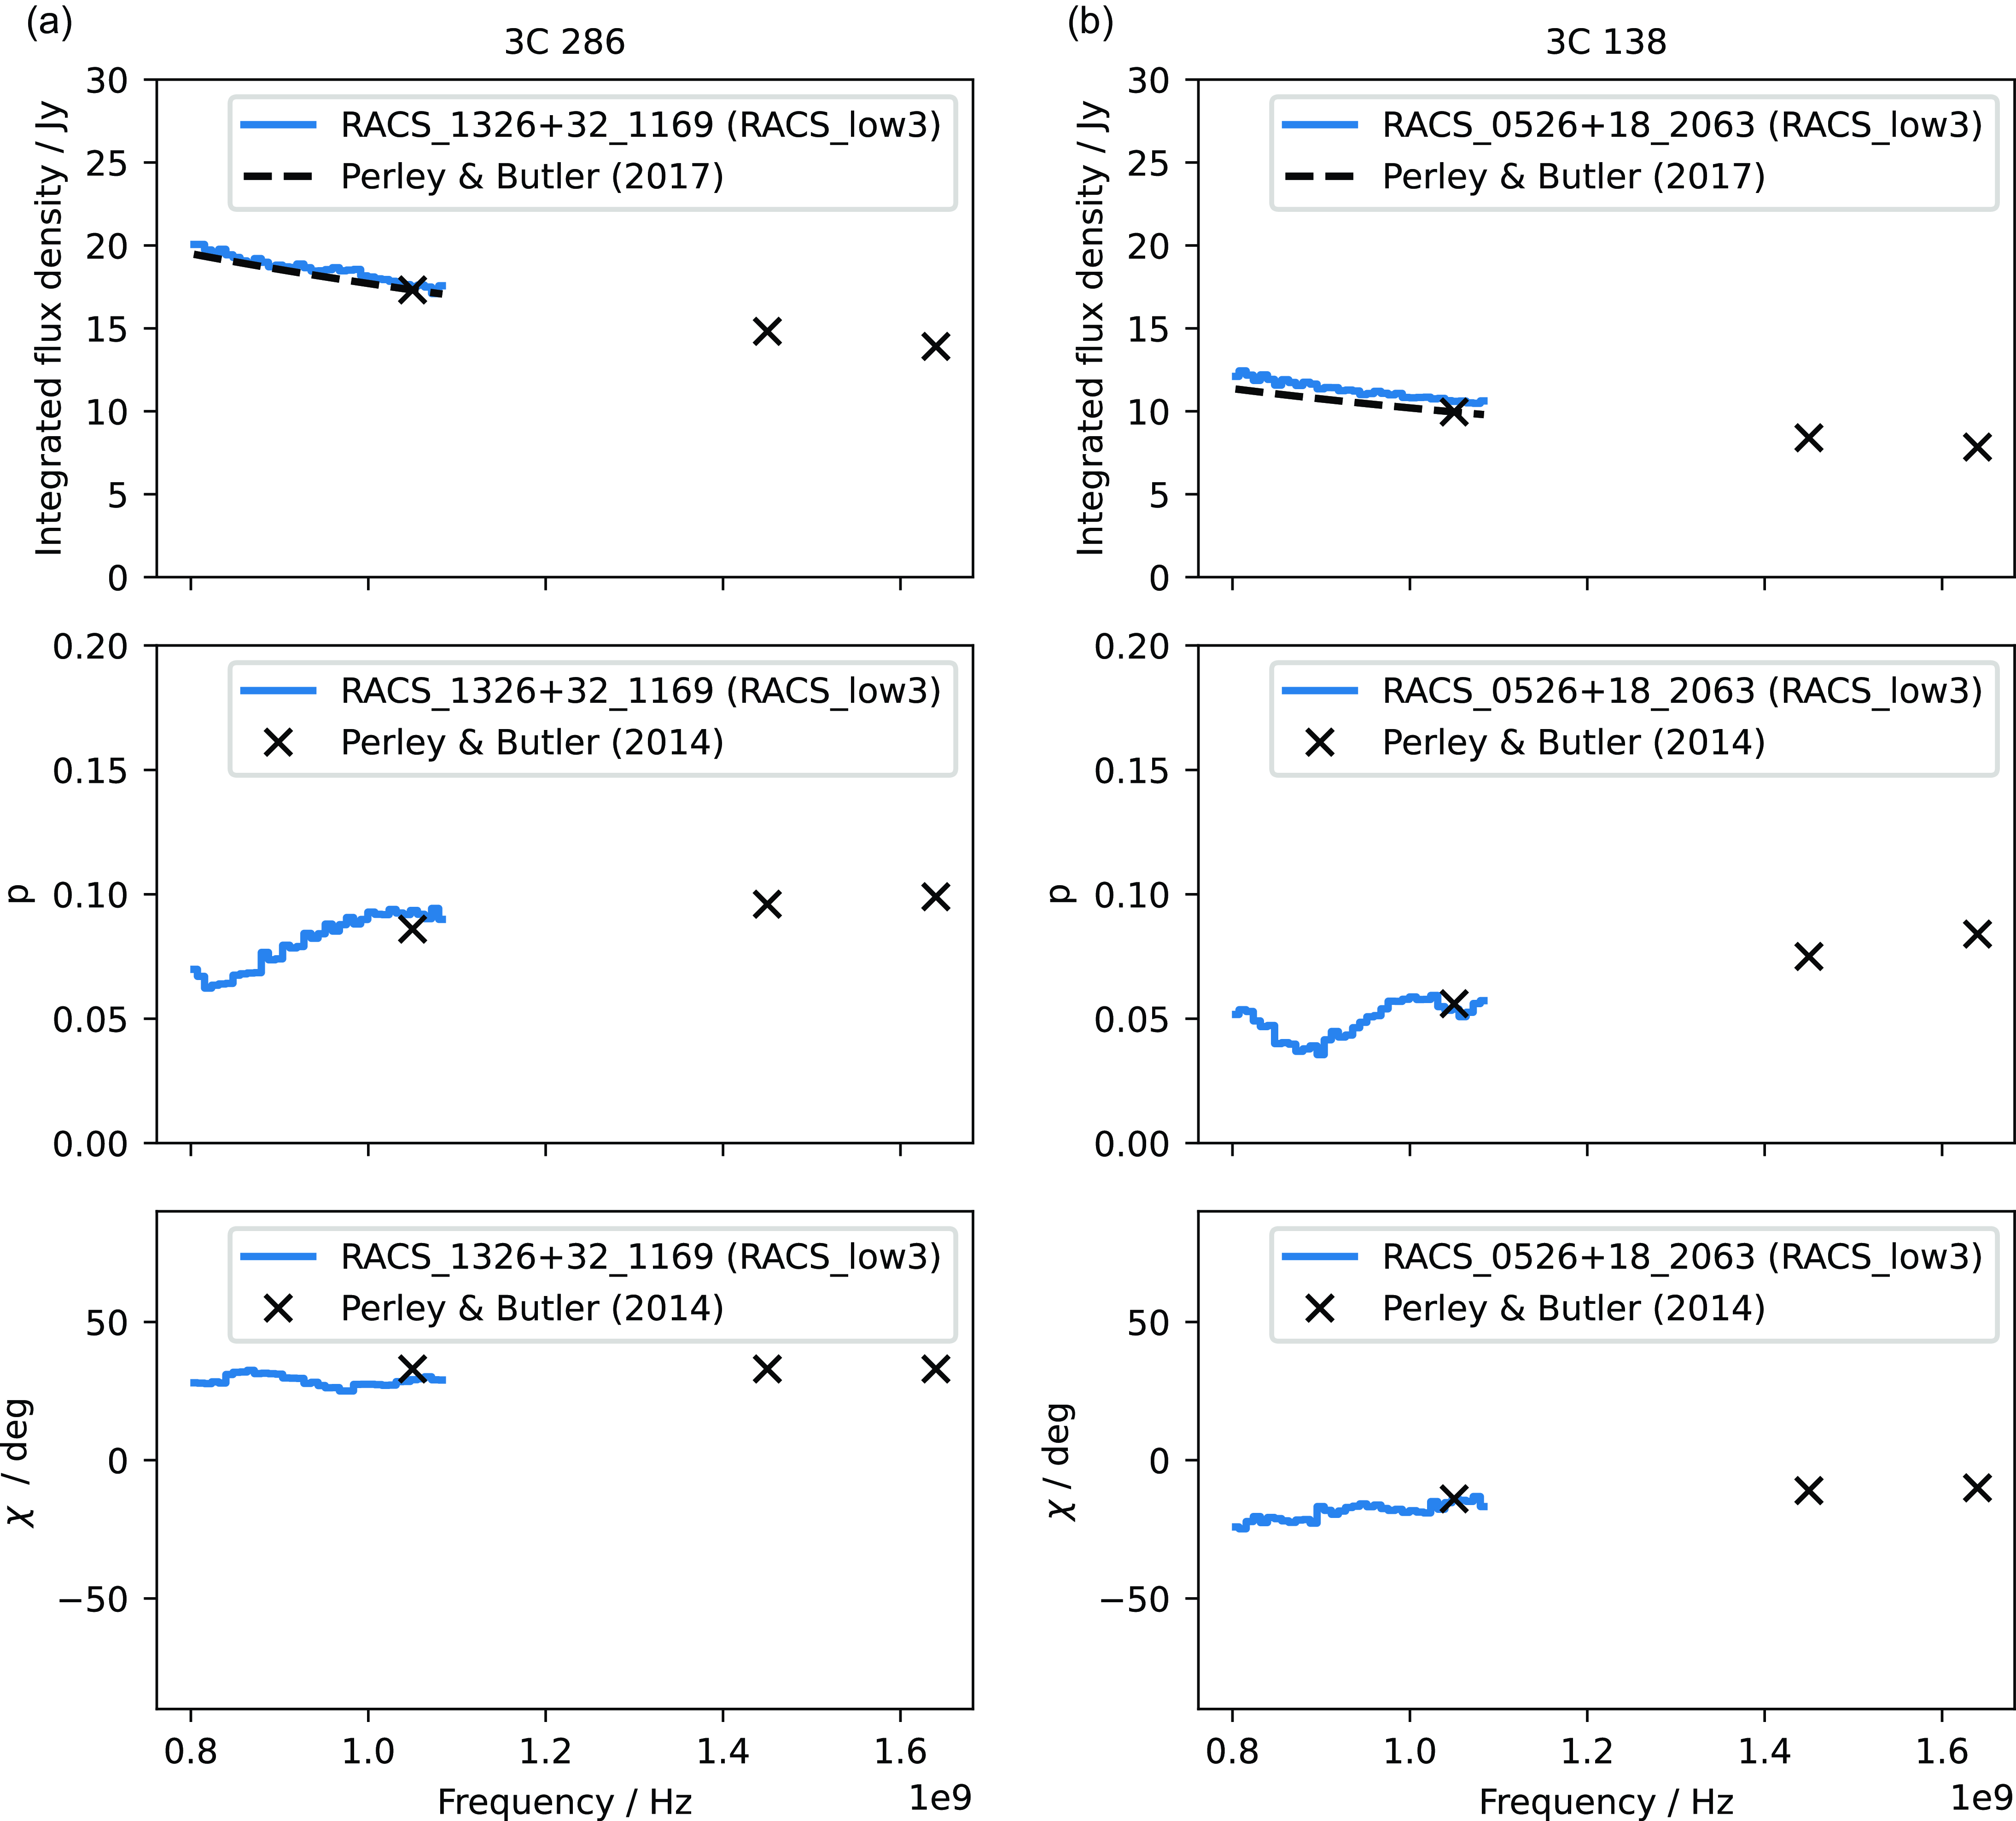
Figure 2. Integrated spectra from RACS-low3 towards reference sources (a) 3C 286, and (b) 3C 138. Reference spectra are shown from Perley & Butler (Reference Perley and Butler2013) and Perley & Butler (Reference Perley and Butler2017).
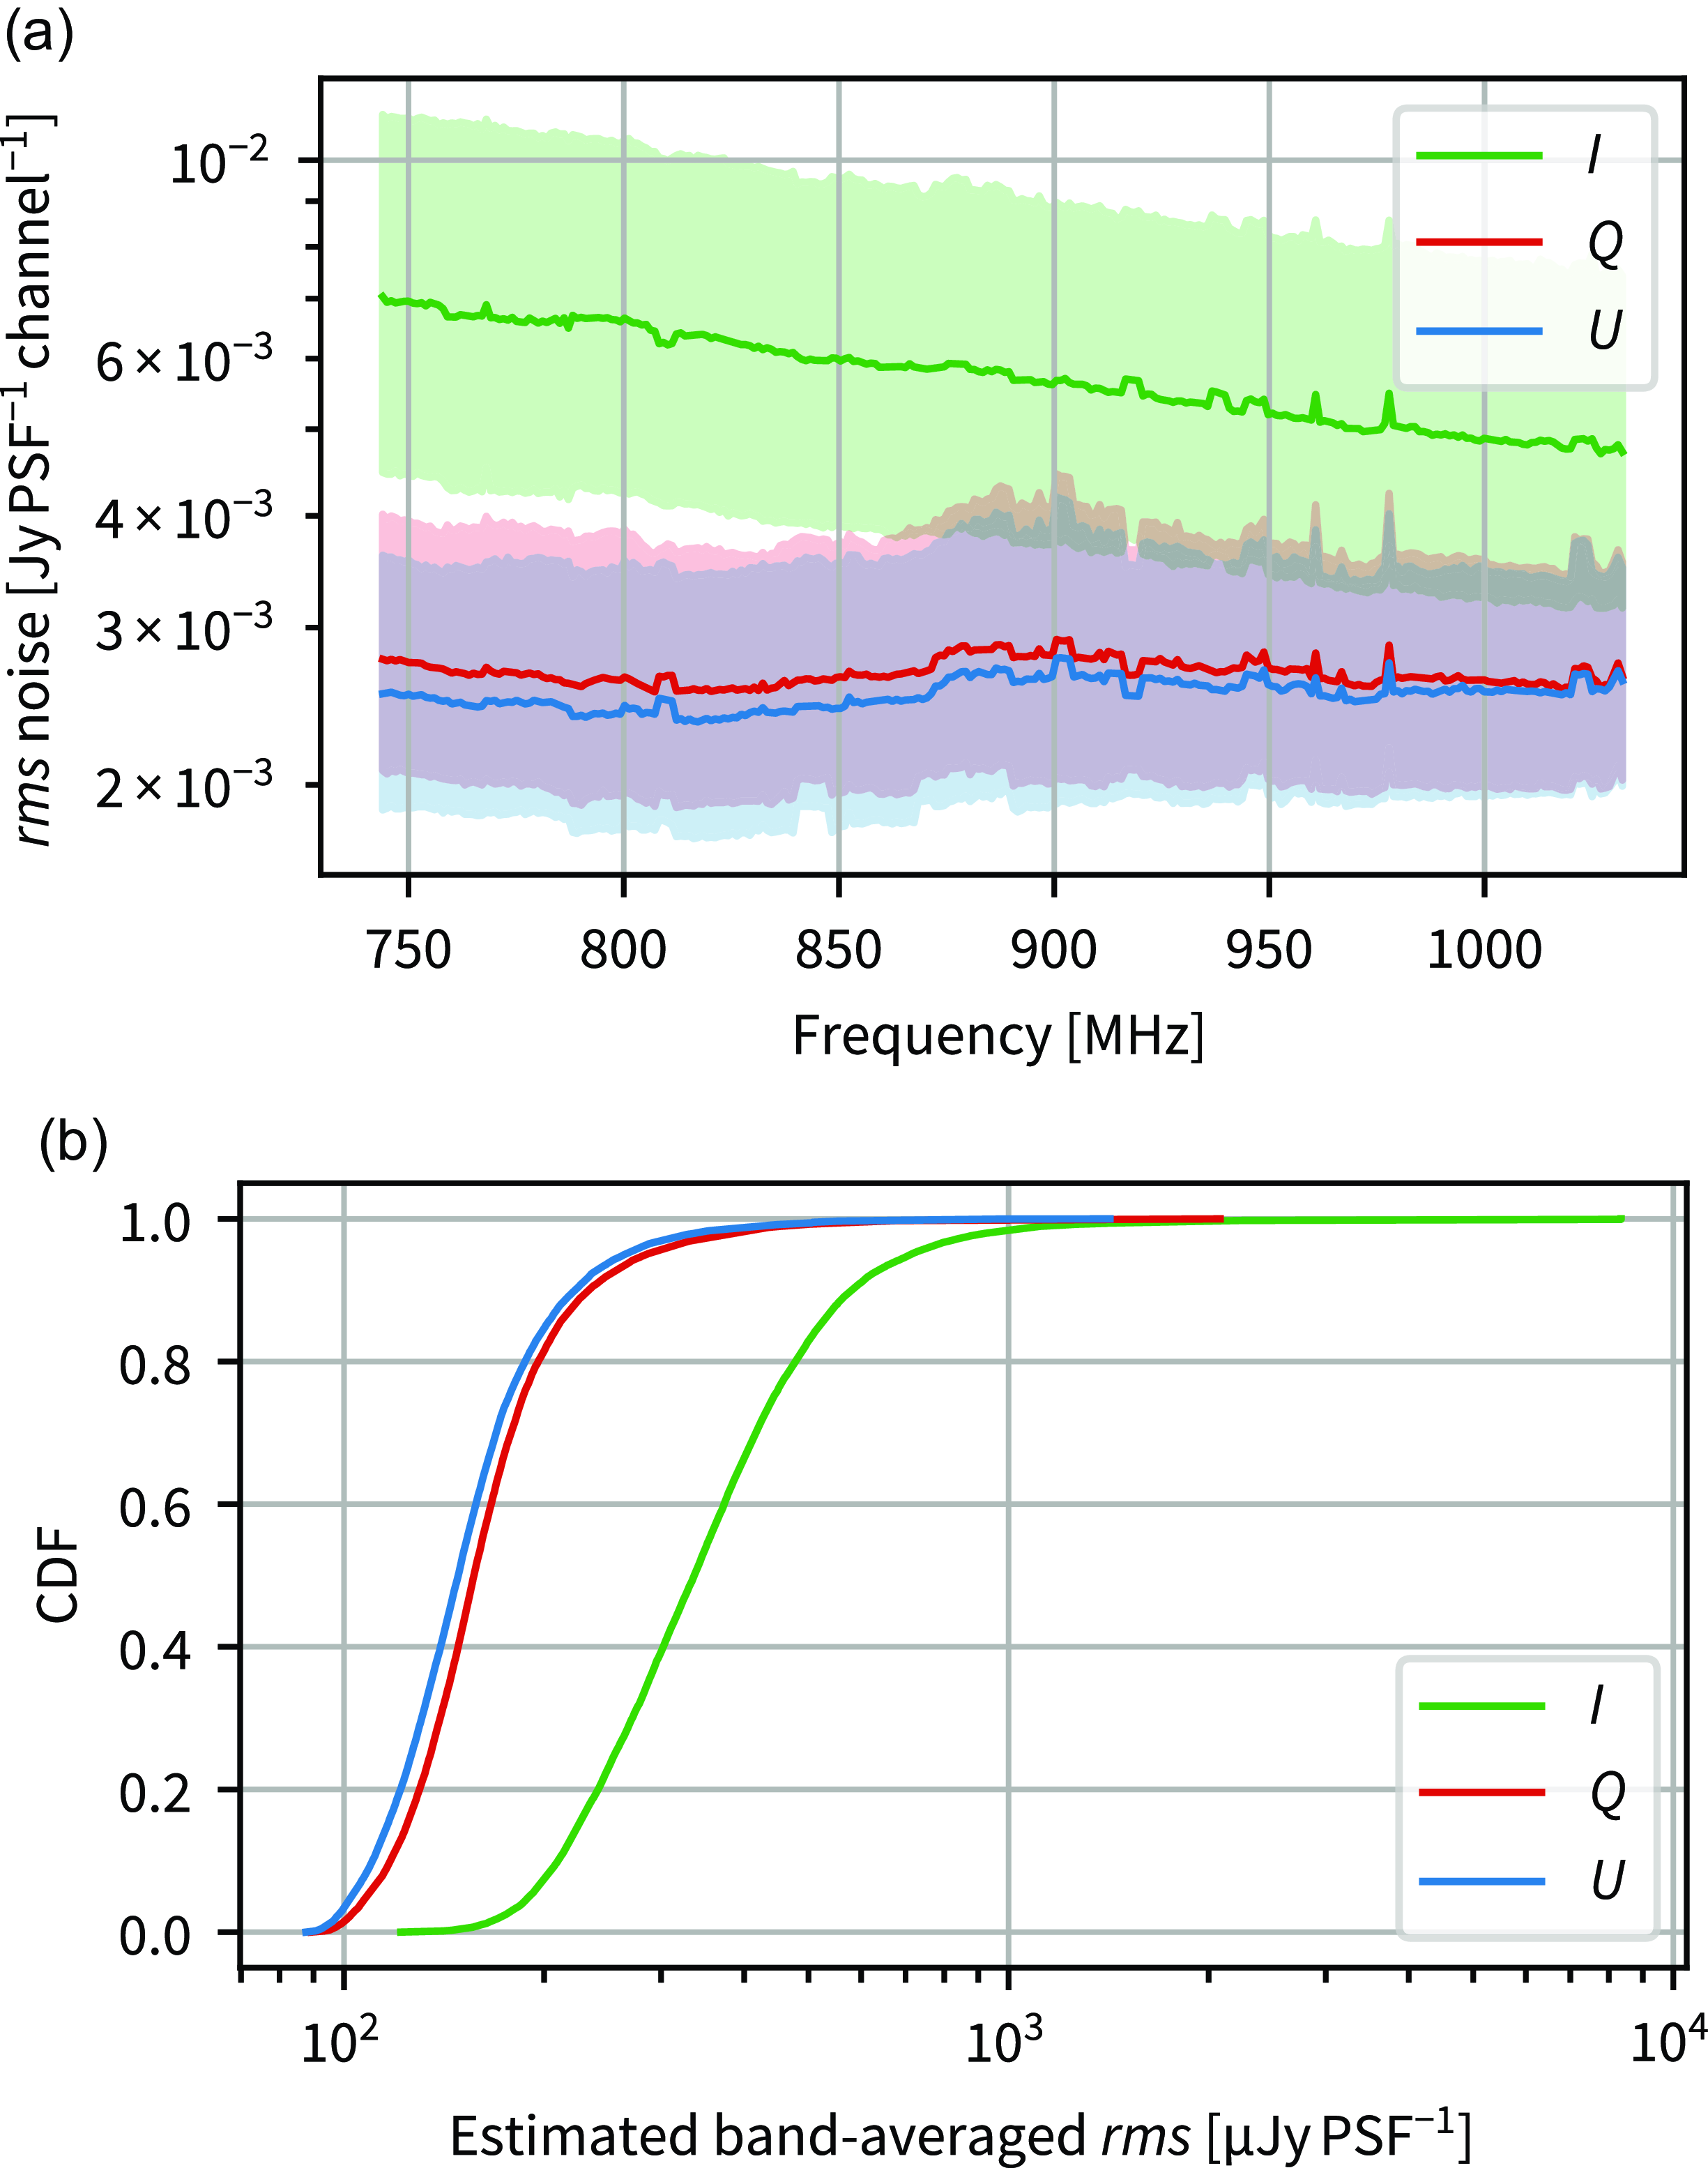
Figure 3. Measured rms noise in each Stokes parameter across all observed fields. (a) Noise as a function of frequency. We show the median noise with a solid line, and the $\pm1\sigma$
range as a shaded region. (b) The cumulative distribution function (CDF) of estimated band-averaged noise for each Stokes parameter. In Stokes Q and U we are approaching the theoretical noise limit, whereas in Stokes I the noise by a factor of 1.5 to 2 higher. We attribute this to the higher level of artefacts and sidelobes in the Stokes I images.
$\pm1\sigma$
range as a shaded region. (b) The cumulative distribution function (CDF) of estimated band-averaged noise for each Stokes parameter. In Stokes Q and U we are approaching the theoretical noise limit, whereas in Stokes I the noise by a factor of 1.5 to 2 higher. We attribute this to the higher level of artefacts and sidelobes in the Stokes I images.
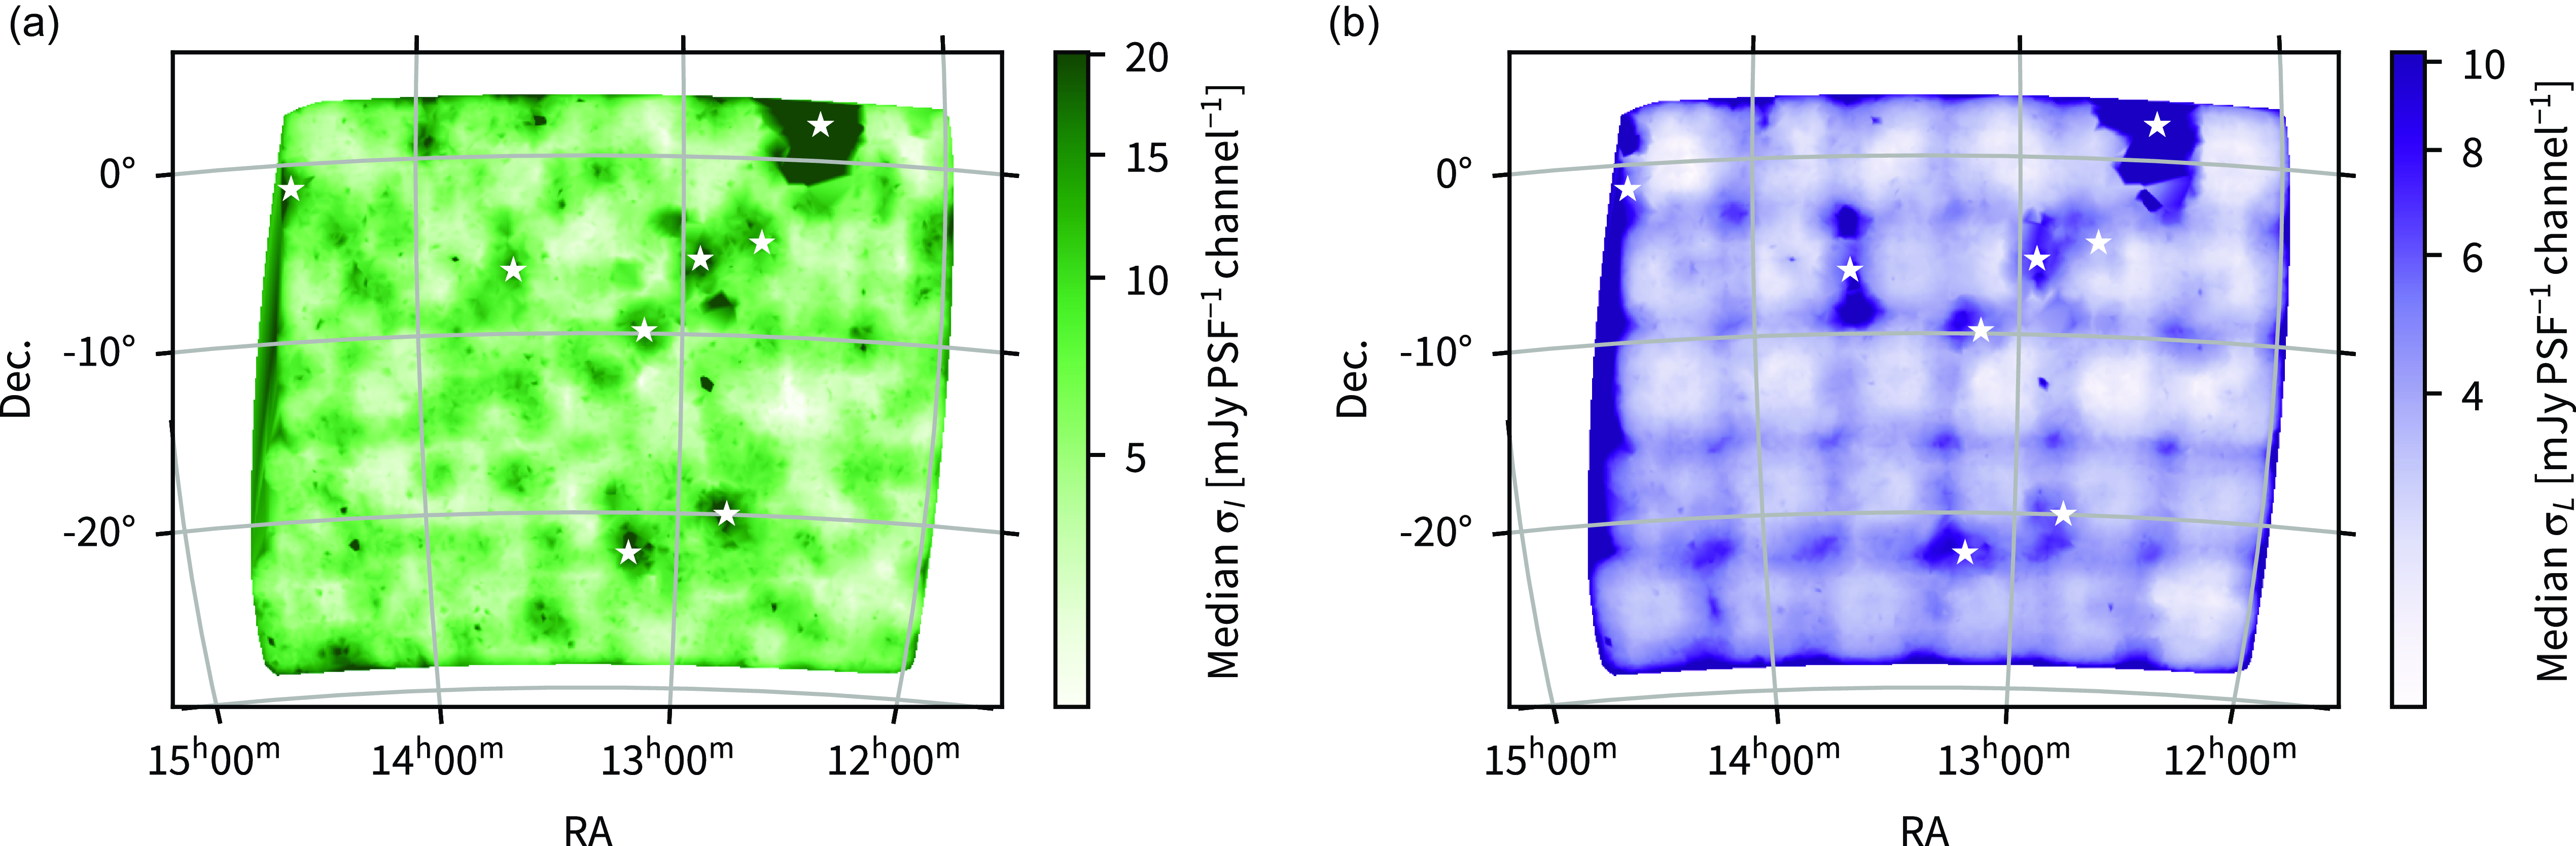
Figure 4. Spatial distribution of rms noise in (a) Stokes I and; (b) linearly polarised intensity (L). White stars indicate the position of components with a Stokes I flux density $>$
3 Jy/PSF. Our linear mosaicking of adjacent beams and fields (weighted by inverse-variance) produces a spatial pattern in the resulting noise. This effect is particularly noticeable in the
$>$
3 Jy/PSF. Our linear mosaicking of adjacent beams and fields (weighted by inverse-variance) produces a spatial pattern in the resulting noise. This effect is particularly noticeable in the $\sigma_L$
distribution, where the boundaries of our 30 square fields are apparent.
$\sigma_L$
distribution, where the boundaries of our 30 square fields are apparent.
In Appendix 1 of Thomson et al. (Reference Thomson, McConnell and Lenc2023), we detail our characterisation and correction for off-axis leakage as well as our estimates and flags for the effects of residual leakage. Since the fractional polarisation are simply scaled with respect to their corrected values, our flags for leakage remain correct. Our reported residual leakage should be approximately 2% close to the edge of the DR1 region, which then rises to over 6% towards to the edges of the DR1 region.
Finally, in §4.2 of Thomson et al. (Reference Thomson, McConnell and Lenc2023) we compared the fractional polarisation of SPICE-RACS data in comparison to Taylor et al. (Reference Taylor, Stil and Sunstrum2009). Our rescaling of the SPICE-RACS DR1 fractional polarisation, our analysis and conclusions no longer hold completely. We will revisit the analysis of this cross-comparison in our forthcoming DR2 paper.
Corrected data and availability
We have produced a corrected catalogue from the DR1 data release. The correction to the catalogue is simple, we scale the following higher by a factor of two: polint, polint_err, stokesQ, stokesU, fracpol, fdf_noise_rms, noise_chan, fdf_noise_mad, and leakage. We have published our corrected catalogue in place of the old versions on both the CSIRO ASKAP Science Data Archive (CASDA; Chapman et al., Reference Chapman, Dempsey, Miller, Lorente, Shortridge and Wayth2017; Huynh et al., Reference Huynh, Dempsey, Whiting, Ophel, Ballester, Ibsen, Solar and Shortridge2020) at https://data.csiro.au/collection/csiro:58508, and the CSIRO Data Access Portal (DAP) at https://data.csiro.au/collection/csiro:58409.
We also corrected the associated spectra and images in these collections. Users who have copies of the old data will need to scale the Stokes Q and U data higher (i.e. multiply) by a factor of two. We have placed instructions for users on CASDA, the DAP, and on the RACS website.Footnote 1
Data Availability
The data that support the findings of this study are openly available in the CSIRO ASKAP Science Data Archive and the CSIRO Data Access Portal at https://doi.org/10.25919/w37t-nw98 and https://data.csiro.au/collection/csiro:58409.


 Open access