


Survey experiments have become essential tools for social scientists. And yet, especially given that such research is increasingly being fielded online (as opposed to in-person, over the phone, or in a lab), a central concern is that some share of respondents will not be fully attentive. For example, respondents completing surveys remotely may rush through without fully considering what they are reading (Hauser and Schwarz, Reference Hauser and Schwarz2016; Thomas and Clifford, Reference Thomas and Clifford2017). This issue presents a critical challenge in experiments: to the extent that a sample is inattentive, “treatments” will not actually be received and, consequently, estimates of treatment effects will likely be biased toward zero.Footnote 1 Inattentiveness, therefore, threatens to fundamentally undermine what researchers can learn from their studies, thus stifling theoretical innovation.
Given the seriousness of this challenge, researchers have developed ways of assessing attentiveness in online surveys (e.g., see Druckman, Reference Druckman2021). One method comes from Kane and Barabas (Reference Kane and Barabas2019) who recommend using factual manipulation checks (FMCs) in experiments. Another technique uses question timers to gauge how long respondents spend on a given survey item (Niessen et al., Reference Niessen, Susan, Rob and Tendeiro2016; Wood et al., Reference Wood, Harms, Lowman and DeSimone2017). Others employ so-called “screeners,” which instruct respondents to provide specific answers to questions wholly unrelated to the experiment (Oppenheimer et al., Reference Oppenheimer, Meyvis and Davidenko2009). A primary goal of such tools is to help researchers diagnose which respondents are attentive. But, once this individual-level attentiveness is measured, researchers often use such tools for a second purpose—to re-estimate treatment effects for those deemed to be attentive—but this practice raises concerns.
Specifically, using a post-treatment variable (such as a manipulation check or timer) to remove respondents deemed to be inattentive to the experiment, or to interact with the treatment variable, can introduce covariate imbalances between the randomized treatment and control groups, therein biasing treatment effect estimates (e.g., Montgomery et al., Reference Montgomery, Nyhan and Torres2018; Aronow et al., Reference Aronow, Baron and Pinson2019; Coppock, Reference Coppock2019).
The question then becomes, how can researchers (1) measure individual-level attentiveness to experimental content, and (2) use this measure to estimate treatment effects among those deemed to be attentive, yet also (3) avoid introducing “post-treatment bias”? In this study, we propose a technique—mock vignettes—for simultaneously accomplishing these three objectives. A mock vignette (MV) contains descriptive information that is substantively similar to content found in political science experimental vignettes. Crucially, the MV appears before the researcher's experiment, and all respondents read the same MV. Next, respondents answer factual questions about the vignette that check for attentiveness to the MV. We refer to these items as mock vignette checks (MVCs). From the respondent's perspective, this technique simulates the format of a typical survey experiment: respondents are asked to read and consider a short paragraph of information (i.e., a vignette) generally related to current and/or governmental affairs, and then are asked follow-up questions (e.g., Mutz Reference Mutz2011; Steiner et al., Reference Steiner, Atzmüller and Su2016).
Using responses to MVCs, the researcher can construct an individual-level measure of attentiveness as it exists immediately prior to the actual experiment. Moreover, this measure can then be used to analyze respondents who perform better on the MVCs—specifically, to present not only the average treatment effect (ATE) estimated for the sample as a whole (or, more accurately, the intention-to-treat (ITT) estimate), but also the conditional average treatment effect (CATE) by interacting the treatment with performance on the MVCs. To the extent that inattention is downwardly biasing a treatment effect, then, the researcher should observe stronger treatment effects when analyzing those who perform better (versus worse) on the MVCs. Most importantly, by virtue of appearing prior to randomization in the researcher's experiment, utilizing MVs bypasses the problem of post-treatment bias (see Montgomery et al., Reference Montgomery, Nyhan and Torres2018: 771).
To test the merits of our mock vignette approach, we replicate a series of published experiments using samples from a variety of common online respondent pools (MTurk, Qualtrics, NORC, and Lucid). In each study, we feature one MV and at least one MVC immediately prior to the experiment. We consistently find, first, that treatment effects are significantly stronger among those who performed well (versus poorly) on the MVCs. Second, we find that MVC passage is strongly predictive of performance on other established measures of attentiveness, including timers on various items in the experiment (e.g., the MV itself, experimental vignettes and experimental outcome question(s)) and FMCs. Third, we investigate the possibility that MVs may inadvertently prime various respondents or generate additional fatigue, and thus substantially alter the ITT relative to what would have been observed had no MV been employed. Across each of our studies that randomly assigned whether an MV was featured, we find no evidence for this concern. We also investigate whether there exist demographic and/or political correlates of MVC performance. Overall, and consistent with extant research, we find only a couple of demographic variables to be consistently associated with MVC performance (namely, age and race), though these correlations were modest in size. However, we do not find any consistent evidence of political variables (i.e., party identification, ideological self-placement, and political interest) being associated with MVC performance. Finally, we find that MVCs perform modestly better, on several dimensions, than a common alternative method for assessing respondent attentiveness.
MVs thus enable researchers to test hypotheses on respondents who are likely to have been attentive to their experiment. Further, MVs can be used in conjunction with other tools (such as manipulation checks) and techniques (such as pre-treatment warnings (Clifford and Jerit, Reference Clifford and Jerit2015)) aimed at measuring and augmenting respondent attentiveness to the experiment. Finally, we offer researchers a variety of ready-made MVs and MVCs, each validated with online-sample data and complete with various descriptive analyses, including passage rates, measures of complexity, and item response theory analyses.
Although designed to resemble vignette-based experiments, MVs/MVCs can be of potential value in other related experiments (e.g., conjoint, question-wording, or list experiments). Our findings suggest that by implementing an MV before their experiment, researchers are better equipped to overcome the challenge of respondent inattentiveness, and can therefore perform fairer, more reliable, and more robust tests of their hypotheses.
1. Inattentiveness and post-treatment bias
Whether researchers attempt to identify them or not, experiments will likely contain a sizable share of inattentive respondents. Respondents may be distracted during the experiment (Clifford and Jerit, Reference Clifford and Jerit2014), or simply “satisfice” as a means of completing the survey as quickly as possible to receive payment (Krosnick et al., Reference Krosnick, Narayan and Smith1996; Anduiza and Galais, Reference Anduiza and Galais2017). Such inattentiveness represents a form of experimental noncompliance, which, as Harden et al. (Reference Harden, Sokhey and Runge2019: 201) contend, “poses real threats to securing causal inferences and drawing meaningful substantive conclusions.” This is largely because inattentiveness to the experiment and/or its outcome measures threatens to bias treatment effects downward toward zero, thereby increasing the probability of a type II error.Footnote 2 Imprecise estimates, and/or null or substantively weak effects may be mistakenly interpreted as a flawed theory or design, rather than as a consequence of respondent noncompliance.
Strategies for improving precision include developing stronger treatments via pretesting, blocking, including pre-treatment covariates that predict the outcome, or simply increasing sample size (e.g., see Shadish et al., Reference Shadish, Cook and Campbell2002). Yet these options are not always feasible, nor do they actually address the problem of noncompliance downwardly biasing effect sizes. A larger sample, for example, may help yield a treatment effect that is “statistically significant,” but the magnitude of that effect will nevertheless likely be smaller than it would have been had the sample been more attentive.
Recent literature has promoted the use of various tools for directly measuring respondent attentiveness. Kane and Barabas (Reference Kane and Barabas2019), for example, recommend post-outcome FMCs, which are objective questions about the experimental information given to respondents. Others have utilized instructional manipulation checks (IMCs), also known as “screeners,” which are ostensibly banal questions about unrelated topics that discreetly ask respondents to answer in a specific fashion (Oppenheimer et al., Reference Oppenheimer, Meyvis and Davidenko2009; Berinsky et al., Reference Berinsky, Margolis and Sances2014; Hauser and Schwarz, Reference Hauser and Schwarz2015). In these studies and elsewhere, answering such manipulation check questions correctly (incorrectly) is indicative of greater (less) respondent attentiveness. An alternative approach involves the use of question timers, wherein the amount of time that respondents spend on a given screen (e.g., an experimental vignette) is recorded. For such time measures (or, latencies), low scores indicate insufficient attention (Niessen et al., Reference Niessen, Susan, Rob and Tendeiro2016; Wood et al., Reference Wood, Harms, Lowman and DeSimone2017; Zwaan et al., Reference Zwaan, Pecher, Paolacci, Bouwmeester, Verkoeijen, Dijkstra and Zeelenberg2018; Harden et al., Reference Harden, Sokhey and Runge2019: 3).
What can be done with these measures? On the one hand, they can be used to gauge the overall share of attentive respondents participating in the study as a whole (and, in the case of FMCs and timers, also the share of respondents attentive to a particular experimental condition). This serves as a useful diagnostic tool to help adjudicate between competing interpretations of a given result (e.g., a non-significant result being due to a misguided theory and/or hypothesis versus being due to substantial respondent inattentiveness). FMCs also have the added benefit of enabling the researcher to ensure that responses correlate with treatment assignment, thereby functioning not only as a measure of attention to the content but also as evidence that the manipulation itself was sufficiently perceived.
However, researchers have also tended to use such measures when estimating treatment effects. For example, some researchers simply subset the data on this measure, in effect excluding from the analysis respondents deemed insufficiently attentive (see Aronow et al., Reference Aronow, Baron and Pinson2019; Druckman Reference Druckman2021). Along similar lines, researchers attempt to specify such measures as control variables in regression models, or interact these measures with the treatment indicator variable to test whether the treatment effect differs across levels of attentiveness. The problem with such techniques is that they, in effect, threaten to “de-randomize” the experimental groups (Coppock, Reference Coppock2019). That is, conditioning on a post-treatment variable threatens to create treatment and control groups that are compositionally dissimilar, potentially yielding a biased estimate of the treatment effect. Worse still, researchers have limited statistical ability to completely rule out the possibility of post-treatment bias (Acharya et al., Reference Acharya, Blackwell and Sen2016; Montgomery et al., Reference Montgomery, Nyhan and Torres2018: 772–773).
With these interrelated challenges in mind, we propose an alternative technique for measuring respondent attentiveness to experimental content that can be easily incorporated into analyses of survey experiments (including more elaborate experiments, such as factorial designs and conjoint experiments). We refer to this technique as a mock vignette (MV).
2. Mock vignettes
Any measure of attentiveness to the experiment itself, as well as any measure of attentiveness occurring after the experiment, is a post-treatment measure. Manipulation checks and timers on experimental items, therefore, risk introducing bias when employed in the estimation of treatment effects. Thus, while such a measure is ideal because it directly gauges attentiveness to one's experiment, an alternative is needed if we wish to also re-estimate treatment effects on the attentive respondents.
In proposing such a measure, we first reason that, because respondent attentiveness varies throughout the course of a survey (e.g., Alvarez et al., Reference Alvarez, Atkeson, Levin and Li2019), the measure should be as close in proximity to the experiment as possible—ideally, immediately pre-treatment. Second, the best alternative to measuring attentiveness to the experimental content itself would be to measure attentiveness to content of a similar format and general nature. Designed as such, a respondent's attentiveness to this pre-treatment content can thus function as a proxy for the respondent's attentiveness to the actual experiment's vignettes and outcome measure(s).
We therefore propose that researchers employ a pre-treatment MV and follow-up “check” questions (MVCs) in their experiments. The MV should, as is typical of experimental vignettes and/or outcome measures in political science, display information to respondents (Steiner et al., Reference Steiner, Atzmüller and Su2016). The MV's content can, for example, involve descriptive information about some news or policy-related event. In this way, MVs are designed to simulate the experience of participating in a typical online survey experiment. Yet the MV should also be free of any explicitly partisan, ideological, or otherwise strongly evocative content as the MV's function is not to, itself, exert any discernible treatment effects. Crucially, each respondent sees the exact same MV and MVCs.
Next, respondents are asked at least one MVC, which is a factual question about the content they were just instructed to read in the MV, and which appears on a different screen from the MV. As any given MVC should have only one correct answer, researchers can use responses to the MVC to construct an individual-level measure of attentiveness to the MV (i.e., answering correctly is indicative of greater attentiveness). When multiple MVCs are employed (see examples below) an attentiveness scale can be constructed as one would for other social science concepts. Following the MV and MVC(s), each respondent is then randomly assigned to an experimental condition.
Once this procedure is complete, the researcher is equipped with a pre-treatment measure of respondent attentiveness. More specifically, the researcher will possess what is akin to a pre-treatment measure of the attentiveness the respondent would have exhibited during the researcher's experiment. This measure can then be used to re-estimate the ATE among respondents deemed to be attentive while bypassing the threat of post-treatment bias (Montgomery et al., Reference Montgomery, Nyhan and Torres2018: 770–771). Similarly, the researcher can test the robustness of their ITT estimate by interacting the treatment indicator with MVC performance: if a treatment were indeed efficacious, such an analysis will tend to reveal substantively stronger CATEs among those who performed better (versus worse) on the MVC(s).
In sum, employing an MV approach potentially offers researchers a new method for both analyzing the attentive and bypassing post-treatment bias. As attentiveness is typically a precondition for being able to be treated, it should be the case that better MVC performance is associated with stronger treatment effects. The following sections directly investigate this hypothesis.
3. Data and methods
We conducted five studies, beginning in May of 2019 through February of 2020, featuring US adults. Table 1 provides an overview of the first four studies (the fifth is detailed below), including their respective sample sizes. Two of these studies (MTurk 1 and MTurk 2) feature samples from Amazon.com's Mechanical Turk. Another study (Qualtrics) uses a nonprobability sample collected by Qualtrics, which employed quotas to obtain a sample nationally representative in terms of age, race/ethnicity, and geographic region. Lastly, and recruited by the National Opinion Research Center (NORC), the NORC study features a nationally representative probability sample from NORC's “AmeriSpeak Omnibus” survey.
Table 1. Overview of samples, MVs, and experiments
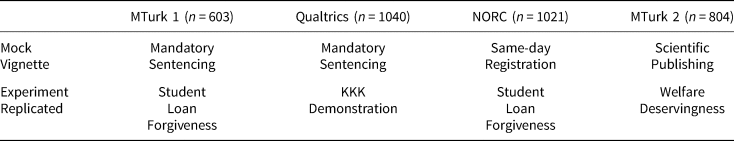
Notes: Text for all MVs and experimental vignettes appears in Supplementary Appendices B and C. “Student Loan Forgiveness” = Mullinix et al. (Reference Mullinix, Leeper, Druckman and Freese2015); “KKK Demonstration” = Nelson et al. (Reference Nelson, Clawson and Oxley1997); “Welfare Deservingness” = Aarøe and Peterson (Reference Aarøe and Petersen2014). N sizes reflect sample used for replicating experiment; Qualtrics and NORC studies had 25% of sample randomly assigned to not receive an MV/MVCs.
Each of these studies featured the same basic design depicted in Figure 1. Respondents in each study were shown the same MV, then answered at least one factual question aimed at checking attentiveness to this MV (with no ability to “go back” to the MV). Again, we refer to this factual question as a mock vignette check (MVC).
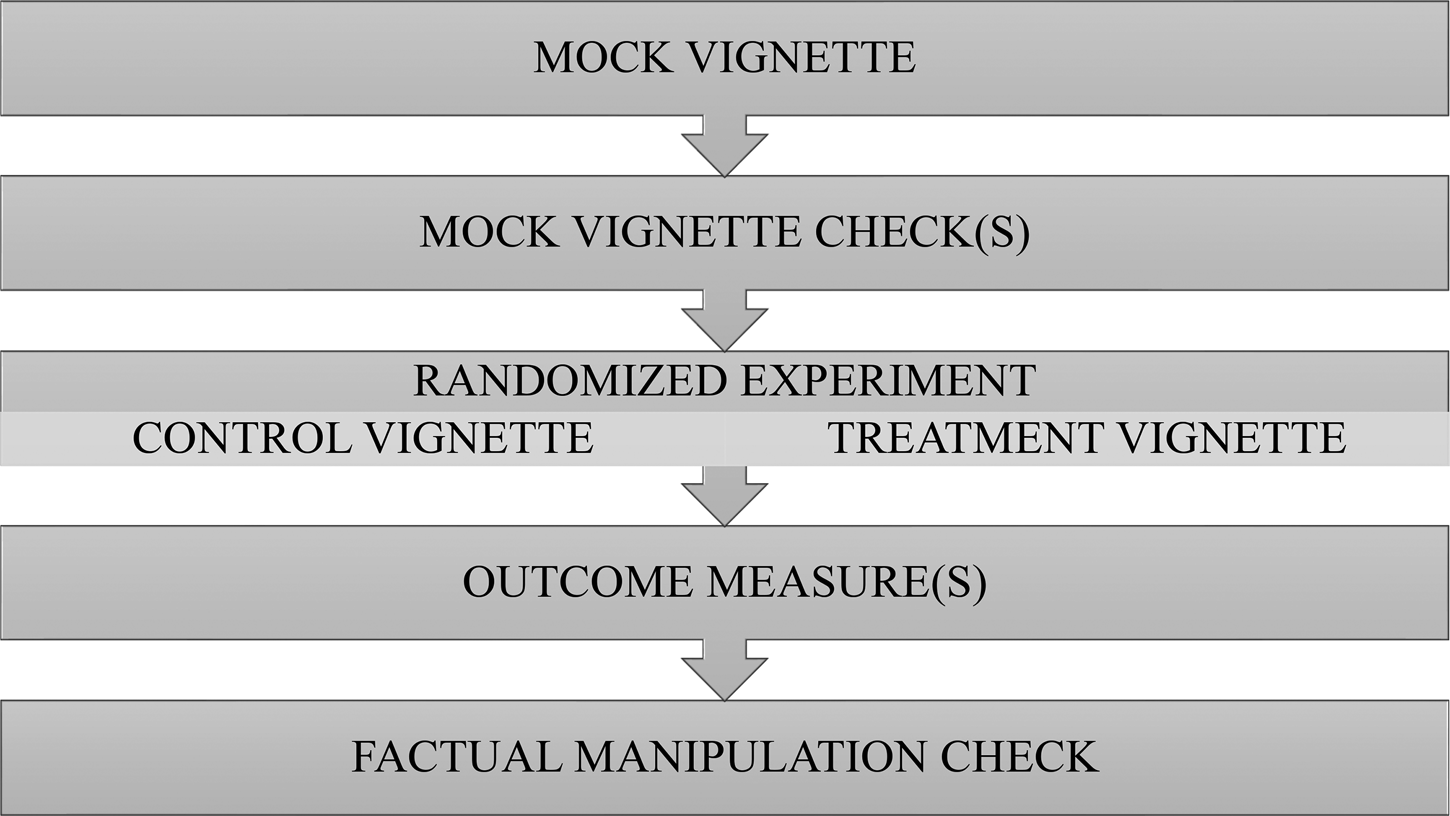
Figure 1. Implementation of MVs in each study.
Notes: Design used in the MTurk 1, Qualtrics, MTurk 2, and NORC studies. Respondents in the Lucid study participated in this process twice. Each box represents a different screen viewed by respondents. Timers were used on each screen to record the amount of time (in milliseconds) respondents spent on each screen. All studies featured an experiment with two conditions.
Respondents were then randomly assigned to one of the two conditions from a previously published experiment (detailed below). After viewing one of these randomly assigned vignettes, respondents answered an outcome question(s) drawn from the original experiments that we replicated. Finally, in each study, we placed an FMC immediately after the experimental outcome measure(s), and also featured timers on each screen (unseen by respondents). These latter steps permit benchmarking MVCs versus other measures of attention to the experiment itself (discussed in detail below).
In the fifth experiment—the Lucid 1 study—each respondent experienced two iterations of the design featured in Figure 1.Footnote 3 In other words, within each of two separate rounds, each respondent was randomly assigned one of the four possible MVs (and its corresponding MVCs), as well as one of the four possible experiments. (In the second round, respondents could not view the same MV, nor the same experiment, from the previous round.) This design thus permits estimation of correlations between different MVCs. Second, it effectively yields two observations per respondent, which improves model efficiency and statistical power. Third, because each experiment could be preceded by any of the four MVs, it enables us to investigate whether any observed results are dependent upon which particular MV was featured before the experiment. Table 2 lists the specific MVs and experiments featured in the Lucid 1 study.
Table 2. Overview of samples, MVs, and experiments (Lucid study)
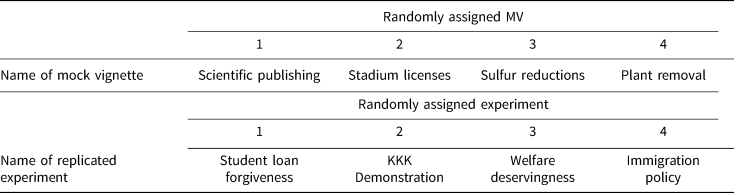
Notes: In the Lucid study, respondents were assigned to two rounds, each with one MV followed by one experiment (respondents could not be assigned the same MV or experiment twice). Text for all MVs and experimental vignettes appears in Supplementary Appendices B and C. “Student Loan Forgiveness” = Mullinix et al. (Reference Mullinix, Leeper, Druckman and Freese2015); “KKK Demonstration” = Nelson et al. (Reference Nelson, Clawson and Oxley1997); “Welfare Deservingness” = Aarøe and Peterson (Reference Aarøe and Petersen2014); “Immigration Policy” = Valentino et al. (Reference Valentino, Soroka, Iyengar, Aalberg, Duch, Fraile, Hahn, Hansen, Harell, Helbling, Jackman and Kobayashi2019). Total N = 5644. Samples sizes in the first round: MV: (1) 1112; (2) 1116; (3) 1109; (4) 1128; experiment: (1) 1411; (2) 1411; (3) 1410; (4) 1412. Sample sizes in the second round: MV: (1) 1355; (2) 1360; (3) 1357; (4) 1363; experiment: (1) 1358; (2) 1362; (3) 1359; (4) 1356.
3.1 Mock vignettes featured
Regarding the MVs, the “Mandatory Sentencing” MV noted in Table 1 features adapted text from a published experiment by Gross (Reference Gross2008; see “Episodic Frame” on pp. 185–186). All other MVs featured in Tables 1 and 2, however, were constructed by the authors, though were based upon actual research and/or recently published news articles. These latter MVs were one paragraph in length, and averaged approximately 140 words (min = 122; max = 159). In brief: “Same-Day Registration” discusses the potential costs of implementing same-day voting registration policies in various states; “Scientific Publishing” discusses controversy around a potential policy change in publishing of federally funded research; “Stadium Licenses” discusses a small town's plan to produce an event; “Sulfur Reductions” discusses an upcoming requirement that ships reduce sulfur dioxide emissions; and “Plant Removal” discusses a city council's new requirement that property owners remove hazardous vegetation from their properties. As an example, Table 3 provides the verbatim text of one of these MVs (“Scientific Publishing”) and its corresponding MVCs. Verbatim text for all other MVs and MVCs, as well as additional details regarding source material, can be found in the Supporting Information (SI) file (Section A).
Table 3. Example MV and MVCs (scientific publishing)
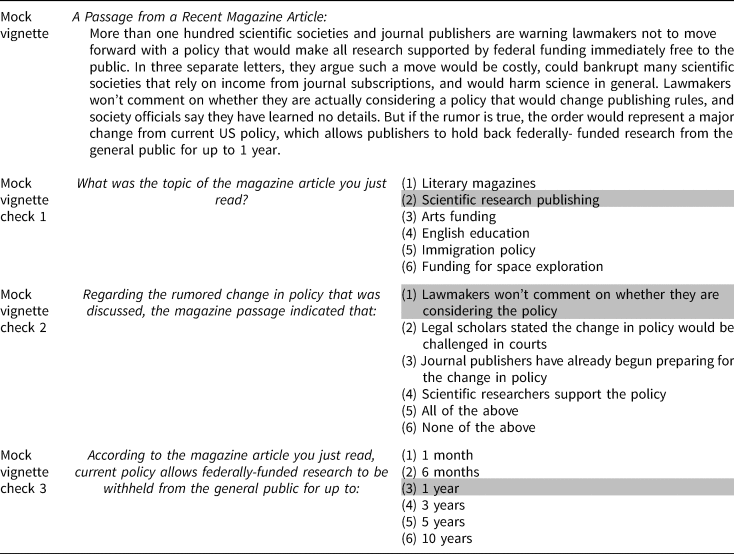
Notes: MVCs presented in this order. Response options (excluding “All of the above” and “None of the above”) were randomized. Correct responses are highlighted in gray.
Except for the “Minimum Sentencing” MV (which only featured one MVC), each MV had three corresponding MVCs. Each MVC had between 5 and 6 closed-ended, randomized response options. By virtue of each MVC having only one correct answer, responses to each MVC are coded as either incorrect (0) or correct (1). In every study except for NORC, respondents were required to offer a response to each MVC, and in each study they were not permitted to go back to a previously viewed MV passage. The MVCs appeared in a fixed order, with later questions typically referencing material that appeared later in the MV's text.Footnote 4 When multiple MVCs were used, these were first coded as either incorrect (0) or correct (1), and then combined into an additive scale (see below).
3.2 Prior experiments replicated
Regarding the experiments we featured (see Tables 1 and 2), the “Student Loan Forgiveness” study is a replication of an experiment conducted by Mullinix et al. (Reference Mullinix, Leeper, Druckman and Freese2015).
This experiment featured a control condition and a treatment condition, with the latter providing information critical of student loan forgiveness for college students. With support for student loan forgiveness measured on a 7-point scale (ranging from strongly oppose to strongly support), the authors found that the treatment significantly reduced support for student loan forgiveness. This experiment has also been replicated successfully in previous research (e.g., Kane and Barabas, Reference Kane and Barabas2019).
The “KKK Demonstration” study features the canonical experiment conducted by Nelson et al. (Reference Nelson, Clawson and Oxley1997). These authors found that framing an upcoming demonstration by the Ku Klux Klan as a matter of ensuring public order and safety, as opposed to a matter of free speech, yielded significantly lower support for the demonstration to continue (again, measured on a 7-point scale ranging from strongly oppose to strongly support). This experiment has also been replicated in prior studies (e.g., Mullinix et al., Reference Mullinix, Leeper, Druckman and Freese2015).
The “Welfare Deservingness” study features the experiment conducted by Aarøe and Petersen (Reference Aarøe and Petersen2014). To maintain only two conditions (as in the other experiments), we omitted the original control condition, leaving only the “Unlucky Recipient” and “Lazy Recipient” conditions. The authors found that, when discussing an individual as being out of a job due to a lack of motivation (“lazy”), as opposed to due to a work-related injury (“unlucky”), US and Danish support for tightening welfare eligibility requirements (“for persons like him”) significantly increases. This latter variable is referred to as “opposition to social welfare,” and is measured on a 7-point scale (ranging from strongly disagree to strongly agree).
Lastly, the “Immigration Policy” study replicates an experiment, conducted in multiple countries, by Valentino et al. (Reference Valentino, Soroka, Iyengar, Aalberg, Duch, Fraile, Hahn, Hansen, Harell, Helbling, Jackman and Kobayashi2019). Again, to restrict the number of experimental conditions to two, we adapted the experiment to involve only two vignettes involving male immigrants: one is a “low-status” (i.e., low education and part-time working) Kuwaiti individual, and the other a “high-status” (i.e., highly educated and employed in a technical position) Mexican individual. The authors find that both lower-status individuals, and individuals from Muslim-majority countries, elicit lower public support for allowing the individual to immigrate into the country. Specifically, the outcome measure is an additive scale comprising three separate items that gauge support for permitting the individual to work and attain citizenship in the respondents' home country. This scale ranges from 0 to 1, with higher values indicating greater support. The text for all aspects of the replicated studies—that is, the vignettes, outcome response options, and FMCs—can be found in the SI (Section B).
4. Results
Beginning with performance on the MVCs, our MTurk 1 study obtained a passage rate (i.e., the share of respondents who answered the MVC correctly) of 71 percent, while the Qualtrics study had a passage rate of 64 percent.Footnote 5 For the NORC and MTurk 2 studies, which featured one MV with three MVCs, passage rates for any given MVC ranged from 36 to 81 percent, and 44 to 80 percent, respectively. In the Lucid 1 study, passage rates were generally between 50 and 80 percent.
4.1 MVC performance and treatment effect size
We now investigate whether MVC passage is associated with larger treatment effect sizes. Given word-limit constraints on this manuscript, and because the MTurk 1 and Qualtrics studies were unusual in that they only featured one MVC, we detail the results for these two studies in the SI (Section C). In brief, for both studies, we find (1) stronger treatment effects among MVC passers relative to non-passers, (2) that treatment effects among MVC passers were statistically significant at the p < 0.01 level, and (3) that treatment effects among MVC non-passers failed to attain significance at conventional levels. This serves as preliminary evidence that MVCs identify respondents for whom experimental treatments will be more efficacious and, conversely, identify respondents who are less attentive and, thus, less affected by the treatment information.
Compared to the MTurk 1 and Qualtrics studies, a major advantage of the NORC and MTurk 2 studies is that, while each features only one MV, there are three accompanying MVCs. Employing multiple MVCs yields a scaled measure of attentiveness that is likely to contain less measurement error than that of a single MVC.
Figure 2 displays the CATE, in both the NORC (top panel) and MTurk 2 (bottom panel) studies, across MVC performance. In each study, the dependent variable has been rescaled to range from 0 to 1 to enhance interpretability. Histograms are also featured to convey the distribution of MVC performance within each study, with the right y-axis of each graph displaying the percentage of the sample passing a given number of MVCs.
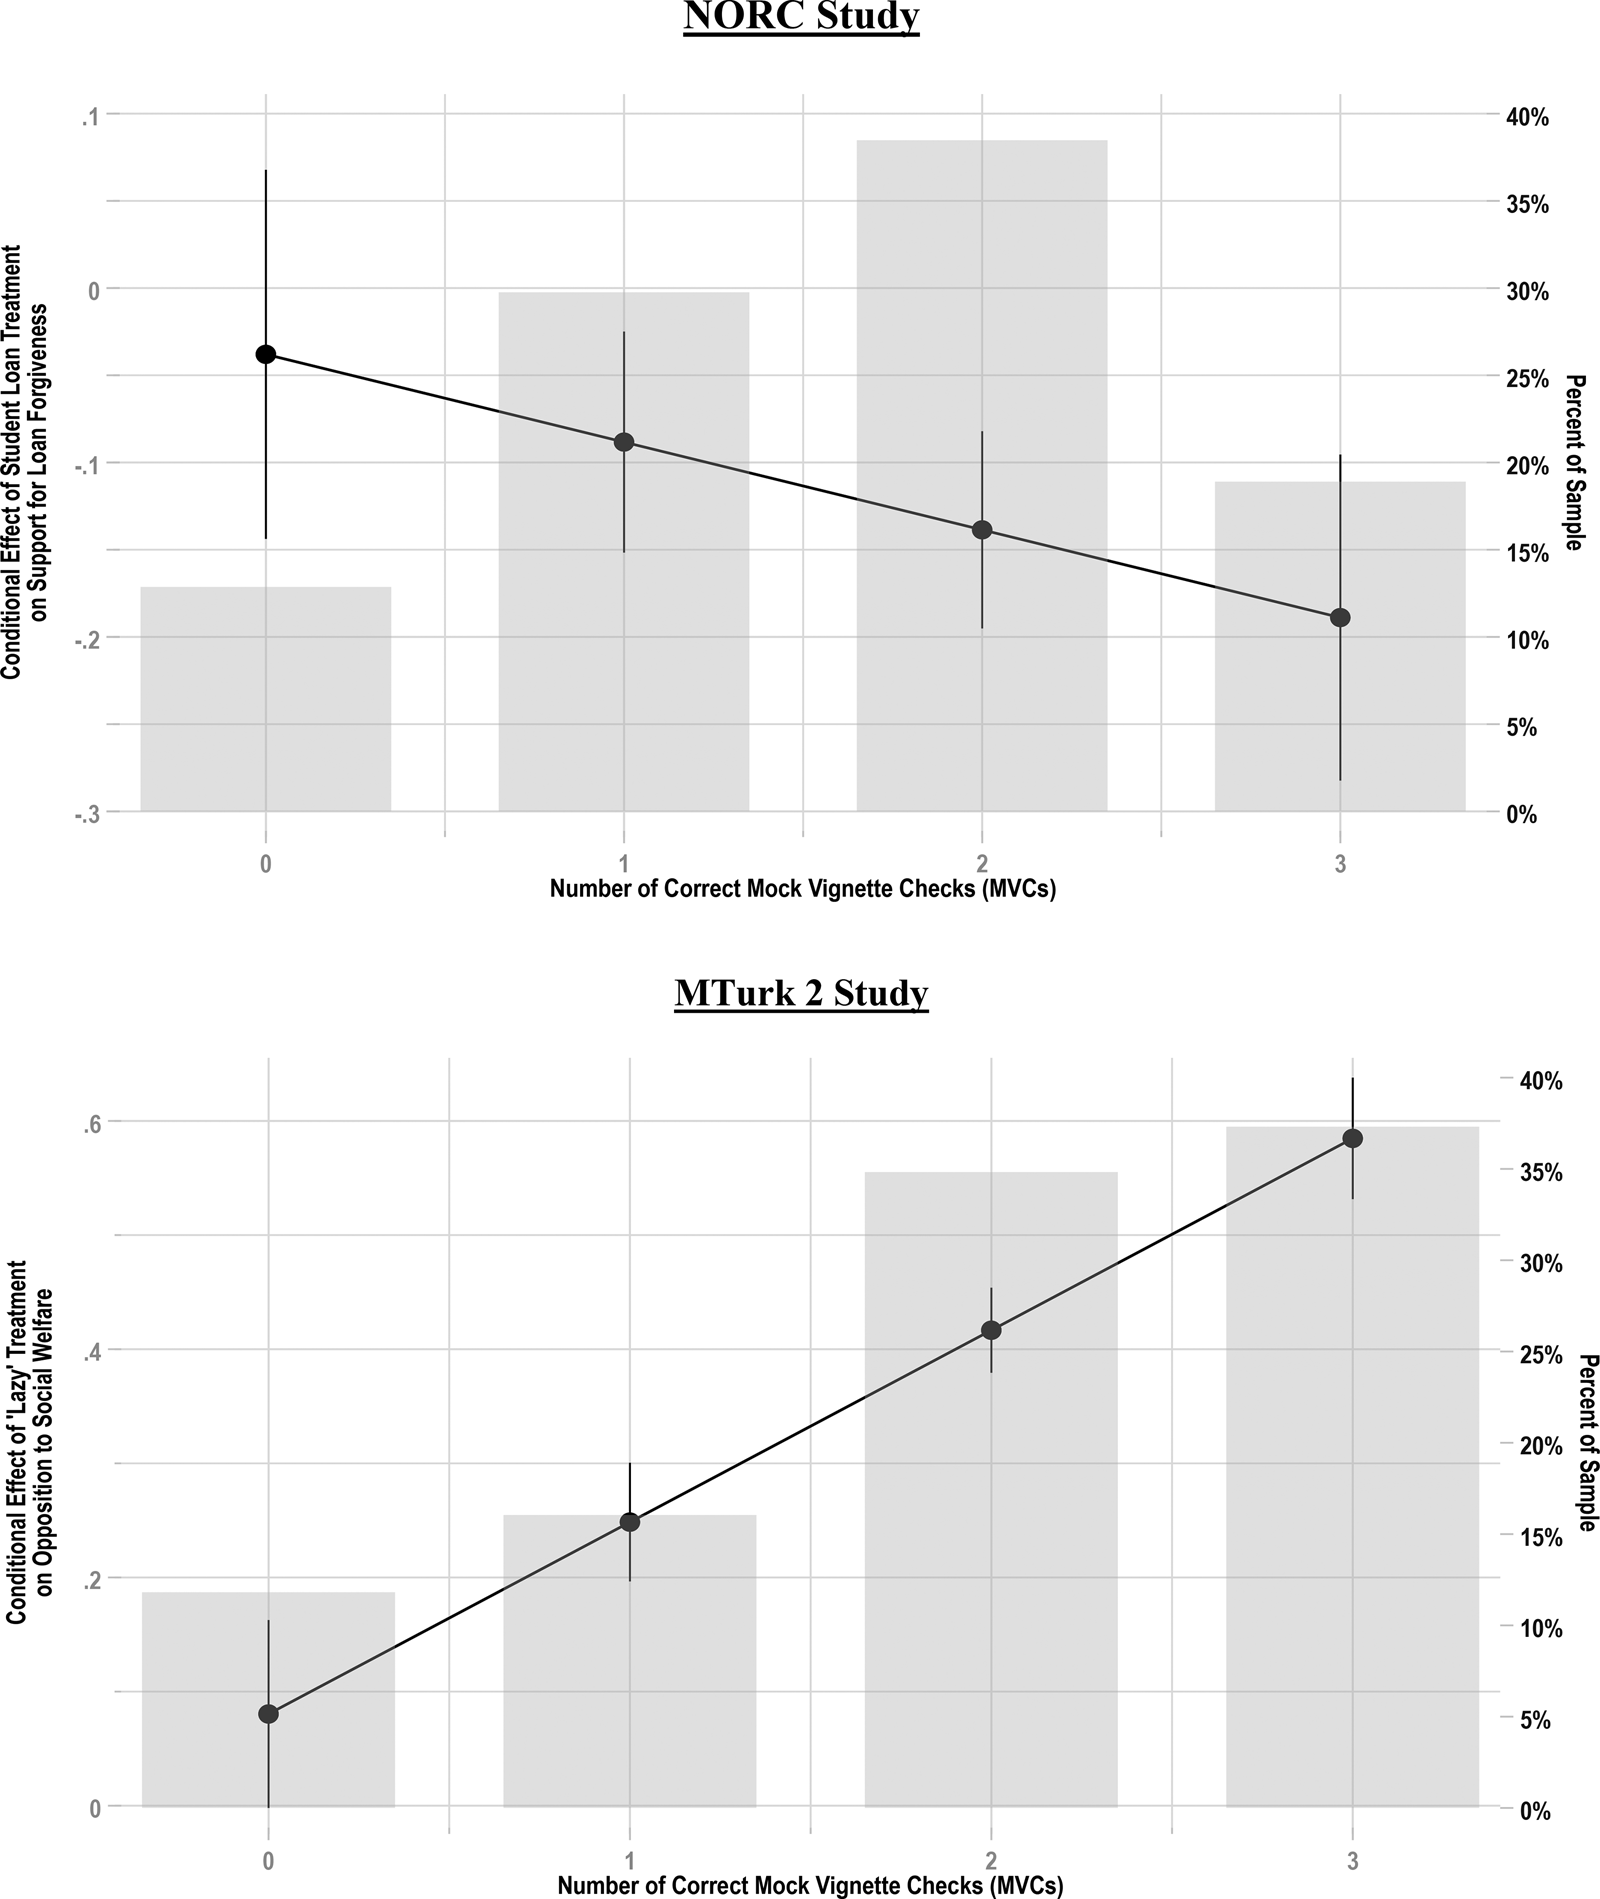
Figure 2. MVC performance associated with larger treatment effects.
Notes: Figure displays treatment effect estimates for “Student Loan Forgiveness” experiment (top panel) and “Welfare Deservingness” experiment across performance on the MVC scale (95 percent CIs shown). Top (bottom) panel shows that the negative (positive) effect observed in original experiment grows larger in magnitude as MVC performance increases. Histogram represents the percent of the sample correctly answering × MVCs. Total N = 744 (NORC) and 804 (MTurk Study 2).
The top panel of Figure 2 (NORC data) features the “Student Loan” experiment, in which the treatment is designed to significantly reduce support for student loan forgiveness (Mullinix et al., Reference Mullinix, Leeper, Druckman and Freese2015). We observe that although the estimated CATE is only slightly negative (−0.038, or −3.8 percentage points) and non-significant among those who passed zero MVCs, the estimated CATE grows substantially more negative, and becomes statistically significant (i.e., the 95 percent confidence intervals (CIs) no longer overlap with 0), with better performance on the MVCs.Footnote 6 This interaction between treatment and MVC performance was statistically significant (p < 0.05, one-tailed). At the highest level of MVC performance (all three MVCs correct (approximately 19 percent of the sample)), the estimated CATE reveals a nearly 20 percentage-point decrease in support for student loan forgiveness. This effect is far larger than the −3.8 percentage-point effect that was observed among those who did not answer any MVCs correctly (approximately 13 percent of the sample). As this analysis demonstrates, inattentiveness in the sample attenuates the treatment effect observed for the sample as a whole, thereby increasing the risk of a type II error and undermining hypothesis testing.Footnote 7
The results for the MTurk 2 study (see bottom panel of Figure 2) are even more pronounced. Replicating the social welfare deservingness experiment (Aarøe and Petersen, Reference Aarøe and Petersen2014), the bottom panel of Figure 2 indicates that the effect of the “lazy” treatment on opposition to social welfare substantially increases with better MVC performance. This interaction between treatment and MVC performance was again statistically significant (p < 0.001). Specifically, at zero MVCs correct (approximately 12 percent of the sample), the estimated treatment effect is relatively small (0.08 on a 0–1 scale), with a 95 percent CI that narrowly overlaps with 0. However, at three correct MVCs (approximately 37 percent of the sample), this estimated treatment effect increases in size by more than sevenfold to 0.58.Footnote 8
Because this latter set of analyses involved an MVC scale rather than a single binary measure (which researchers could simply use to subset their data), these results exemplify how MVCs can be easily incorporated into analyses: researchers can specify an interaction between the treatment variable and the MVC performance scale. In essence, this enables the researcher to investigate the degree to which the estimated treatment effect increases in magnitude across MVC performance, while still avoiding post-treatment bias. Finding that the estimated treatment effect increases in magnitude at higher levels of MVC performance, for example, would indicate that inattentiveness in the sample partially undermined one's hypothesis test, and thus serve as more robust test of one's hypothesis. In addition, this approach is potentially valuable as a diagnostic tool for researchers who obtain null results for a given experiment: if no such change in treatment effect magnitude is observed across MVC performance, this would suggest an ineffective manipulation, or an incorrect underlying theory, rather than a problem arising from sample inattentiveness.
We now turn to the Lucid 1 study, in which each respondent participated in two rounds. In each round, respondents were randomly assigned to one of the four MVs and randomly assigned to one of the four experiments (each with a randomly assigned control and treatment condition). First, we present results from a “grand model” that estimates CATEs using data from the full set of experiments and MVs to gauge the average performance of the MV technique. We next subset the data by MV, and show how CATEs vary as a function of MVC performance. Using additional models, we also probe whether our MVs are relatively interchangeable or, conversely, particular MVs outperform others.
Table 4 displays the results from a linear model with standard errors clustered by respondent.Footnote 9 The model takes the following form:

where i indexes individuals, r indexes rounds, Y represents the outcome measured in terms of control group standard deviations within each experiment, T is an indicator of treatment status, and MVC represents the respondent's score on the MVC scale (i.e., the number of correct MVCs).Footnote 10
Table 4. Conditional effect of treatment on outcome across MVC passage rates
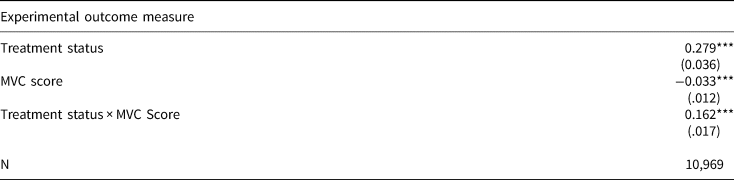
Notes: Lucid study. OLS regression coefficients with standard errors clustered by respondent. Outcome is standardized within each experiment (control group standard deviations). MVC score ranges from 0 to 3. ***p < 0.001 (one-tailed hypothesis tests).
As shown in Table 4, the interaction between treatment status and MVC performance is statistically significant (p < 0.001). At zero correct MVCs (approximately 22 percent of the sample), the CATE is 28 percent of a standard deviation. This corresponds to approximately a 0.50 scale point shift on a 7-point Likert scale.Footnote 11 However, at three correct MVCs (41 percent of the sample), the CATE is approximately 2.7 times larger, reflecting a 76 percent standard-deviation (or 1.50 scale point) shift in the outcome variable.
To provide a visual sense of how CATEs vary as a function of MVC performance within each MV–experiment pair, we present CATE estimates for each MV and experiment in Figure 3. This figure reveals that MVC performance is positively associated with CATEs in 15 out of the 16 MV–experiment combinations.Footnote 12 The relationship between MVC performance and CATEs is strongest in the Welfare experiment. The latter's ITT is a 1.17 standard-deviation shift in the outcome variable (approximately 2 scale points), whereas ITT estimates for the other experiments range from 0.34 to 0.41 standard deviations (70–80 percent of a scale point on a 7-point Likert scale). Moreover, CATEs among those who perform worst on the MVC are not statistically discernible from zero in all but 3 out of 16 cases, whereas they are statistically significant in every case among those who answered all MVCs correctly. Figure 3 also suggests that the relationship between MVC performance and CATEs is relatively similar regardless of the particular MV that is used.Footnote 13
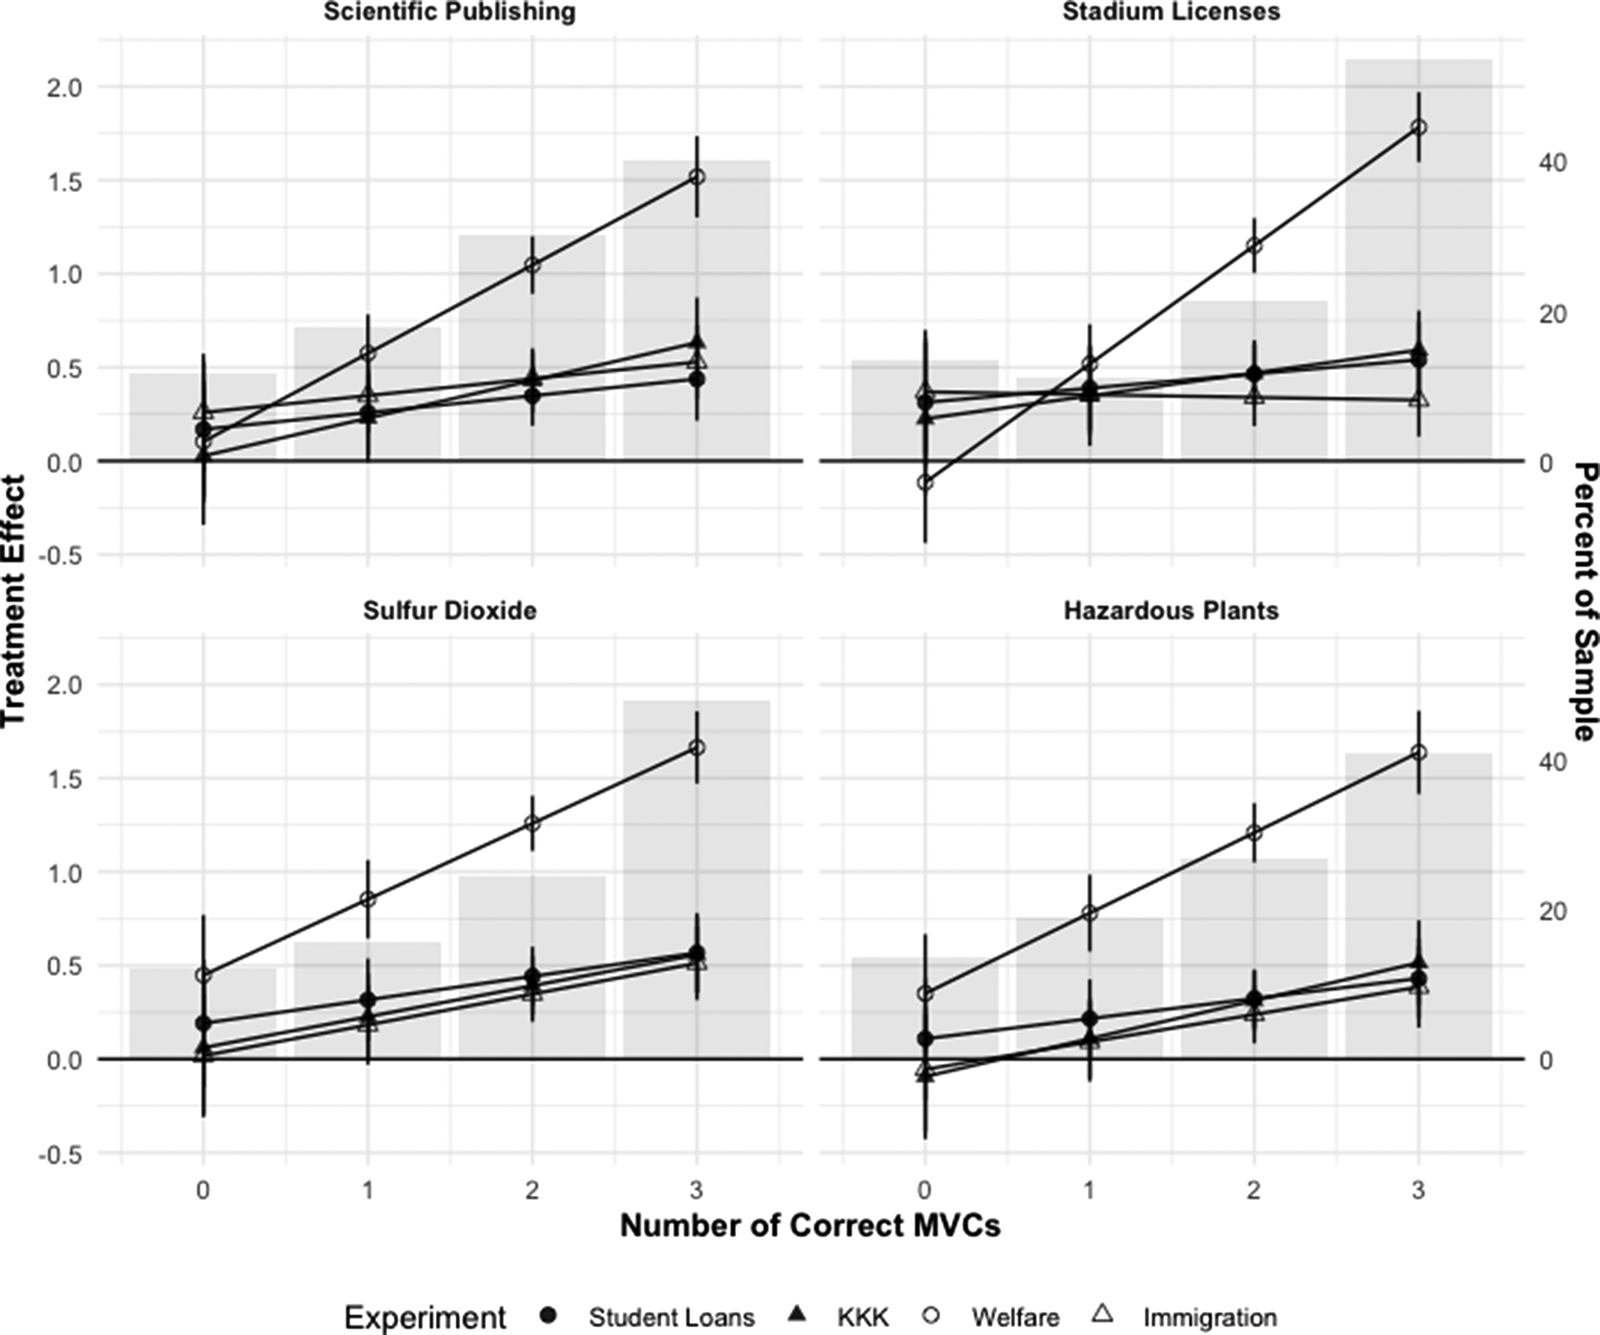
Figure 3. CATE estimates across experiments (by MV featured).
Notes: CATEs across the number of correct MVCs for each MV–experiment pair. Points represent CATE estimates (95 percent CIs shown). Histogram represents the percent of the sample correctly answering × MVCs.
4.2 Validating MVC scores with other measures of attentiveness
An implication of the aforementioned findings is that MVC performance should be associated with better performance on other measures of attentiveness to the survey experiment. We first note, however, that performance on a given MVC generally had substantial and statistically significant pairwise correlations with performance on other MVCs. For example, the Lucid 1 study MVCs had pairwise correlations ranging from 0.55 to 0.63 (p < 0.001), and Cronbach's alpha (α) values ranging from 0.60 to 0.74.Footnote 14 Further, in the Lucid 1 study, the grand pairwise correlation between round 1 and round 2 MVC performance (i.e., between the two MVC scales) was quite strong at 0.60 (p < 0.001).Footnote 15
We also investigate correlations with question timers, for which less time spent on an item is indicative of less attentiveness to its contents (Niessen et al., Reference Niessen, Susan, Rob and Tendeiro2016; Wood et al., Reference Wood, Harms, Lowman and DeSimone2017). We implemented question timers on each MV, as well as on every screen of the experiment: the randomly assigned vignette, the outcome measure, and the FMC. Consistent with previous research (e.g., Wood et al., Reference Wood, Harms, Lowman and DeSimone2017), we log-transform each timer, and subsequently regress it onto MVC performance, yielding an estimate of the percent change in time spent on a given item per one-unit increase in MVC performance.
Due to space limitations, we present the full results of our analyses in the SI (Section E). To summarize results for the MTurk, Qualtrics, and NORC studies, better performance on the MVC consistently predicts greater latency (i.e., more time spent) on (1) the MV itself, (2) the experimental vignettes, and (3) the experiment's outcome measure. These differences were positive in sign and statistically significant at p < 0.05 or below in all but once instance.Footnote 16 For example, in the KKK experiment (Qualtrics study), passing (versus failing) the MVC predicts 132 percent more time spent reading the “free speech” vignette. (In terms of raw times, MVC non-passers spent an average of 28 seconds while passers spent an average of 68 seconds.) In every Lucid 1 experiment, better MVC performance predicts significantly greater latencies. Thus, in 39 out of 40 separate tests, we find that better MVC performance is associated with significantly more attentiveness to experimental content. Further, in every case, those who passed the MVC spent significantly more time on the survey itself.Footnote 17
Lastly, we analyze responses to FMCs, which also aim to measure attentiveness to the actual experiment's vignettes. We find a remarkably strong relationship between MVC performance and FMC passage: MVC performance predicts anywhere between a 35 (Qualtrics and NORC) and 49 (MTurk 1) percentage-point increase in likelihood of correctly answering the experimental FMC. In the Lucid 1 study, these effects were even stronger, ranging from 41 to 68 percentage points (see SI (Section E) for details). Thus, in eight out of eight separate tests, we find that better MVC performance predicts a significantly greater likelihood of correctly answering a factual question about the contents of the experiment. This serves as further evidence that MVCs can, as intended, function as a pre-treatment, proxy measure of the extent to which respondents are attentive to one's experiment.
4.3 Does using MVs significantly alter treatment effects?
The previous sections offer consistent support for using MVCs as a means of measuring respondent attentiveness and for examining treatment effects among those likely to have been attentive to one's experiment. However, a natural question is whether the act of featuring an MV, in and of itself, yields an ITT estimate for the experiment that is substantially different from what would have been observed had no MV been featured. For example, the MV might prime various considerations that would not have otherwise been primed, potentially rendering respondents more, or perhaps less, receptive to the treatment (on average). Alternatively, as the MV supplies an additional quantity of information, and MVCs constitute additional demands upon respondents' cognitive stamina, perhaps featuring an MV results in greater respondent fatigue and, consequently, weaker treatment effects.
To investigate these potential concerns, we designed the Qualtrics, NORC, and Lucid 1 studies such that a random subset of respondents was selected to not receive any MV prior to the experiment. This enables us to directly investigate whether the experimental treatment effects are substantially different for those who did, versus did not, view an MV (and answer MVCs) prior to the experiment (i.e., a replication of the original study without an MV, nor the MVCs, for comparison purposes). Across these studies, treatment effects were substantively and statistically similar regardless of whether an MV was featured. We also find no significant differences in the variance of the outcome measures depending upon whether an MV was or was not viewed, suggesting that MVs also do not induce heterogeneity in responses to the outcome measure. Due to limited space, we feature the full results of these analyses in the SI (Section G).
4.4 Demographic patterns in MVC performance
A common issue with analyzing attentive respondents is that the subset of attentive respondents may differ from one's entire sample on a variety of demographic and politically relevant variables (e.g., Thomas and Clifford, Reference Thomas and Clifford2017). Indeed, such differences would be expected insofar as attentiveness is not randomly distributed in the population. In each of our studies, we thus ran a single-regression model wherein we regressed MVC performance onto the following variables (all measured pre-treatment): gender, race, age, income, education, political interest, party identification, and ideological self-placement.
Due to space constraints, the full set of results can be found in the SI (Section D). Overall, the only variables showing a consistently sizable and significant (p < 0.10) relationship with MVC performance across the five studies were (1) race, and (2) age. Specifically, non-White respondents tended to have lower MVC performance relative to Whites (generally on the order of 10–20 percentage points) and older respondents tended to perform substantially better than younger respondents (e.g., in the Qualtrics study, which displayed the strongest relationship between age and MVC performance, moving from the 25th to 75th percentile in age predicted an 18 percentage-point improvement in MVC performance), though no significant effect was found for age in the NORC study. These patterns are consistent with prior studies wherein researchers analyzed an attentive subset of their sample (see Thomas and Clifford, Reference Thomas and Clifford2017: 192). Overall, however, correlations between these demographic variables and MVC performance were substantively modest in size. Age, for example, correlates with performance at 0.33 or less across all of our studies. In the NORC study, which saw the largest effects for race (i.e., African-American or Hispanic identification) on MVC performance, the pairwise correlations were ≤|0.15|. Further, when analyzing MVC passers versus the sample as a whole (in the studies with only one MVC (MTurk 1 and Qualtrics)), the sample composition does not substantially change. The average age among MVC passers in the Qualtrics study, for example, is 49, while it is 46 for the sample as a whole.
Importantly, we do not find any consistent effects for education, nor do we find consistent effects for any political variables (e.g., political interest). This latter finding helps assuage the potential concern that, for example, only highly educated and/or politically interested respondents will be able to correctly answer MVCs.
Nevertheless, as prior studies duly note (e.g., Thomas and Clifford, Reference Thomas and Clifford2017), we caution that analyzing the attentive may alter the demographic composition of the sample. This may be important when researchers desire descriptive results that can apply to the broader population, and/or when such demographic variables significantly moderate a particular experiment's effect. Researchers can increase transparency by, for example, noting correlations between demographic predictors and MVC passage, and/or (if subsetting on MVC performance) noting changes in the demographic composition of the sub-sample relative to the initial (full sample) analysis.Footnote 18
Lastly, it is worth emphasizing that, with a pre-treatment measure of attentiveness, any relationship between demographic variables and attentiveness is a concern not about statistical bias but, rather, sample representativeness and the generalizability of one's findings. In other words, even if the attentive sub-sample differs demographically from the full sample, this potentially poses constraints on the external validity of the results, rather than threatening the survey experiment's internal validity. Moreover, existing research finds remarkably homogeneous treatment effects across samples with substantially different demographic compositions (e.g., Mullinix et al., Reference Mullinix, Leeper, Druckman and Freese2015; Coppock et al., Reference Coppock, Leeper and Mullinix2018). In sum, while the external validity of one's findings remains an important consideration, neglecting to account for inattentiveness whatsoever risks obtaining treatment effect estimates that are downwardly biased, potentially yielding null findings and undermining one's study.
4.5 Detecting significant effects among attentive sub-samples
Analyzing a subset of one's sample raises practical questions concerning statistical power and, specifically, whether one can still detect statistically significant treatment effects when analyzing the attentive sub-group. We investigate these concerns in each of our studies. To summarize the results, because we consistently find a larger treatment effect among the more attentive, we find that this helps to offset the loss of power that arises from subsetting the sample on MVC performance. In fact, in some cases we obtain a larger t-statistic on the treatment effect among the attentive sub-sample. Yet even in the cases where the treatment effect t-statistics decrease in magnitude, our results consistently show that the researcher can nevertheless uncover a statistically significant treatment effect (i.e., p < 0.05) even among the most attentive sub-sample of respondents (see SI (Section H) for details).
4.6 Comparison with instructional manipulation checks
While we emphasize that MVCs can be used in conjunction with other kinds of attentiveness measures, we fielded a separate study via Lucid in 2021 (total n = 9000; “Lucid 2”) to investigate how MVCs performed relative to an existing method for assessing inattentiveness in survey experiments—that is, IMCs, or “screeners” (Berinsky et al., Reference Berinsky, Margolis and Sances2014). We document the details of this investigation in the SI (Section I). Overall we find that MVCs slightly outperform IMCs on several dimensions. In particular, the MVC scale tended to yield slightly larger CATEs than the IMC scale, which is consistent with our argument that MVCs, by design, should be stronger predictors of attentiveness to the vignette in one's experiment. Echoing this latter point, we also find that MVC performance predicts significantly longer time spent on experimental stimuli and outcome measures relative to IMC performance (though their respective effects on total survey duration were nearly identical), as well as significantly better performance answering post-outcome FMCs (approximately 8 percentage points, p < 0.05). Lastly, with the exception of age (which, though significantly associated with both MVC and IMC performance, is more strongly associated with the former), demographic and political variables operate remarkably similarly in predicting MVC versus IMC performance.Footnote 19
5. Discussion and conclusion
The growth of experimental social science has exploded in recent years due to technological advances that allow survey experiments to be programmed and fielded online with relative ease (e.g., Druckman, Reference Druckman2021). Yet, a persistent challenge arising from this method is respondent inattentiveness, which stands to bias treatment effects downward. In this paper, we proposed MVs as a technique that enables scholars to assess treatment effects across varying levels of attentiveness without inducing post-treatment bias.
Taken together, we believe our findings indicate that survey researchers can benefit substantially from featuring MVs and MVCs in their studies, and with few downsides beyond the need to include additional items in their surveys.Footnote 20 In fact, we found the inclusion of MVs to be beneficial despite using survey firms that feature pre-screened opt-in samples and/or flag and remove inattentive respondents before data collection concludes.Footnote 21
In our SI, we provide text and performance analytics for all of MVs and MVCs used in this study. If scholars wish to use these items, or construct their own, we emphasize the following suggestions based upon our studies' designs (see also Table A7 in the SI). First, MVs ought to present subjects with a vignette that is broadly similar in nature to the kind of content featured in the experiment itself, but that is unlikely to have an effect on the outcome. The latter point is important, given the possibility of spillover effects in survey experiments (Transue et al., Reference Transue, Lee and Aldrich2009). Second, we recommend that scholars present MVCs as forced response questions to avoid missing data, and with the “back button” disabled to prevent the possibility of looking up answers to the MVC. Third, as with all measures of attentiveness, we expect that MVCs will inevitably contain some degree of measurement error. Thus, multiple-item scales (as featured in most of our studies) are advisable where possible. Fourth, block-randomizing based upon responses to at least one MVC would help ensure that attentiveness is balanced across experimental conditions (e.g., Gerber and Green (Reference Gerber and Green2012) find modest benefits of this practice in small samples).Footnote 22 Finally, we urge researchers to be fully transparent by presenting the ITT for the sample as a whole before presenting re-estimated treatment effects on those deemed to be attentive and/or presenting whether (and to what degree) the estimated treatment effect increases in magnitude at higher levels of attentiveness.
Insofar as it gauges pre-treatment attentiveness to vignette-based content, our findings indicate the MV approach comes with potential advantages over alternative approaches, though we emphasize that these various techniques need not be treated as mutually exclusive. For instance, MVCs could be used in conjunction with timers, IMCs, and related techniques to assess general attentiveness (e.g., Oppenheimer et al., Reference Oppenheimer, Meyvis and Davidenko2009; Vraga et al., Reference Vraga, Bode and Troller-Renfree2016). If the various measures scale together sufficiently well, they could be combined into a single continuous measure of attentiveness; otherwise, researchers may separately report CATE estimates, for example, using each measure of attentiveness that was employed.
In addition, although we identify several distinct advantages of the MV approach, its use does not obviate the need for other tools that gauge attentiveness to experimental content, such as manipulation checks. Treatment-relevant factual manipulation checks, for example, provide crucial information about the degree to which experimental manipulations were actually perceived, while more conventional manipulation checks (i.e., subjective manipulation checks) help researchers determine whether the experimental manipulation is affecting the theorized independent variable of interest. By including such items, the researcher is far better able to gauge the extent to which either respondent inattentiveness to experimental content and/or an ineffective manipulation, respectively, are influencing the results of the experiment.
Moving forward, we note that, as MVs are text-based vignettes, it remains unclear to what extent the MV approach will be effective for survey experiments that involve non-textual visual and/or auditory stimuli (e.g., photos, videos, or sound recordings). We believe this also presents a useful avenue to explore in future research.
In sum, the MV technique offers researchers a simple and effective way of distinguishing those who likely did not attend to their survey experiments, for one reason or another, from those who did. In so doing, MVCs enable researchers to conduct hypothesis tests that are more robust to respondent inattentiveness and also avoid post-treatment bias. We believe this technique will therefore equip researchers with an ability to understand their results at a deeper level than what the simple ITT estimate permits, and thus allow them to learn more from their experimental studies.
Supplementary material
The supplementary material for this article can be found at https://doi.org/10.1017/psrm.2023.3. To obtain replication material for this article, please visit https://preprints.apsanet.org/engage/apsa/article-details/635017e64a1876d425ea8658


