


There’s something in the very small minutia of life that tells us something about the big, big picture that we see every day all over the place, and so I think the more specific and creative and revelatory you are in the micro, the more powerful the macro will be.
Big qualitative datasets, whether naturally occurring or created, have a depth and breadth that are rarely fully exploited. Too often, qualitative research focuses only on a small subset, while quantitative research focuses only on abstract measures. But big qualitative datasets can offer much more: They provide an opportunity to deeply integrate qualitative and quantitative methods to analyze the same data.
In this chapter, we develop the pragmatist proposition to recursively restructure big qualitative data to enable both qualitative and quantitative analyses. Big qualitative data can be transformed into excerpts, categories, and numbers, and we advocate recursively restructuring the raw data to avail of each. Specifically, we introduce “multi-resolution research” to conceptualize a mixed methods analysis that preserves the links between the macro (quantitative) and the micro (qualitative). Multi-resolution research is recursive; it uses qualitative analysis to “zoom in” revealing contextualized particulars and quantitative analysis to “zoom out” revealing statistical patterns.
Multi-resolution research is a mixed methods recursive transformation design. As with transformation designs, there is a focus on converting qualities into quantities, but this process is reversible throughout the analysis. As with recursive designs, the analysis moves back and forth between qualitative and quantitative analyses, but unusually for recursive designs, the qualitative and quantitative methods analyze the same data.
This chapter begins with a review of the growing number of empirical studies that use qualitative and quantitative methods to analyze the same data, arguing that this emerging method is inadequately theorized. Second, we use the mixed methods literature to conceptualize multi-resolution research in terms of qualitizing and quantitizing within the analysis phase of research. Third, we theorize the gains and losses of imposing different types of structure on raw data and argue that moving between data types can accrue gains and ameliorate losses. Finally, we introduce two research studies to illustrate how multi-resolution research can support abductive inference (i.e., theory creation) and increase research legitimacy. The pragmatist insight guiding multi-resolution research is that all human research and conceptualizing is anchored in concrete instances of human practice. In multi-resolution research, both the qualitative and quantitative analyses are anchored in the same raw data, the records of human practice.
7.1 Mixed Analyses of Big Qualitative Data
Many classic experiments in social psychology combined analyzing the data quantitatively to test outcomes and qualitatively to examine processes (Moscovici, Reference Moscovici1991). Consider Darley and Latané’s (Reference Darley and Latané1968) study of bystanders in which participants believed they were witnessing someone having a seizure. In addition to the experimental results, showing that four participants were less likely to intervene than two, they also reported the words of participants in the experiment (e.g., “It’s just my kind of luck, something has to happen to me!” and “Oh God, what should I do?”). These quotes provide insight into the experiment and increase the legitimacy of the research. This mixing of experimentation with qualitative observation is also evident in Milgram’s (Reference Milgram1969) research on obedience, Asch’s (Reference Asch and Guetzkow1951) research on conformity, and the Stanford Prison Experiment (Haney et al., Reference Haney, Banks and Zimbardo1973). However, the qualitative element that characterized experiments during social psychology’s “golden age” has largely disappeared. Experiments conducted online (using vignettes, primes, surveys, and reaction times) do not afford the same rich analysis. Accordingly, this approach to mixing methods within experimental research is now rarely mentioned in guides for experimental research (Stainton Rogers, Reference Stainton Rogers2011).
Beyond social psychology experiments, however, combining qualitative and quantitative methods to analyze the same data is increasing (Onwuegbuzie & Johnson, Reference Onwuegbuzie and Johnson2021). In addition to the long history of mixed analyses of interview and focus group data (Fakis et al., Reference Fakis, Hilliam, Stoneley and Townend2014; Vogl, Reference Vogl2019), it has recently burgeoned in big data studies of social media (Andreotta et al., Reference Andreotta, Nugroho and Hurlstone2019; Hamad et al., Reference Hamad, Savundranayagam, Holmes, Kinsella and Johnson2016; Rodriguez & Storer, Reference Rodriguez and Storer2020).
Mixing qualitative and quantitative analyses in big data research is inevitable because the bulk of big data is qualitative data (Salganik, Reference Salganik2019). Indeed, qualitative interpretation is routinely used in conjunction with computational techniques (Chen et al., Reference Chen, Drouhard, Kocielnik, Suh and Aragon2018) – for example, to identify features to measure and model; create human-labeled data used for training and evaluating algorithms; interpret clustered output from unsupervised techniques; and create textual measures – as researchers recursively examine words in context alongside the overall properties of the measure (Boyd & Schwartz, Reference Boyd and Schwartz2021).
Qualitative and computational analyses have complementary strengths. Computational analysis is more efficient, reliable, and scalable, while manual analysis is more subtle, contextual, and evaluative (Chang et al., Reference Chang, DeJonckheere and Vydiswaran2021; Ho et al., Reference Ho, Chen and Shao2021; Lee et al., Reference Lee, Dabirian, McCarthy and Kietzmann2020). Automated techniques rely on lexical features within the data being analyzed, while manual analysis can interpret broader contextual cues beyond the text being analyzed (e.g., common sense; Rodriguez & Storer, Reference Rodriguez and Storer2020). Simply put, manual qualitative analysis is a high-value limited resource that should be targeted at subtle, contextual, or ill-defined phenomena.
Several step-by-step models have been proposed to support integrating computational methods with human interpretation (Andreotta et al., Reference Andreotta, Nugroho and Hurlstone2019; Chang et al., Reference Chang, DeJonckheere and Vydiswaran2021; Shahin, Reference Shahin2016). These are generally two-step models that start with computation (e.g., natural language processing of a corpus of text) and end with an in-depth qualitative interpretation of excerpts. However, despite being useful, these step-by-step models continue to conceptualize quantitative and qualitative methods as separate (as indicated by occupying different steps in the process). This overlooks the opportunity for a more thorough integration of qualitative and quantitative methods afforded by big qualitative data (Guetterman et al., Reference Guetterman, Fetters and Creswell2015; O’Halloran et al., Reference O’Halloran, Pal and Jin2021). Outstanding questions include: How can the same raw data be structured to enable both qualitative and quantitative analyses? What are the benefits and trade-offs of each type of data structure? And if the same data can be structured for both qualitative and quantitative analyses, what are the synergies of doing both?
7.2 Conceptualizing Multi-resolution Research
Multi-resolution research entails recursive data transformation (i.e., quantitizing and qualitizing) occurring during the analysis phase of research. This is unusual because, typically, integration occurs after the data analysis, when interpretations are built that integrate the separate qualitative and quantitative analyses (Fetters & Freshwater, Reference Fetters and Freshwater2015b). In contrast, multi-resolution research entails integrating methods when analyzing the same data.
Data restructuring entails transforming data from one type into another (Love & Corr, Reference Love and Corr2022; Vogl, Reference Vogl2019). There are two types of transformation (also called “conversion”): quantitizing and qualitizing (Teddlie & Tashakkori, Reference Teddlie and Tashakkori2009). Quantitizing entails converting qualities into quantities (Sandelowski et al., Reference Sandelowski, Voils and Knafl2009). It is widespread: In observational studies, instances are counted; in field experiments, qualitative changes are categorized and scored; and in survey research, respondents have to convert feelings or experiences into ratings (Wagoner & Valsiner, Reference Wagoner, Valsiner, Gulerce, Hofmeister, Staeuble, Saunders and Kaye2005). Qualitizing entails converting quantities into qualities and has received much less attention (Nzabonimpa, Reference Nzabonimpa2018). Examples of qualitizing include creating a narrative summary of quantitative findings, characterizing scores within a range as being of a certain type, and reverting a number to its raw qualitative form to assess the validity (Creamer, Reference Creamer2017; van Velzen, Reference van Velzen2018; Vogl, Reference Vogl2019). While quantitizing and qualitizing are opposites, they are combined within multi-resolution research. Quantitizing and qualitizing are commonly conceptualized as unidirectional, but in multi-resolution research they are put in a loop, such that there is a back-and-forth transformation between quantitizing (zooming out) and qualitizing (zooming in).
Multi-resolution research instantiates the pragmatist idea of anchoring all data and analysis in what is actually going on (i.e., the raw data). Population data and individual cases do not exist on different ontological planes; they are the same, except they are viewed at different scales (i.e., a single case up close or many cases at a distance). In this sense, multi-resolution research aims to cut across assumptions that disconnect the micro and the macro; it aims to see the micro in the macro and the macro in the micro.
Although multi-resolution research entails a recursive research design, it is atypical. Most recursive research designs entail moving between separate qualitative and quantitative datasets (e.g., Christ, Reference Christ2007; Kerrigan, Reference Kerrigan2014; Nzabonimpa, Reference Nzabonimpa2018). A defining feature of multi-resolution research is that both qualitative and quantitative analyses are performed on the same dataset. This opens up a new type of synergy, because each datum (quantitative or qualitative) can be recontextualized into either its qualitative or quantitative form. Thus, the analysis moves recursively between assigning numbers to meanings and reverting the numbers to the underlying meanings.
Multi-resolution research recursively restructures data to gain the benefits of both exploratory and sequential designs (Creswell & Creswell, Reference Creswell and Creswell2018). Exploratory sequence designs start with a qualitative analysis and then use the findings to guide the quantitative analysis; the qualitative method explores the phenomenon, and the quantitative measures or tests it. Explanatory sequence designs start with a quantitative analysis and then use the findings to guide the qualitative analysis; the qualitative analysis generates explanations for the quantitative findings. In multi-resolution research, both sequences occur: The quantitative analysis is grounded in qualitative details, and the qualitative analysis is situated within the larger quantitative patterns (e.g., frequencies, changes, associations). By recursively switching back and forth between qualitative and quantitative analyses, both exploratory and explanatory sequences are unlocked, enabling rapid iteration and development.
A benefit of multi-resolution research is that it integrates qualitative and quantitative methods at the level of data. Being anchored in the same data means that movement between analyses is frictionless (i.e., all qualitative data can be restructured as quantitative data and vice versa). Thus any discrepancies or tensions between the analyses will be more likely to be genuine – because they cannot be byproducts of data being collected at different times, in different contexts, or with different people (which might occur when mixing methods based on different datasets). Moreover, this frictionless movement between quantitizing and qualitizing enables recursive back and forth (in contrast to two-step qualitative–quantitative sequences), which, in turn, can enhance the creativity and legitimacy of the research.
7.3 Quantitizing and Qualitizing
All data in social science begin as traces of human activity (e.g., a measurement, observation, recording, document, artifact, or digital trace). This raw data can be structured (survey responses, experimental outcomes) or unstructured (recordings, transcripts, photographs). In either case, they usually require some structuring to become suitable for analysis (see Chapter 5). Multi-resolution research requires raw data that can be transformed into both qualitative and quantitative forms. We propose that this unstructured raw data can take three broad forms: excerpts, categories, and measures. We argue that these data types are not opposed or incompatible; instead, they can be based on the same underlying raw data.
Qualitative and quantitative data are often juxtaposed as fundamentally different types (e.g., Creswell & Creswell, Reference Creswell and Creswell2018; Morgan, Reference Morgan2007) or even incommensurable (Guba & Lincoln, Reference Guba and Lincoln1994). Qualitative data, it is argued, pertain to qualia, experiences, and meanings, while quantitative data pertain to quanta, frequencies, and statistical associations (Shweder, Reference Shweder, Jessor, Colby and Shweder1996). Although there is a difference between the quality of a red flower and a numeric representation of the flower (e.g., a beauty rating or its numeric values used by a computer), there is also a connection (which can be more or less valid). Indeed, oversharp distinctions between qualitative and quantitative data have been widely criticized (Bazeley, Reference Bazeley2017; Coxon, Reference Coxon2005; Creamer, Reference Creamer2017). The main issue is that the distinction often does not hold in practice.
In qualitative research, there is often an element of quantification in frequency claims. Phrases such as “most interviewees,” “some interviewees,” “few interviewees,” and “no interviewees” are widespread (Hammersley, Reference Hammersley and Richardson1996; Morgan, Reference Morgan2018). Such opaque phrasing does not undermine qualitative research or show that it is a poor attempt at quantification. Instead, quantitative claims often provide valuable background for interpreting qualitative data. Another more fundamental blurring within qualitative research is that most recent qualitative data are digital data (i.e., 0s and 1s combined to produce images and text). Thus, the image viewed on the computer screen is a numeric representation. This digitization of qualitative data enables researchers to search, sort, and filter qualitative data with increasing precision. It will also, we suspect, increasingly blur the lines between research based on qualitative interpretation and quantitative algorithms.
In quantitative research, qualitative elements are also widespread. Quantitative research often begins by converting qualitative phenomena (e.g., events, behaviors, feelings) into numbers (Berka, Reference Berka1983; Trochim & Donnelly, Reference Trochim and Donnelly2021). Survey respondents quantify vague and ambiguous feelings using verbal anchors such as “sometimes” and “rarely” (French et al., Reference French, Cooke, McLean, Williams and Sutton2007; Wagoner & Valsiner, Reference Wagoner, Valsiner, Gulerce, Hofmeister, Staeuble, Saunders and Kaye2005). Validation of quantitative measures also often relies upon qualitative judgment. For example, survey measures and textual measures are often generated and evaluated through qualitative assessment (e.g., expert raters, concept sorting, face validity checks, exit interviews; Gobo et al., Reference Gobo, Fielding, La Rocca and van der Vaart2022). Even in big data analysis, there is often a qualitative element, such as when supervised learning uses human-coded data as a gold standard or in interpreting the output from unsupervised algorithms (Kowsari et al., Reference Kowsari, Jafari Meimandi and Heidarysafa2019).
The practical challenge of distinguishing qualitative and quantitative methods has prompted calls to abandon this oversharp and unhelpful dichotomy (Knappertsbusch, Reference Knappertsbusch2020). However, this would be rash (Morgan, Reference Morgan2018). Instead, we build upon the idea of data as a process (Chapter 5) in order to reconceptualize the distinction. Qualitative and quantitative data are not ontologically different types of data; they are not opposed or incommensurable. Instead, they are two different transformations of the same raw data and, thus, two ways of looking at the data.
We propose that all quantitative data are theoretically (even if rarely practically) revertible to a qualitative form. Equally, we propose that all qualitative data are theoretically (even if not sensibly) convertible into a numeric form. To say that this bidirectional transformation is always possible is not to say that it should always be done. Some data are not suited for quantification and vice versa. Our argument is only that when suitable, zooming in and zooming out on the same data (i.e., bidirectional quantitizing and qualitizing) can add transparency, rigor, and validity to research, enhancing the opportunities for surprise and thus potentially spurring scientific progress.
Researchers increasingly need to choose how to structure their data (Chapter 5). Traditional methods (e.g., interviews, surveys) produced data with a structure that afforded specific analyses (e.g., thematic analysis, correlations). Thus, traditionally, choosing a method of data collection was implicitly also choosing a method of analysis. However, naturally occurring data afford multiple analyses. Big qualitative data can be used for both qualitative and quantitative analyses. Thus, these new sources of data force researchers to question what structure should be imposed on the data. And, if multiple structures are possible, then why not recursively restructure the data so as to avail of the full depth and breadth of the data?
Table 7.1 conceptualizes how human events are transformed into three broad data types: excerpts (e.g., quotes, images), categories (e.g., counts of excerpts), and measures (e.g., survey scales, textual measures). Each type of data has trade-offs. The framework specifies the added value provided by each data type and thus facilitates conceptualizing how using multiple data types can offset losses and accrue gains.
Table 7.1 Transformations of records of human activity
| Events Activity that is either naturally occurring (talking, photographing, posting on social media, purchasing) or research-induced (interview, survey, experiment) | |||
|---|---|---|---|
| Raw data Traces of events that are potentially analyzable and can be unstructured (documents, photographs, interview transcripts, social media posts) or prestructured (survey responses, experimental outcomes) | |||
| Data type | Excerpts | Categorizations | Measures |
| Transformation | Selection | Categorizing | Scaling |
| Definition | Excerpts are selections of records that illustrate a concept (e.g., qualitative coding). | Categorizations impose clearly defined inclusion and exclusion criteria to yield in/out category membership. | Measures convert records into ordinal (e.g., ranking from most to least), interval (e.g., 5-point scale), or ratio (e.g., amount) variables. |
| Example | A quote from a social media post | Social media posts categorized by topic | The sentiment of social media posts |
| Gains | Particular (excerpts are a subset of the original records) and contextual (excerpts can be viewed in the context of the original record) | Enables statements of equality (= and ≠), and thus counts and modes that can reveal differences between groups and changes over time | Enables mathematical operations (< and > for ordinal; + and – for interval; and * and / for ratio) and thus statistical modeling and generalization |
| Losses | Selective and put the broader data in the background (e.g., unclear sampling, risk of cherry-picking) | Loses some particularity and context, homogenizes differences within the category, and accentuates differences between categories | Generic (scores risk being disconnected from records) and decontextualized (difficult to retrieve the context for the score) |
| Illustrative analyses | Qualitative analysis, either bottom-up (e.g., grounded theory) or top-down using theoretical concepts | Counts, frequencies, mode, crosstabulations, and chi-square | Quantitative analysis, exploratory data analysis, confirmatory hypothesis testing, and statistical modeling |
| Multi-resolution research | |||
Events refer to what actually happened: either naturally occurring events (e.g., people talking, posting, behaving) or induced by the research (e.g., talking in an interview, selecting options in a survey). Each event “has an infinity of aspects or properties” (James, Reference James1890, p. 332) and could be the basis for an infinity of analyses (e.g., a single utterance can be analyzed for content, context, pitch, pragmatics, motivation, cognition, addressivity, originality). These “predata” events are maximally rich, contextual, and particular; they are the world-as-it-is before being sampled, recorded, or curated. Indeed, events cannot be analyzed directly. Any analysis requires converting these events into raw data (e.g., a transcript of the talk, a record of what was done). Any conversion of events into raw data necessarily entails a loss of resolution and a “conquest of abundance” (Feyerabend, Reference Feyerabend2001). Like Procrustes – who made every passerby fit his bed, either by stretching or amputating them – data collection forces the richness of lived life into a template (e.g., a transcript, record, digital trace, or document).
Raw data are the traces or records of human activity collected for research. Traditionally they have been prestructured during the data collection process as either qualitative (e.g., interviews, focus groups) or quantitative (e.g., Likert ratings, experimental outcomes) and thus affording only one type of analysis. However, naturally occurring data (i.e., the records and digital traces that are a byproduct of human activity) do not have any predefined structure. Naturally occurring data have high validity (it is part of what happens in society), but because it was not collected for research, it can be messy (unclear sampling, missing entries, and ambiguous). Accordingly, naturally occurring raw data require significant processing to become suitable for research. Consider a social media post, where the event is the person writing the post and the raw datum is the digital trace of the post: An excerpt could be selected and analyzed qualitatively for subtle signs of emotion, it could be reduced to one of five categories of emotion, or it could be measured using a sentiment algorithm. Each analysis entails a transformation and thus has both gains and losses. We propose that choosing between them is a self-imposed constraint; recursively restructuring the data enables all analyses and thus unlocks the full potential of the data.
Excerpts refer to a selection of raw qualitative data that forms the basis for an in-depth interpretative analysis (e.g., an image, a quote, a video segment). Excerpts are created when the researcher selects portions of raw data that best demonstrate a central theme or theoretical idea. Examples include identifying third-turn repairs in conversation (Schegloff, Reference Schegloff1992), analyzing multivoicedness in texts (Aveling et al., Reference Aveling, Gillespie and Cornish2015), and examining creativity in social interaction (Hawlina et al., Reference Hawlina, Gillespie and Zittoun2019). Selecting excerpts entails a loss of data; not all the raw data can be selected, decisions need to be made about what is included and excluded, and another researcher might make different selections. Moreover, some concepts are inherently ambiguous, contextual, or multidimensional, what Cartwright and Bradburn (Reference Cartwright and Bradburn2011) term ballung concepts (the German word for cluster or congestion). For example, concepts such as “culture,” “power,” or “practices” are useful but also challenging to definitively and exhaustively identify in excerpts of raw data. Thus, despite being useful, it can be hard to justify why one excerpt was selected from the larger dataset (Gillespie & Cornish, Reference Gillespie and Cornish2014; Morse, Reference Morse2010).
Categorizations entail rigorous operationalization with precise definitions and distinct inclusion and exclusion criteria. It is a more formal and conclusive process than selecting excerpts. All categorization is based on a judgment of equivalence (= and ≠). Everything within a category is equal, and everything outside the category is different. Examples of categorization include the topic of a news article, incidents in a complaint, people in a picture, and whether a product review is positive or negative. It is impossible to rank or order categorizations (e.g., topics, incidents, and people cannot be scaled without additional data). However, it is possible to count occurrences of a category. For example, one can count how many social media posts are related to topic X? How frequently does a speaker switch topics? Are the number of mentions of X increasing? One drawback of categorizations is that they necessarily obfuscate distinctions within categories (e.g., one can count people or countries, but no two people or countries are equivalent).
Measures entail linking the empirical qualities of a phenomenon with a conceptualization of what is being measured (Zeller et al., Reference Zeller, Zeller and Carmines1980). Different phenomena afford different types of measurement. For example, phenomena with zero values are measured using ratio scales (e.g., time taken, number of correct answers). Phenomena without zero values but with equal intervals are measured using an interval scale (e.g., date, location). And phenomena without a zero value and with unequal intervals are measured using ranks (e.g., preferring apples to oranges or agreement on a Likert scale). Finally, some phenomena are unsuited to measurement (Berka, Reference Berka1983; Zeller et al., Reference Zeller, Zeller and Carmines1980), such as categorical phenomena (group membership), ballung concepts (e.g., heuristics, culture, power), and phenomenological experience (e.g., qualia, the taste of coffee). Powerful mathematical operations are gained by turning raw data into measurements (e.g., the ability to add, subtract, and multiply), but there is always a loss of specificity (subtle differences between units and intervals are obscured). Additionally, the transformed scores may become separated from the underlying raw data if the operationalization is not aligned with the phenomenon (e.g., power could be measured using assertive language, but this would miss many structural and material features of power).
These three types of data structure are evident in Milgram’s (Reference Milgram1969) classic experiment on obedience to authority, in which participants were instructed to shock a confederate learner. The events were participants’ activities within the experiment – and no two participants behaved exactly the same way. The raw data were photographs, observations, transcripts, and audio recordings. These raw data captured some of the uniqueness of each participant’s trajectory, such as the hesitations, stress behaviors, and utterances. Excerpts selected particular incidents (e.g., attempts at resistance, moments of obedience) and afforded qualitative analysis (e.g., how some acts of resistance were prompted by religion or growing up in Germany). These excerpts could be analyzed using ballung concepts such as obedience, power, authority, agency, politeness, resistance, and expectations within an experiment (Kaposi, Reference Kaposi2017). Categorization was used to count the number of obedient participants (i.e., complied with the experimenter’s request to continue to the maximum level of shock). This yielded the core finding, namely, that 66 percent of participants were obedient. However, while useful, such counts conceal the fact that each individual obeyed and resisted in their own unique ways. Measurement of obedience was done using the magnitude of the shock delivered (0–450 volts). This ratio metric is helpful (e.g., it allows us to analyze the minimum obedience, the average obedience, or regress variables on obedience), but it ignores discontinuities, like the crucial time at 150 volts when the confederate learner asked to leave the experiment. The question is not whether excerpts, categories, or measures are the “best,” but what do the various data transformations (all built on the same raw data) reveal and conceal? Moreover, how might these different approaches to data structuring be coupled to provide more valid, reliable, and insightful findings?
Conceptualizing how raw data are converted into the three basic data structures helps explain what is gained and lost with each type of transformation. Excerpts gain contextual detail, enabling the analysis of specific data points in the context of the raw data. However, in isolation, excerpts have unknown sampling and frequency (e.g., potential cherry-picking; Morse, Reference Morse2010). Categories gain the ability to count frequency (e.g., changes over time, differences between groups). However, these gains come at the expense of homogenizing differences within each category. Measures gain advanced mathematical operations (e.g., statistical modeling) and the ability to detect subtle patterns that are not easily evident in isolated excerpts (e.g., a bias across a population). However, measures force all their phenomenon onto a linear scale that may not be appropriate (e.g., some concepts are multidimensional and do not easily conform to the measurement assumptions). Recursive data restructuring aims to accumulate the advantages of each data structure while counteracting the losses. Because the same raw data can be converted into different types of data, affording different types of analysis, the idea is to move back and forth between these data types and associated forms of analysis.
Moving back and forth between different data types can also leverage mixed methods synergies. A common rationale for conducting a mixed methods analysis is that it yields synergies, where combining the analyses produces findings that are more than the sum of the parts. For example, mixing methods can offset weaknesses, provide a fuller analysis, aid a process analysis, provide explanations, and increase credibility (Bryman, Reference Bryman2006; Greene et al., Reference Greene, Caracelli and Graham1989). Moving back and forth between different data structures, we argue, combines many established mixed methods synergies into two overarching benefits: (1) facilitating abductive inference and (2) increasing legitimacy. The following two sections will conceptualize and illustrate each of these synergies.
7.4 Abduction: Puzzle-Solving Investigation
One of the main rationales for using mixed methods is that it is more likely to produce creative insight (Greene et al., Reference Greene, Caracelli and Graham1989). This creativity might explain why the practice of mixed methods research sometimes diverges from the planned research because the methodological synergy gains its own momentum (Bryman, Reference Bryman2006). Indeed, it has even been suggested that the write-ups of mixed methods research rarely convey the creative, nonlinear, and problem-solving nature of mixed methods research (Gobo et al., Reference Gobo, Fielding, La Rocca and van der Vaart2022; Poth et al., Reference Poth, Bulut, Aquilina and Otto2021). At the heart of mixed methods research is creating something irreducible to either method (Fetters & Freshwater, Reference Fetters and Freshwater2015a) – and formalizing and documenting this process are challenging.
There is much more literature on testing theories than on creating theories worth applying or testing (see Chapter 4). Methodology tomes have focused on induction (generalizing from data) and deduction (extrapolating from theory), rather than abduction (creating plausible theories). Abduction entails going beyond the data and existing theories to postulate a new explanation that can make sense of observations (Peirce, Reference Peirce1955; Tavory & Timmermans, Reference Tavory and Timmermans2014). Abduction is simultaneously central to many of the greatest scientific breakthroughs and also difficult to formalize. At best, there are heuristics for sensitizing researchers to the emergence of new theories. Specifically, McGuire (Reference McGuire1997) recommends saturating oneself in the phenomenon of interest (i.e., having a grounded understanding of what is going on) and seeking out disruptive data, logical tensions, and empirical surprises (i.e., embracing contradictions as the gateway to insight).
Multi-resolution research spurs abductive inference because it retains access to the contextual particulars (i.e., excerpts of raw data), foregrounds tensions between particulars and generalities, and supports exploring plausible explanations. Being able to zoom down into the particulars, in terms of what went on (i.e., videos of the experiment, high-scoring sentences in text analysis, and outlying cases in a regression) enables contextual, subtle, and empathetic understanding. Also, juxtaposing qualitative and quantitative analyses of the same data increases the potential to discover meaningful puzzles and tensions (rather than being the artifacts of datasets collected at different time points or in different contexts). Finally, moving back and forth between the qualitative particulars and general findings enables a problem-solving approach to discrepancies, as tensions can be investigated by moving to a new type, or resolution, of data structure.
A study by de Saint Laurent and colleagues (Reference de Saint Laurent, Glӑveanu and Literat2021a, Reference de Saint Laurent, Glӑveanu and Literat2022) on Covid-19 memes is an example of how recursive data restructuring can spur abduction. The project analyzed memes shared during the 2020 outbreak on a Reddit community (r/CoronavirusMemes) to understand what representations of the crisis they conveyed and what function the memes served.
Data. Nearly 35,000 memes were collected between January 23 and May 17, 2020. Considering the frequency with which memes were posted, as well as the upvotes for each meme, a subsample of 1,560 memes was created to examine: (1) how the emerging representations of the pandemic were anchored in more familiar objects (e.g., the Spanish flu); (2) how these representations were objectified in concrete artefacts (e.g., the image of the coronavirus); (3) what social groups were represented (e.g., political figures); and (4) the aims of the meme (e.g., humor or giving advice).
Analysis. The coding frame was based on a recursive process involving the three authors and two research assistants. Two hundred seventy-six memes were selected and used for this purpose, following the same criteria as the 1,560 memes set that was eventually subjected to content analysis; this qualitative analytical process of constructing a code book involved connecting theoretical constructs with new and surprising elements found in the data, resulting in a multidimensional coding frame. Once the entire sample of 1,560 memes was coded, various types of quantitative analysis were performed in order to study the evolution of the memes over time, what drove their success, and the associations between themes and functions.
Augmented coding. It is challenging to scale up in-depth qualitative analysis to handle large datasets. To solve this issue, a computer application was developed in Python to facilitate using the coding frame (see Figure 7.1). The application displayed the meme to code, tick boxes corresponding to the various categories in the coding frame, and a section for notes. The application and the resulting coding frame were an innovative use of computational means to enhance manual coding. This coding-augmented qualitative analysis enabled the researchers to refine the coding frame and, in a recursive manner, the overall analysis.

Figure 7.1 Computer-aided qualitative coding
Findings. Some of the main findings related to the fact that the pandemic was most often objectified (i.e., represented in concrete terms) by displaying protective measures (e.g., social distancing) and the transmission of the virus (e.g., coughing, Figure 7.1). Memes also commonly referred to popular culture to anchor new meanings about a largely unknown, at the time, biological entity into an existing system of images, beliefs, and understandings very familiar to social media users. When it came to processes of identification, most memes depicted the self, the in-group, or people presumed to be most similar to the intended audience of internet users. Combining the in-depth qualitative and quantitative analyses also yielded some surprising abductive findings, especially regarding the political connotations of memes. While memes are often seen as primarily humorous, the quantitative analysis showed that political themes and critiques were a central part of the life of the Reddit community. However, it was zooming in on memes capturing political themes that revealed complex narratives beyond the depiction of specific politicians (for instance, some referred to supporters of different politicians, depicting them as gullible or even as dangerous). This led the researchers to the notion of role (e.g., Persecutor, Victim, Hero) in order to analyze the relationships between people or entities depicted in memes. The researchers then created a framework of roles (e.g., adding the role of the Fool) based on recursive moving between the individual memes and macro trends (e.g., sufficient frequency, coherent clustering).
Discussion. Within the research process, there was a continuous move back and forth between individual memes, the coding frame, and the larger dataset, which had been systematically coded. This zooming in on qualitative particulars and zooming out on macro trends gave the researchers confidence in the validity of their coding (e.g., by paying particular attention to counterexamples) and boosted their abductive insight. Abductive reasoning was fostered during the investigation by uncovering findings that challenged existing views of the pandemic (see also De Rosa & Mannarini, Reference De Rosa and Mannarini2020). Individual memes that were surprising were used to challenge the statistical patterns, but also the quantitative findings helped to interpret individual memes. This recursive movement led to new insights about the characters and, at a deeper level, the roles portrayed in the memes. A typology of roles was developed, including the Persecutor, Victim, Hero, and Fool. This typology recursively looped back into the data to prompt new questions: What kind of scenarios does the interaction between these roles reveal? What kinds of narratives do these roles create? These questions recursively fed into a novel analysis of the narrative content of these internet memes (de Saint Laurent et al., Reference de Saint Laurent, Glӑveanu and Literat2022).
7.5 Legitimacy: Doubly Constrained Interpretation
Recursively restructuring qualitative data can increase the legitimacy of findings by constraining interpretation. Both qualitative and quantitative analyses aim to constrain interpretation with empirical data, yet both have been criticized for having too many degrees of freedom. For example, excerpts can be selectively presented to suit a given interpretation (i.e., cherry-picking; Morse, Reference Morse2010). Equally, quantitative measurement has many opaque degrees of freedom in cleaning data and choosing tests (Wicherts et al., Reference Wicherts, Veldkamp and Augusteijn2016). Further constraining the degrees of freedom in both qualitative interpretation and quantitative analysis would produce more rigorous findings. Recursive data restructuring achieves this by constraining interpretation at both qualitative and quantitative levels.
Recursive data restructuring creates extra rigor by doubly constraining interpretation. The research is constrained by the quality criteria for both qualitative (i.e., the data should be credible, contextual, and richly described) and quantitative (i.e., the analysis should be reliable, valid, and generalizable) methods. Interpretations must convincingly operate both at a statistical level and at the level of specific cases (Seawright, Reference Seawright2016). Multi-resolution research thus uses the full qualitative depth and quantitative breadth of the data to constrain findings. The alternative is to base interpretation on a thin slice of the data (e.g., only excerpts, categories, or measures), which fails to leverage the full potential of the data.
This double qualitative–quantitative constraint is illustrated in a study reported by Noort and colleagues (Reference Noort, Reader and Gillespie2021c) that examined people withholding safety concerns, termed safety silence. In contrast to the vignette and survey methods that dominate the literature on voicing safety concerns (Noort et al., Reference Noort, Reader and Gillespie2019a), the research team used a novel experimental paradigm in which participants interacted in-person with a confederate while confronting a safety issue (Noort et al., Reference Noort, Reader and Gillespie2019b).
Data. Participants (n = 404) were asked to take part in a brainstorming task on the creative uses of a plank. The plank was about a meter long and could support only thirty kilograms. After listing their creative ideas, participants were asked to evaluate ideas ostensibly suggested by the previous participant. For each idea evaluated, the research assistant (the confederate) tested the idea in practice. All participants evaluated the same ideas, including a dangerous suggestion to use the plank as a footbridge between two chairs. What would the participants say when the research assistant (who weighed about sixty kilograms) finished assembling a wobbly footbridge and then began to walk across it?
Analysis. The quantitative analysis tested hypotheses using MANOVAs. The variables were survey measures, experimental outcomes, and textual measures of the participants’ talk. In addition, all the participants’ talk was recorded, transcribed, and made publicly available through an interactive visualization (Noort et al., Reference Noort, Reader and Gillespie2021b). The visualization was created in Python using Scattertext (Kessler, Reference Kessler2017).
Visualization. Figure 7.2 is a static screenshot of an interactive visualization of participants’ talk during the experiment. The figure combines categorizations (voice/silence, concerned/unconcerned), measures (how likely each word is to belong to each category), and excerpts (word use in context; the static plot only shows words, but, in the interactive plot, when clicked on, the words are shown in context). The figure plots the words that were most typical of participants who were concerned and voiced (top-right), concerned and silent (bottom-right), unconcerned and voiced (top-left), and unconcerned and silent (bottom-left). Words in the middle of the visualization were equally present across the categorizations.

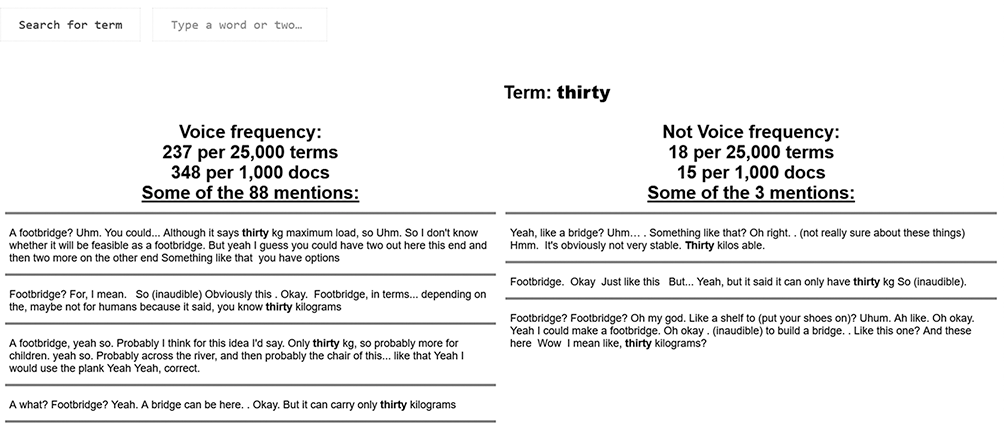
Figure 7.2 A screenshot of the interactive visualization showing that the word “thirty” was the most frequent among concerned–voicing participants and showing sentences in which the word “thirty” is used by participants who voiced or did not voice their concerns
The interactive visualization enables browsing participants’ dialogue, and clicking on a word (or searching for it) displays the word use in context (split by the experimental outcome, voice/no voice). Thus, the visualization jointly displays excerpts, categories, and measures, enabling both the researchers and readers of the research to interrogate the full depth and breadth of the raw data. With advances in visualizing qualitative data, there is much potential for such mixed methods visualizations that reveal macro statistical patterns while keeping close to the raw data (Guetterman et al., Reference Guetterman, Fetters and Creswell2015; O’Halloran et al., Reference O’Halloran, Tan, Pham, Bateman and Vande Moere2018; Sinclair & Rockwell, Reference Sinclair, Rockwell, Schreibman, Siemens and Unsworth2016).
Findings. Over half of the participants did not speak up about safety concerns despite being concerned. However, these concerned–silent participants (bottom-right of the figure) were not silent; they spoke with hesitation (“maybe,” “guess,” “uhm,” “oh,” “ah”). In contrast, participants who were concerned and voiced (top-right) referenced the safety critical information (“thirty,” “kg,” “maximum”) and were assertive (“be careful,” “because”). These qualitative particulars increase the validity and legitimacy of the findings.
Post hoc analysis, moving back and forth between the macro patterns and the qualitative particulars, yielded additional insights. The concerned–voicing participants often hesitate just prior to speaking up (“However, er. I think this is er just stands thirty kilograms,” “But uhm… yeah I think it does. But I think it is not too safe”). This yields the abductive insight that hesitation might not be the opposite of assertively speaking up, but, instead, it might be the initial stage of speaking up, indicating either cognitive load or a communicative signaling discomfort. These early hesitations are, arguably, a form of “muted voice” (Noort et al., Reference Noort, Reader and Gillespie2021c). This abductive insight adds legitimacy because it shows what is going on in particular cases, keeping the analysis close to the raw data. Also, the legitimacy is boosted because the same patterns were demonstrated both quantitatively (using participant statistics) and qualitatively (using freely browsable text).
Discussion. The ability to interrogate the verbatim transcripts of people voicing concerns (or not) within an experimental design reveals the potential synergies of mixing methods to analyze the same dataset. The same qualitative textual data can be analyzed as measures (likelihood of being said), categories (voice, silence), and excerpts (words in context). This increases the legitimacy of the research because (1) the interpretation has to account for qualitative particulars alongside quantitative patterns and (2) the resultant visualization is open to public scrutiny, with the verbatim transcripts being a powerful resource for anyone who wants to make a challenging interpretation. So far, calls for open data have focused on sharing numeric data (Shrout & Rodgers, Reference Shrout and Rodgers2018), but it is also increasingly possible to share the qualitative data that underpins the quantitative data (e.g., transcripts of what was said or done within an experiment; Glӑveanu & Gillespie, Reference Glӑveanu and Gillespie2021). Open data, which include the raw data linked to excerpts, categories, and measures, add legitimacy to the research through transparency and empowering secondary interpretations.
7.6 Data Requirements
Recursive data restructuring requires the qualitative and quantitative analyses to be applied to the same dataset. The simplest case is when exactly the same data are being used, for example, analyzing a corpus of text both qualitatively and quantitatively (e.g., when online posts are analyzed both quantitatively and qualitatively; Gillespie & Reader, Reference Gillespie and Reader2022). More complex cases entail pairing qualitative and quantitative data by events or people. For example, quantitative metadata about geographic location could be paired with social media posts (same event), or a postexperiment interview could be paired with outcomes from the experiment. In the earlier example of the safety silence experiment, the experimental outcomes are paired with what participants said during the experiment. In all these cases of paired data, one can still zoom out to view overall patterns (geographic location, experimental outcomes) and zoom in to analyze specific excerpts (posts, utterances). However, if the qualitative and quantitative data are paired merely by topic (not data, events, or people), then they are unsuitable for recursive data restructuring. If data are only paired by topic (i.e., quantitative survey and qualitative interview on the same topic), then there is no way to transform one into the other (e.g., a one-to-one correspondence between survey responses and the interview excerpts is missing). Moreover, discrepancies might be artifacts of the different contexts and data collection procedures. In contrast, when the data are tightly paired, there are common data against which discrepancies can be reconciled.
Recursive data restructuring also requires data that meet the quality criteria for both qualitative and quantitative research (Buckley, Reference Buckley2018). From a qualitative standpoint, the data should comprise contextualized raw data (e.g., quotes, images, documents) that are credible, dependable, and afford thick description. From a quantitative standpoint, the data should be from a sufficiently known population and of sufficient scale and standardization to enable robust measurement. The data used in social research usually meet one or the other criteria but rarely both.
Most of the data created by researchers do not meet the requirements for recursive data restructuring because they are usually a thin slice (e.g., excerpts or measures). However, it is possible to create suitable data using traditional methods. Traditional qualitative methods (e.g., interviews, focus groups, observations, and video recordings) produce qualitative data that can be quantified, but they can be used in multi-resolution research only if there is a large volume of data – more than is traditionally used in qualitative research (Fakis et al., Reference Fakis, Hilliam, Stoneley and Townend2014; Vogl, Reference Vogl2019). Equally, one can add qualitative data collection to traditionally quantitative methods. For example, one can add talk-aloud protocols during survey completion, open-ended survey questions, video recordings during experiments, and postexperiment interviews to create tightly paired data (Moore & Gillespie, Reference Moore and Gillespie2014; Niculae et al., Reference Niculae, Kumar, Boyd-Graber and Danescu-Niculescu-Mizil2015; Psaltis & Duveen, Reference Psaltis and Duveen2006).
In contrast, a lot of naturally occurring data are already suitable for multi-resolution research. Naturally occurring data exist independently of any research process and have not been prompted by the researchers. Instead of being elicited, they are part of the ongoing social processes in the world (i.e., instead of being reports about the world, they enable observations of the world). Naturally occurring big qualitative data are rapidly expanding and ideally suited to recursive data restructuring. Such data include online reviews (e.g., Glassdoor, TrustPilot, Care Opinion, Yelp), videos (YouTube, Vimeo), social media (Reddit, Twitter, TikTok), documents (formal complaints, earnings calls, incident reports, customer call transcripts), political speeches, cockpit voice recordings, parliamentary debates, closed-circuit television footage, and public inquiry data. These naturally occurring qualitative datasets are messy, but they have high validity because, in a pragmatist sense, they are what is going on.
7.7 The Benefits of Multi-resolution Research
Data have typically been either quantitative (e.g., population level) or qualitative (e.g., case study). However, with the growth in big qualitative data, we can access data that afford both quantitative population level and qualitative case study analyses. These big qualitative datasets force us to choose the data structure and subsequent analysis; the data were not made for either type of analysis and can be processed to enable both. We propose that no data structure is optimal in itself. Instead, we recommend leveraging the full breadth and depth of the data by recursively restructuring the data to move between excerpts, categories, and measures of the same data. Measurements can reveal differences, changes, comparisons, and statistical models. Excerpts reveal validity, contextual nuance, and challenging outliers. By analyzing only one slice of the data (i.e., excerpts, categories, or measures), the analysis is caught in an increasingly artificial trade-off between qualitative depth and quantitative breadth.
Expectations for research quality are rising. Large volumes of qualitative data are becoming easier and cheaper to record, transcribe, and analyze. Computing innovations allow for the analysis, visualization, and dissemination of deeply integrated qualitative and quantitative data side by side (Andreotta et al., Reference Andreotta, Nugroho and Hurlstone2019; Buckley, Reference Buckley2018; Chang et al., Reference Chang, DeJonckheere and Vydiswaran2021; Shahin, Reference Shahin2016). Accordingly, the choice between depth (qualitative) and breadth (quantitative) is increasingly anachronistic; we should expect research to have both depth and breadth.
The advent of big qualitative data is also raising the bar for data quality regarding size, validity, and naturalism. However, these potentialities can be achieved only with a mixed methods approach. Computational approaches to qualitative data cannot supplant traditional qualitative methods (Bennett, Reference Bennett2015). Although, algorithms can reliably identify objects, actors, actions, quotations, sentiment, and various themes, human interpretation is required to frame questions, ensure validity, interpret findings, and understand limitations. In short, it is necessary to combine computation and interpretation to seize the potential of big qualitative data (Bazeley, Reference Bazeley2017; Ho et al., Reference Ho, Chen and Shao2021). Our point is that for big qualitative data, this combination of methods should occur at the level of data, with the same data being recursively transformed between qualitative and quantitative forms.
7.7.1 Increasing the Legitimacy of Quantitative Research
Recursive data restructuring can improve the legitimacy of quantitative research, which is currently grappling with the replication crisis (Shrout & Rodgers, Reference Shrout and Rodgers2018). Many experimental findings, especially in social psychology, do not replicate when tested independently (Open Science Collaboration, 2015). One reason for this problem is that there are many degrees of freedom in data collection, curation, and analysis (Wicherts et al., Reference Wicherts, Veldkamp and Augusteijn2016). Recommendations to reduce the degrees of freedom include preregistering research, supporting replications, and making data open access (Shrout & Rodgers, Reference Shrout and Rodgers2018). Recursive data restructuring, we propose, can also further constrain the degrees of freedom by making visible the qualitative data that underpins the quantitative findings.
All quantitative research entails quantifying qualities. The risk is that the numeric values become disconnected from the phenomenon being measured. Accordingly, the best practice is to revert quantitative measures back to the qualitative data to ensure validity (Berka, Reference Berka1983; Zeller et al., Reference Zeller, Zeller and Carmines1980). Recursive data restructuring takes this idea further, arguing that as far as possible quantitized data should be revertible to its qualitative form throughout the analysis and dissemination. This possibility of reverting measures to the underlying qualitative data has only recently become possible due to technological advances in collecting, storing, analyzing, and visualizing digital data.
Traditionally experimental and quantitative research has not recorded qualitative data; the numbers have been extracted at source (e.g., in experimental outcomes or rankings on a Likert scale). But as the costs of recording, storing, and analyzing data reduce, it is possible to include qualitative data. Surveys could include open-ended questions, talk-along interviews (Moore & Gillespie, Reference Moore and Gillespie2014), and talk-aloud protocols (French et al., Reference French, Cooke, McLean, Williams and Sutton2007; Wagoner & Valsiner, Reference Wagoner, Valsiner, Gulerce, Hofmeister, Staeuble, Saunders and Kaye2005). Equally, experiments that involve social interaction can include audio or video recordings of participants in the experiment (e.g., participants interacting, screen recordings), thus making the interactions that underpin the experimental findings analyzable (Psaltis & Duveen, Reference Psaltis and Duveen2007). The benefit of deepening the data in this way is that it would enable replications and reinterpretations (Glӑveanu & Gillespie, Reference Glӑveanu and Gillespie2021).
It is important to note that recursive data restructuring should not be used simultaneously with confirmatory hypothesis testing. Recursive analysis is an exploratory method, focused upon generating theory, finding explanations, and ensuring validity. Exploratory research is fundamentally different from confirmatory research (Stebbins, Reference Stebbins2001; Tukey, Reference Tukey1980) and the data used for each should be kept separate. Exploratory research entails freely trying out various analyses on the data to find a good fit. Confirmatory research entails stating a hypothesis before analyzing the data. If recursive analysis is combined with confirmatory testing, then the recursive analysis should either be done on a training dataset (kept separate from the testing dataset) or be done on data after the confirmatory tests have been run. If confirmatory analysis were done on the same data as used to develop the hypothesis recursively, there would be a risk of overfitting, where the findings are peculiar to features of the dataset and thus fail to generalize.
7.7.2 Increasing the Impact of Qualitative Research
Recursive data restructuring can also make qualitative research more rigorous, efficient, and transparent. Qualitative research has been criticized for using small samples (Chang et al., Reference Chang, DeJonckheere and Vydiswaran2021), “cherry-picking” excerpts (Morse, Reference Morse2010), and lacking clarity on the sampling of excerpts. Augmenting qualitative research with computational analysis can address these challenges (Fielding, Reference Fielding2012; Leeson et al., Reference Leeson, Resnick, Alexander and Rovers2019).
There are many software packages for qualitative research, but to date they have been elaborate filing systems for keeping track of manually labeled excerpts of text, image, or audio (Renz et al., Reference Renz, Carrington and Badger2018). In the near future, it is expected that this software will begin to incorporate more algorithms to boost qualitative analysis. First, algorithms are equivalent to humans for basic thematic analysis, and as such, this may become an automated first step in qualitative analyses (Chang et al., Reference Chang, DeJonckheere and Vydiswaran2021; Ho et al., Reference Ho, Chen and Shao2021; Lee et al., Reference Lee, Dabirian, McCarthy and Kietzmann2020). Second, search algorithms have improved significantly, such that text, image, and video can be searched reliably. These new search algorithms can return semantically similar results (i.e., beyond narrow word-matching) with surprising accuracy (Neuman, Reference Neuman2016). Again, it is expected that these advanced search algorithms will become embedded in qualitative research software, enabling searches for more subtle and analytic concepts – or having identified a particular excerpt, the algorithm will return excerpts that are semantically, compositionally, structurally, or visually similar. In these ways, there is likely to be a meeting of qualitative interpretation and advanced computational analysis that will embed recursive data restructuring in mainstream software.
Automating basic analyses would enable qualitative research to become more ambitious, tackle larger datasets, and provide more rigorous rationales for choosing excerpts to analyze in detail. Augmenting qualitative research with algorithms would reduce the burden on analysis and thus free up humans for in-depth and contextual interpretation – which is where the human element adds most value. The algorithms would be like tireless research assistants, working ceaselessly behind the scenes to analyze enormous amounts of data and produce comprehensible intermediate overviews that form the basis for in-depth manual interpretation (Janasik et al., Reference Janasik, Honkela and Bruun2009; Wiedemann, Reference Wiedemann2013). These algorithmic assistants would find similar excerpts, quantify the frequency of a certain type of excerpt, suggest patterns, and produce visualizations that enable the analysis to work on recursively restructured data – moving freely between the macro patterns and the micro details.
7.7.3 The Micro in the Macro and the Macro in the Micro
Human behavior has a fractal quality, revealing complexity at multiple levels of resolution. Charles Eames and Ray Eames (Reference Eames and Eames1977) made a short film zooming out from a couple having a picnic in Chicago to the edge of the known universe and then zooming back into the molecules within the man’s hand, revealing patterns at the subatomic, atomic, cellular, human, planetary, solar system, and galaxy levels. Equally, zooming in and out of human behavior reveals patterns at different resolutions of analysis. For example, an utterance can be analyzed as the embodied production of sounds, as individual words, as a semantic web of associations, as consequential within a pragmatic context, as part of a genre, and as part of an institutional, cultural, or historical pattern. Recursive data restructuring aims to reconnect these levels of analysis.
We often talk about “levels” in social research (e.g., cognitive, individual, group, institutional, societal). But these levels are a simplifying heuristic. There is no ontological split between the individual and society; society is made up of individuals, and individuals are deeply societal. Our talk about levels can create problems: It obscures the way in which these so-called levels are not merely interdependent but actually one and the same. A statistical analysis of a text corpus is not on a different level to a qualitative analysis of one excerpt within the corpus; both pertain to the same data and, as such, are different views on the same underlying raw data. Recursive data restructuring, and the metaphor of zooming in with qualitative analysis and zooming out with quantitative analysis, enables one to study the social world as simultaneously micro and macro. For example, we can study excerpts within the context of macro discourses and macro discourses as comprising specific excerpts.
Multi-resolution research builds on the core pragmatist insight that all knowledge is anchored in human activity (Chapters 1, 2, and 3). Data are produced by transforming human activity into something suitable for analysis (Chapter 5). It follows that human activity can be converted into data for both qualitative and quantitative analysis. The abductive insight that guides multi-resolution research is converting the same events into multiple types of data suitable for multiple types of analysis. Multi-resolution research shows us that the taken-for-granted distinction between population-level research and case studies is an artificial byproduct of methods that have been unable to do both simultaneously.
In multi-resolution research, the micro and macro are examined as the same phenomenon viewed at different resolutions or scales; they are not two separate but “connected” phenomena. This insight about the macro and the micro being the same is obscured if raw data are thinly sliced into either excerpts, categories, or measures. Our traditional approach to separating qualitative and quantitative methods has made it difficult to conceptualize the macro in the micro and vice versa (Cornish, Reference Cornish2004). That is to say, the so-called disconnect between the micro and macro levels is an unhelpful byproduct of separating qualitative case studies from quantitative population studies. The methodological split between qualitative and quantitative methods has supported an unnatural carving of nature, separating the particular from the general. Multi-resolution research, via recursive data restructuring, seeks to make the micro (e.g., excerpts) and the macro (e.g., statistical patterns) ontologically whole – as two views of the same raw data.


 Open access