


1. Introduction
A continuum description for dense granular flows helps to predict flow behaviours in geophysical hazards and industrial applications. The description requires both a constitutive equation and a boundary condition that is often assigned as a velocity condition – no-slip (Mills, Loggia & Tixier Reference Mills, Loggia and Tixier1999; Mills, Tixier & Loggia Reference Mills, Tixier and Loggia2000; Ancey & Evesque Reference Ancey and Evesque2000; Ancey Reference Ancey2001; Lin & Yang Reference Lin and Yang2020) or slip (Hui et al. Reference Hui, Haff, Ungar and Jackson1984; Jenkins & Richman Reference Jenkins and Richman1986; Johnson & Jackson Reference Johnson and Jackson1987; Richman Reference Richman1988; Jenkins & Berzi Reference Jenkins and Berzi2010; Artoni & Santomaso Reference Artoni and Santomaso2014) – or a Coulomb-type tangential stress condition for a solid wall,  $\tau _w=\mu _wp$. Here, a hydrostatic pressure $p$ is assumed along with a constant effective wall friction coefficient $\mu _w$ (Courrech du Pont et al. Reference Courrech du Pont, Gondret, Perrin and Rabaud2003; Taberlet et al. Reference Taberlet, Richard, Valance, Losert, Pasini, Jenkins and Delannay2003; Jop, Forterre & Pouliquen Reference Jop, Forterre and Pouliquen2005; Orpe & Khakhar Reference Orpe and Khakhar2007).
While the hydrostatic  $p$ has been confirmed in both experiments and discrete element (DE) simulations (Artoni et al. Reference Artoni, Soligo, Paul and Richard2018; Lin, Jiang & Yang Reference Lin, Jiang and Yang2020), DE simulation reveals a non-constant $\mu _w$ that decays from the sphere-wall sliding friction coefficient $f$ towards the creeping regime in steady, simple shear and surface flows (Richard et al. Reference Richard, Valance, Métayer, Sanchez, Crassous, Louge and Delannay2008; Brodu, Richard & Delannay Reference Brodu, Richard and Delannay2013; Artoni & Richard Reference Artoni and Richard2015b; Artoni et al. Reference Artoni, Soligo, Paul and Richard2018). To explain the weakening, Richard et al. (Reference Richard, Valance, Métayer, Sanchez, Crassous, Louge and Delannay2008) consider how intermittent and random sphere fluctuations render individual sphere-wall friction events in different directions that cancel each other out to give lower bulk friction. Later, Artoni & Richard (Reference Artoni and Richard2015b) defined $\chi =u_{\parallel }/\sqrt {T_{\parallel }}$, using the shear velocity $u_{\parallel }$ and the streamwise bulk granular temperature $T_{\parallel }$, to indicate that a flow at small $\chi$ experiences more incoherent grain dynamics. How $\mu _w$ degrades from $f$ has been fitted, with two constants (Artoni & Richard Reference Artoni and Richard2015b), as
 \begin{equation} \frac{\mu_w}{f}=\frac{\chi^B}{A+\chi^B}. \end{equation}
 From a different aspect, Shojaaee et al. (Reference Shojaaee, Brendel, Török and Wolf2012) simulated two-dimensional shear flows to study how individual disk rotation may destroy pure sliding motion at the contact points to render  $\mu _w$ lower than $f$. Such a rotation-induced degradation of $\mu _w$ is also reported from a simulated three-dimensional granular avalanche by Yang & Huang (Reference Yang and Huang2016), together with a degradation model developed in view of the single-grain dynamics as follows. When a grain moves against the lateral wall at translation velocity $\boldsymbol {u}_{pi}$ and angular velocity $\boldsymbol {\omega }_{pi}$, it would develop a total velocity at the contact point as $\boldsymbol {u}_{pi}+\boldsymbol {R}\times \boldsymbol {\omega }_{pi}$, with $\boldsymbol {R}$ denoting the radius of gyration from the grain centre. A non-zero $\boldsymbol {\omega }_{pi}$ would divert the surface sliding velocity, together with the generated Coulomb friction, away from $\boldsymbol {u}_{pi}$. Hence the freedom of individual grain rotation provides a different friction-cancelling mechanism at the grain-size level that can accumulate to degrade $\mu _w$ mechanically according to the degree of rotation-induced diversion. The authors proposed a dimensionless rotation index $\varOmega =|\boldsymbol{\omega} |\,D/2u_\parallel$ with mean angular speed $|\boldsymbol{\omega} |=\langle |\boldsymbol {\omega }_{pi}|\rangle$, and sphere diameter $D$. They proposed a different model as
 \begin{equation} \frac{\mu_w}{f}=\frac{1+a\varOmega}{\sqrt{(1+a\varOmega)^2+(b\varOmega)^2}}, \end{equation}
with its coefficients  $a=\langle \omega _\perp \rangle /|\boldsymbol {\omega }|$ and $b=\langle \omega _\parallel \rangle /|\boldsymbol {\omega }|$ depending on the relative strength of the mean angular velocity components perpendicular and parallel to $u_\parallel$, respectively.
In fact, Louge (Reference Louge1994) also studies the sphere-wall friction force for a rapid granular flow in simple shear. After normalizing the tangential stress by the normal stress at the wall, a non-constant  $\mu _w/f$ is found to correlate well with a dimensionless relative velocity at the contact plane, $r=(|u_{\parallel }|+|\boldsymbol{\omega}|\,D/2)/\sqrt {2T_{\parallel }}$. Though this work is conducted in a flow regime different from that in the aforementioned investigations, it pioneers the concept of how different grain dynamics may affect the flow boundary condition by linking all the three velocity scales involved in $\chi$ and $\varOmega$. However, we recall that the $\mu _w/f(r)$ relation is reported for the rapid flow regime, unlike how (1.1) and (1.2) describe a monotonic decay of $\mu _w/f$ towards the creeping regime. Hence this work will focus on the two more recent models as an attempt to understand the degradation mechanisms for $\mu _w$.
Both (1.1) and (1.2) describe a monotonic decay of  $\mu _w/f$ with the strength of the associated cancelling mechanism, which suggests a correlation between the model variable $\chi$ and $\varOmega$. Equivalently, we may infer a hidden relation between the microscopic grain fluctuation and rotation dynamics. Hence this work aims to investigate experimentally the boundary stress of a confined simply sheared granular flow in view of the grain dynamics to broaden our understanding of the granular flow boundary friction coefficient. Section 2 describes the experiment set-up, while the image and data processing methods are presented in § 3, together with the measured bulk dynamics. Section 4 discusses the scaling relations between $|\boldsymbol{\omega} |$ and $T_{\|}$, and the measured data are used to consolidate a wall friction model. We conclude the work in § 5.
2. Experiment set-up and force measurement
Experiments were conducted in the annular shear cell in figure 1(a), identical to that used in Artoni et al. (Reference Artoni, Soligo, Paul and Richard2018). We used 2.1 kg of polyoxymethylene (POM) spheres of diameter  $D=5.9\pm 0.1$ mm and density $\rho _s=1400\,{\rm kg}\,{\rm m}^{-3}$ packed to height $H=15D$. A top weight of mass $M_w=0.22$, $1.1$ and $5.4$ kg was added but allowed to move in the vertical direction to apply constant loading stress over its projection area $S_A$. The confined spheres were driven by a bumpy bottom wall (see figure 1b) at different rates $O=5.9$, $23.4$ and $117.2$ r.p.m., which combines with the three $M_w$ to achieve nine flow conditions, as summarized in table 1.

Figure 1. Experiment facilities. (a) Annular shear cell filled with POM spheres to a height  $H$ and confined by the top loading $M_w$. The blue rectangle marks the observation window. (b) The base bumpy wall was rotated at rate $O$. (c) A force sensor was mounted on the lateral wall of the cell.
Table 1. The details of the nine flow conditions considered in the experiments.

A six-axis force sensor (ATI Nano17) was mounted to a cut wall piece of the same curvature and material to the shear cell container (shown in figure 1c). The sensing module was installed to a  $20\,{\rm mm}\times 20\,{\rm mm}$ square window centred at different heights $z=15$, 30, 50 and 70 mm from the base to measure the local boundary force. The force signals were averaged over time for three repeated measurements under each loading and driving condition to estimate the mean stress components. The normal stress $\sigma _{rr}$ in general follows the hydrostatic pressure profile $\sigma _{rr}(z)=M_wg/S_A+\rho g(H-z)$, as reported in figure 4(a) of Artoni et al. (Reference Artoni, Soligo, Paul and Richard2018). The wall tangential stress components in the shearing and the vertical directions, $\sigma _{r\theta }$ and $\sigma _{rz}$, were used to calculate an effective wall friction coefficient by $\mu _w=\sqrt {(\sigma _{r\theta })^2+(\sigma _{rz})^2}/|\sigma _{rr}|$. We follow Savage & Hutter (Reference Savage and Hutter1991) to conduct a set of sliding table tests to measure the intrinsic grain–wall sliding friction coefficient $f=0.24\pm 0.01$ (see the Appendix for more details). This value was used to scale $\mu _w$ before we present the depth profile of $\mu _W/f$ in figure 2(a). Degradation of $\mu _w/f$ away from the moving base is observed when the loading is sufficient ( $M_w\geq 1.1$) to engage sphere dynamics to the base motion. With the lowest $M_1$, the spheres may remain loosely in contact with each other, and a nearly constant $\mu _w/f$ was measured for $z/D<9$ but starts to grow toward the top plate with $\mu _w/f>1$, suggesting the top load effect. As we aim to study the wall friction weakening, the data of these three cases with the lowest $M_1$ will not be considered in the following analysis.

Figure 2. Depth profiles of bulk (a) scaled effective wall friction coefficient, (b) scaled streamwise velocity, (c) scaled streamwise granular temperature, and (d) scaled angular speed. A dashed horizontal line separates the shear zone (open symbol) and the creeping zone (filled symbol).
3. Image analysis and bulk dynamics
To understand the depth variation of  $\mu _w/f$ in view of (1.1) and (1.2), we obtain the needed velocity information from the individual grain dynamics. The sphere motion over the region boxed by the thick blue rectangle in figure 1(a) was recorded by a lateral high-speed camera (Phantom Miro 320S) at a rate of 24–3400 frames per second (FPS). A front LED lamp (EFFILux EFFISharp) was used to generate a bright reflection spot on each sphere surface to permit particle tracking, and two LED panels (FOTGA LED430) were placed aside to provide nearly uniform illumination. A snapshot of one recorded image is shown in figure 3(a).

Figure 3. Portion of a raw image in greyscale. (a) The sphere (red plus) and marker (green asterisk) locations are marked. (b) The red and blue (moving 1 $D$ from the centre of the red box towards the bottom) boxes denote the averaging box used to extract the bulk properties.
The reflection spot on each sphere was nearly circular and can be located by the method of circular Hough transformation (Hough Reference Hough1962) and found off-centred as the LED lamp was not aligned with the camera. We compared the bright spot positions to the manually located true centres in one image to evaluate a mean deviation distance and orientation, as  $\Delta r/D=0.09\pm 6.1\times 10^{-3}$ and $\theta =1.15\pm 0.09$ rad from the horizontal, with both standard deviations (STDs) lower than 7 $\%$. We exploited this nearly uniform deviation to offset the bright spot locations to present the sphere centres, as shown by the red plus signs in figure 3(a). Refer to Lin & Yang (Reference Lin and Yang2018) for more details. As the illumination and camera set-up remained unchanged, we applied the same offset strategy throughout the image processing routine. The nearest neighbour method was applied to track each sphere centre in consecutive images to evaluate instantaneous particle velocity vectors $\boldsymbol {u}_{pi}$ (Yang & Huang Reference Yang and Huang2016).
To measure grain rotation, a nearly circular small black marker of diameter ( $d=1\pm 0.21$ mm) was spray-painted on each sphere. We followed Lin & Yang (Reference Lin and Yang2018) to extend a search circle of radius $D/2$ from each sphere centre to locate the associated marker pixels using a greyscale threshold. We used the mean position of these identified marker pixels to present the marker centroid, as shown by the green points in figure 3(a). The same nearest neighbour method was applied to locate the same marker in the subsequent image. Under the assumption that the rotation axis remains unchanged over a short observation duration of $10^{-2}$ s, we can fit a plane to the arc swept by five consecutive marker positions in the least squares sense. The normal vector of this fitted plane when forced to pass the instantaneous sphere centre found in the first instant specifies the desired rotation axis vector that can be normalized to unity magnitude. From this, we can extract the radius of gyration $r_{pi}$ for the marker-swept arc together with its tangential velocity $V_{\theta,pi}$, and the division of the two scalars determines the angular speed $|\boldsymbol {\omega }_{pi}|=V_{\theta,pi}/r_{pi}$. A further combination with the normalized rotation axis vector gives the desired angular velocity vector $\boldsymbol {\omega }_{pi}$. More details regarding the measurement algorithms can be found in Lin & Yang (Reference Lin and Yang2018).
To estimate a bulk property from these instantaneous sphere dynamics, an averaging routine was implemented as described below. An averaging box that spans width  $L_b=6D$ along the streamwise direction and a vertical span $H_b=2D$ was employed, as illustrated by the thin red rectangle in figure 3(b). The instantaneous information of the spheres that fell in the averaging box over an observation period was collected to compute a temporal mean to present a quasi-steady bulk property at the mid-height of the average box. Together, we calculated the standard deviation of the bulk value over the observation period. We took a 5 s observation period if ${\rm FPS}\leq 1000$, and changed to a 1 s period if ${\rm FPS}>1000$. Next, we shifted the averaging box by $1D$ across the observation window in figure 1(a) to evaluate the depth profiles of bulk dynamic properties to be discussed in the following.
First, the bulk streamwise velocity was evaluated as  $u_{\parallel }(z)=\sum _i u_{p\parallel,i}(t) A_i(t)/\sum _i A_i(t)$, using the instantaneous velocity component parallel to the base $u_{p \parallel,i}(t)$ of the $i$th particle and its projection area in the averaging box $A_i(t)$. Here, $A_i(t)/\sum _i A_i(t)$ represents a weighting factor considering all the other particle information that fell within the averaging box at the same moment. The velocity perpendicular to the base, $u_z(z)$, nearly vanished across the depth for all flow conditions and hence is not considered. Figure 2(b) shows the velocity depth profile $u_{\parallel }(z)$ after being scaled by the base rim tangential velocity ( $OR$). Distinctive decay rates in the velocity depth profiles are observed. We follow Artoni et al. (Reference Artoni, Soligo, Paul and Richard2018) to define a fast-moving shear zone by the segment showing exponential decay to zero next to the moving base, and identify a much slower segment with a reduced decay rate in the creeping zone near the top plate. We fitted a line to each velocity segment and use their intersection to determine a transition height at $z/D\approx 9\unicode{x2013}11$, as marked midway at $z/D=10$. The velocity profile can be well described by $u_{\parallel }(z)/OR=u_b+(u_0-u_b)\exp (-z/\delta )$, as reported in Artoni et al. (Reference Artoni, Soligo, Paul and Richard2018). Here, $u_b$ and $u_0$ are the scaled velocities at the top and bottom, respectively, and $\delta$ is the decay length of the profile. The depth profile of the dominating streamwise granular temperature was evaluated next by
 \begin{equation} T_{{\parallel}}(z)=\sum_i\left\lbrace u_{p\parallel,i}-\left[ u_{{\parallel}}(z_c)+(z_i-z_c)\left.\frac{\partial u_{{\parallel}}}{\partial z}\right\rvert_{z_c} \right] \right\rbrace^2, \end{equation}
where the velocity gradient at the averaging box centre  $z_c$ was taken into account to offset the possible effect from the chosen averaging box height (Artoni & Richard Reference Artoni and Richard2015a). It is worth noting that the measurement errors of granular temperature could be discussed further in Xu, Reeves & Louge (Reference Xu, Reeves and Louge2004). The scaled results, $T_{\parallel }/(OR)^2$, in figure 2(c) exhibit another sharp trend variation around the velocity transition height $z/D=10$.
Next, we examine the overall grain angular speed  $|\boldsymbol {\omega }|$ in figure 2(d) after scaling by $O$. As grain rotation is induced by unbalanced torque from its interaction with the neighbouring grains and the shear cell wall, it fluctuates more severely in time than the properties deduced from grain translation motion. Hence we present the expected value of $\boldsymbol {\omega }_{pi}$ collected over the same time interval as that used for the velocity. All the $|\boldsymbol {\omega }|/O$ values exhibited an exponential decay across the shear zone, and a trend conversion into the creeping zone around the same $z/D=10$, similar to that observed on $T_{\parallel }(z)/(OR)^2$. For both $|\boldsymbol {\omega }|/O$ and $T_{\parallel }(z)/(OR)^2$, an increase of the top load caused a steeper decay in the shear zone and a stronger variation in the creeping zone, compared to that found for $u_{\parallel }(z)$. This implies a hidden link between $T_{\parallel }$ and $|\boldsymbol {\omega }|$ that has never been reported, and suggests an association between the micro-events considered in the two $\mu _w$ models.
Finally, we also examined the solid volume fraction profile  $\phi (z, t)=\sum _iA_i(t)/L_bH_b$ (not shown) to confirm a nearly consistent value at $\phi \approx 0.7$ across the creeping zone and most of the shear zone, while $\phi (z)$ drops near the moving base when $z/D<5$ due to shear-induced dilatancy. The higher value of $\phi$ may be attributed to the ordering induced by the wall. However, the fact that the transition of $u_{\parallel }$, $T_{\parallel }$ and $|\boldsymbol {\omega }|$ occurs in the plateau of $\phi$ will support that the grain packing condition is not the primary cause for the phenomenon, but some other microscopic grain dynamics.
4. Results and discussions
4.1. Scaling relations
First, we examine the  $D|\omega |/2$ as a function of $\sqrt {T_\parallel }$ in figure 4(a), where the bulk variables are manipulated to possess identical dimension. A nearly linear correlation between the two variables is discovered in the creeping and fast shear zones. To provide further evidence, we also extracted the data from contact dynamics simulations of confined shear flows as presented in Artoni & Richard (Reference Artoni and Richard2015a,Reference Artoni and Richardb). The simulation results were processed in the same way as we analysed the experimental data and are shown by the grey solid diamonds in the plot of the shear zone in figure 4(a) to confirm a similar trend. Fitting to each data group on the log-log plot gives the best-fit slope, which diminishes slightly with the degree of streamwise fluctuation $(\approx \sqrt {T_\parallel })$, from slopes of approximately 1.2 and 1.05 to unity.

Figure 4. (a) Examination of the scaled angular speed  $D\,|\boldsymbol{\omega}|/2$ with $\sqrt {T_\parallel }$ in the creeping (inset) and fast shear zones. (b) Rotation index $\varOmega$ versus $\chi$. The contact dynamic simulation (CDM) data were adopted from Artoni & Richard (Reference Artoni and Richard2015b), denoted by grey solid diamonds.
The nearly linear  $|\boldsymbol {\omega }|\unicode{x2013}\sqrt {T_\parallel }$ relation across the two flow zones suggests a direct correspondence of the two friction model parameters as shown in figure 4(b) where the trend is fitted to all data as
 \begin{equation} \varOmega=\alpha\chi^{-\beta}, \end{equation}
with  $\alpha =1.3$ and a near unity $\beta =1.03$. A much reduced $\varOmega$ occurs when the translation velocity is large, which condition would suppress the effect of the rotation-induced velocity at the contact point (i.e. $|\boldsymbol {\omega }|\,D/2u_\parallel \ll 1$) so that the grain–wall interaction is more like a pure sliding motion. Meanwhile, a small $\varOmega$ suggests a large $\chi$, which can also occur when the translation fluctuation is negligible as compared to the bulk motion (i.e. $u_\parallel /\sqrt {T_\parallel }\gg 1$). From both viewpoints, we may expect a $\mu _w$ closer to the sliding friction coefficient between the grains and the wall. In contrast, when the strength of streamwise fluctuation increases ( $\chi <1$), the intermittent grain motions are promoted to cause fluctuating interaction forces and unbalanced torque on each grain. The rotation index $\varOmega$ rises accordingly to suggest how grain rotation diverts the sliding friction force at each contact to degrade bulk sliding.
In an attempt to link these micro-mechanisms to other flow variables, we recall that the streamwise flow fluctuation is often associated with the bulk shear strain rate  $|\dot {\gamma }|$, which is a pertinent variable in understanding fast flow behaviours. We evaluated $|\dot {\gamma }|$ from $u_{\parallel }(z)$ and examine how the two variables vary with $|\dot {\gamma }|$ in figure 5. We detect a clean power-law relation $\sqrt {T_\parallel } \sim |\dot {\gamma }|^{0.7}$ in the fast shear zone but the goodness of fit is lost in the creeping regime. The current power exponent in the shear zone is greater than the values, 0.5 to 0.625, reported from a simulated confined shear flow but losing the constant exponent in the creeping regime is a shared feature (Richard et al. Reference Richard, Artoni, Valance and Delannay2020, Reference Richard, Valance, Delannay and Boltenhagen2022). Further, it is worth noting that our power exponent falls in the range of 0.5–1.0 measured in the flowing layer of a quasi-two-dimensional narrow rotating drum flow (Orpe & Khakhar Reference Orpe and Khakhar2007) and below the exact 1.0 predicted for pure collisional flows in simple shear (Jenkins & Savage Reference Jenkins and Savage1983; Campbell Reference Campbell1990).

Figure 5. Comparison of (a)  $\sqrt {T_{\parallel }}$ and (b) $|\boldsymbol {\omega }|$ with respect to bulk shear strain rate $|\boldsymbol {\dot {\gamma }}|$, manipulated to give dimension consistency.
The clean correlation between  $|\boldsymbol {\omega }|$ and $\sqrt {T_\parallel }$ in figure 4(a) explains the similar variation trend for $|\boldsymbol {\omega }|\sim |\dot {\gamma }|^{0.84}$ in the fast shear zone and the scatterings in the creeping zone. To the best of our knowledge, how $|\boldsymbol {\omega }|$ varies with $\dot {\gamma }$ at the lateral wall has never been reported. We may conclude that $|\dot {\gamma }|$ is no longer effective to characterize the particle level fluctuations in either their translation ( $\sqrt {T_\parallel }$) or rotation ( $|\boldsymbol {\omega }|$) in the creeping zone. Some may worry about the further influence from the top load or, equivalently, the confining normal stress, $\sigma _{rr}$, as their values can modify how inter-grain friction engages in a flow. Considering the combined effect of $|\dot {\gamma }|$ and $\sigma _{rr}$, a dimensionless inertial number $I=D\,|\dot {\gamma }|/\sqrt {\sigma _{rr}/\rho _s}$ has been defined and found useful to categorize dense granular flow regimes (Midi Reference Midi2004). This inertial number measures the tendency of grain streamwise motion due to $|\dot {\gamma }|$ relative to its transverse settling under $\sigma _{rr}$. Hence a flow at large $I$ is in a well-fluidized fast state so that $u_{\parallel }$ can be large and the fluctuation-induced dynamic variations are comparably irrelevant in modifying bulk dynamics. This explains why figure 6 shows a general monotonic rise for $\chi$ but decay in $\varOmega$ with increasing $I$. In particular, $\varOmega$ saturates to a constant at large $I$ to suggest a constant $\mu _w/f$ from (1.2). Likewise, the discovery that $\chi$ rises rapidly with $I$ also leads to a limiting constant $\mu _w/f\approx 1$. These findings should explain why assigning a constant $\mu _w$ works for fast flow prediction.

Figure 6. Examination of (a)  $\chi$ and (b) $\varOmega$ with respect to the local inertial number.
On the other hand, we notice a sudden rise of  $\varOmega$ for $I\lesssim 10^{-2}\unicode{x2013}10^{-1}$, suggesting a variation in $\mu _w/f$. The particular inertial number $I=10^{-2}$ has been marked to signal the transition from the quasi-static to the inertial flow regime in Midi (Reference Midi2004). In fact, Lu, Brodsky & Kavehpour (Reference Lu, Brodsky and Kavehpour2007) also report a transitional regime in between the quasi-static and the inertial flow regimes over $10^{-3}\lesssim I\lesssim 10^{-1}$ (where $I$ is converted here from the Savage number therein, which is exactly $I^2$). Hence we may expect the transition from the shear (fast inertial) flow regime to the creeping (transitional, towards the quasi-static) regime for the current flow condition.
Finally, we would like to comment on the correlation between  $\chi$, $\varOmega$ and $I$. Judging from figure 6(a), it is clear that the $\chi \unicode{x2013}I$ data do not collapse onto a universal trend, and that the $\varOmega \unicode{x2013}I$ data show a pronounced scatter in the creeping regime in figure 6(b), both contrasting the universality of the $\varOmega \unicode{x2013}\chi$ relation in figure 4(b). Hence we would like to suggest that at least one of $\sqrt {T_{\parallel }}$ and $|\boldsymbol {\omega }|$ should be considered in a boundary condition model, in addition to the commonly used $I$.
$I$.
4.2. Wall friction model
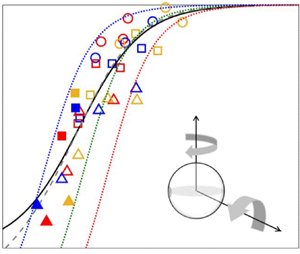
Finally, figure 7 examines the measured  $\mu _w/f$ with $\chi$, and a monotonic decay with decreasing $\chi$ is observed, confirming the effect of how promoted fluctuations, relative to bulk $u_{\parallel }$, can degrade the bulk friction coefficient from that of pure sliding. For the first time in the literature, we confirm in experiments that the $\mu _w/f\unicode{x2013}\chi$ model in (1.1) can capture the general trend of wall friction weakening with the fitted coefficients $A=0.1$ and $B=2.05$. The decay trend of $\mu _w/f$ with decreasing $\chi$ is shown by the black solid line. However promising it is, one may be concerned that granular temperature is generally more difficult to measure than the shear strain rate, and may hope to express $\sqrt {T_{\parallel }}$ by the fitted relation $\sqrt {T_\parallel } \sim |\dot {\gamma }|^{0.7}$ found in figure 5(a). However, such a nice correlation is not preserved in the creeping regime, where we detect the pronounced weakening of $\mu _w/f$. Hence the efforts seem critical and indispensable unless we may extract other robust correlations for $\sqrt {T_\parallel }\unicode{x2013}|\dot {\gamma }|$ in the creeping regime.


The other  $\mu _w/f\unicode{x2013}\varOmega$ model in (1.2) is proposed, with its two coefficients $a$ and $b$ representing the mean angular velocity components in the directions perpendicular and parallel to $u_{\parallel }$. It would be meaningful to see how well this model performs while keeping the dependence on the just-confirmed parameter $\chi$. Thus we further simplify (4.1) into $\varOmega -\chi ^{-1}$ and rewrite (1.2) as
 \begin{equation} \frac{\mu_w}{f}=\frac{1+\bar{a}/\chi}{\sqrt{(1+\bar{a}/\chi)^2+(\bar{b}/\chi)^2}}. \end{equation}
A best fit to the experimental data gives  $\bar {a}=-0.1$ and $\bar {b}=0.39$, and the new model shows equally good agreement, as portrayed by the grey dashed line. The negative $\bar {a}$ indicates that $\langle \omega _\perp \rangle$ ( $\sim \bar {a}$) points in the direction opposing $u_{\parallel }$ as grains rotate under the action of streamwise friction at the wall contact points. However, it is surprising to observe a positive $b \sim \langle \omega _\parallel \rangle$, which suggests that the individual grain–wall contact friction in the vertical direction did not cancel but showed a tendency towards the moving base even though the bulk transverse velocity is averaged to nearly zero. This phenomenon may be attributed to the grain–wall friction coefficient being much smaller than the grain internal friction coefficient $f_{int}=0.394$. This coefficient $f_{int}$ was estimated by the tangent of the static repose angle $21.5^\circ$ measured on a grain pile on the bed of the same experimental spheres. The grain–wall friction cannot compete with the inter-grain friction so that the grains adjacent to the container wall tended to rotate as sketched in the inset.
To support this speculation, we extracted the angular speed components of individual grains and used their temporal and spatial averages to estimate the bulk angular velocity components  $\langle \omega _\perp \rangle$ and $\langle \omega _\parallel \rangle$. The mean values $\bar {a}=-0.2478$ and $\bar {b}=0.3145$ agree in sign with the above-fitted values, supporting the speculated mechanism further, and provide another pair of model coefficients. In addition, the standard deviations from the mean values $\Delta a =\Delta \langle \omega _\perp \rangle /|\boldsymbol {\omega }|$ and $\Delta b = \Delta \langle \omega _\parallel \rangle /|\boldsymbol {\omega }|$ measure the strength variation in the microscopic events and can be used to estimate a set of model coefficients. In figure 7, the green dotted line first portrays the predicted $\mu _w/f$ trend using the mean $(\bar {a}, \bar {b})$, which seems a bit off-trend with the measured data. However, if we take into account the deviation in the mean $(\bar {a}, \bar {b})$, an upper bound of $\mu _w/f$ is found taking the highest $\bar {a}+\Delta a$ and the lowest $\bar {b}-\Delta b$, as shown by the blue dotted line. Likewise, the orange dotted line gives the lower bound of $\mu _w/f$ with the smallest $\bar {a}-\Delta a$ and the largest $\bar {b}+\Delta b$. It is interesting to note that the measured $\mu _w/f\unicode{x2013}\chi$ data are enveloped by these two bounding curves, supporting the proposed model and the current understanding that grain-level fluctuations – in either translation or rotation – are the key to degrading $\mu _w$ from $f$.
$f$.
5. Conclusions
This experimental work reports a non-constant lateral wall friction coefficient that weakens with the distance to the moving boundary when a loaded confined granular material was sheared at the base. To examine the data from the perspective of two existing models in (1.1) and (1.2), we measured the intrinsic sliding friction coefficient between the grains and the container wall,  $f$, bulk shear velocity $u_{\parallel }$, streamwise granular temperature $T_{\parallel }$, and averaged grain rotation speed $|\boldsymbol{\omega} |$. The independence of the two models suggests a correlation between the model parameters $\chi =u_{\parallel }/\sqrt {T_{\parallel }}$ and $\varOmega =|\boldsymbol {\omega }|\,D/2u_\parallel$. In turn, we discover a hidden correlation between $|\boldsymbol{\omega} |$ and $\sqrt {T_{\parallel }}$ across the flow field, even though the two variables actually exhibit distinctive depth variations in the shear and creeping regimes (separated at $z/D\approx 10$), just like $u_{\parallel }$. This finding further helps to consolidate the two $\mu _w/f$ models to propose (4.2) in terms of $\chi$ and physics-embedded model coefficients. Finally, we also examine $\chi$ and $\varOmega$ with respect to the local inertial number $I$ and observe a sharp rise of $\varOmega$ when $I\lesssim 10^{-2}$ in the creeping regime, suggesting that grain rotation or the equivalent translational fluctuations may bring non-negligible microscopic mechanisms to be considered in the creeping flow rheology.
To further test the robustness of the proposed model, the same confined shear flows but with different packing heights  $H$ are highly desired, as the thicknesses of the shear and creeping zones may change accordingly. Moreover, investigation in other flow configurations and an extension to the rapid granular flow regime would also be intriguing. Further careful investigations into the correlation between $\chi$, $\varOmega$ and $r$ in wider flow conditions and their possible correlations with the inertial number are undoubtedly important. The findings will deepen our knowledge on the degradation mechanism for $\mu _w/f$ and help to advance the boundary condition model for granular flows.
Supplementary material
The experiment movies under the M1O1, M2O2 and M3O3 driving conditions are available in the supplementary material at https://doi.org/10.1017/jfm.2023.556.
Funding
The authors would like to acknowledge financial support from the National Science and Technology Council, Taiwan (109-2628-E-002-002-MY3, 111-2923-E-002-003) Campus France (40943RF).
Declaration of interests
The authors report no conflict of interest.
Appendix. Sliding table tests
To measure the intrinsic grain–wall sliding friction coefficient  $f$, we conducted a sliding table test inspired by Savage & Hutter (Reference Savage and Hutter1991). We designed an acrylic circular disk on which three experimental POM spheres were glued as the vertices of an equilateral triangle, as shown in figure 8(a). Special care was taken to ensure that the spheres were glued to the same height so that the disk can stand horizontally on these spheres. The disk was placed gently on an inclined plate made of poly(methyl methacrylate) (PMMA) in figure 8(b), identical to the material used for the cylinder wall of the shear cell. After we checked that the three spheres were in balanced contact with the plate, we slowly tilted the plate until the disk started to slide. At that moment, we recorded the inclined angle $\theta _k$ by the electronic level meter so that the sliding friction coefficient can be estimated by $f_k=\tan (\theta _k$).

Figure 8. Experimental set-up of the sliding table test. (a) The top and side views of the circular disk. Three spheres were inserted into the disk at positions A, B and C. (b) The sliding table: upstream and downstream positions are the initial placements of the disk.
To reduce the possible effects from the set-ups, we alternated the orientation of the disk placement by positioning one of the glued spheres (labelled A, B, C) on the downstream side before the test. Once set in motion, the disk will slide as if the chosen sphere led the sliding down the plate, as illustrated in figure 8(b). We also alternated the plate placement by swapping the upstream and downstream sides. For each set-up, five repeated experiments were conducted and the obtained 30  $f_k$ values were averaged to give the mean value of 0.24 with a standard deviation of 0.01.


 Open access