


Milk is a crucial component of the human diet and serves as a rich source of various nutrients. According to FAO reports (2019), approximately 81% of consumable milk is derived from cows, which significantly impacts human health due to its constituents. One such constituent is fat content, which varies not only across different species but also within the same species. The composition of milk is a complex trait that is influenced by multiple factors, including genetic regulation and environmental conditions (such as lactation stage, milk yield, season, herd and diet: Singh and Gupta, Reference Singh and Gupta2016) and it is worth noting that there exists a negative correlation between milk yield and fat content. High milk-producing cows tend to exhibit low-fat content in their milk, whereas cows with low milk yield typically possess high fat content (Pizarro et al., Reference Pizarro, Landi, Navas, León, Martínez, Fernández and Delgado2020).
In dairy animals, dietary fatty acids together with fatty acids released from adipose tissue through lipolysis are taken up by the lactating udder for milk fat synthesis (Zidi et al., Reference Zidi, Fernández-Cabanás, Carrizosa, Jordana, Urrutia, Polvillo, González-Redondo, Gallardo, Amills and Serradilla2010). Therefore, lipolytic enzymes like LIPE (lipase E, hormone-sensitive type, also known as hormone-sensitive lipase) play a vital role in regulating the hydrolysis of triacylglycerol, diacylglycerol and monoacylglycerol molecules, as well as the release of free fatty acids (Fang et al., Reference Fang, Zhang, Yu, Li, Lu, Zhao and Yang2014). LIPE is expressed in various tissues, including the kidney, adipose, spleen, rumen and lung, with the highest expression level found in fat tissues (Fang et al., Reference Fang, Zhao, Jiang, Yu, Xiao and Yang2017). The bovine LIPE gene is located on chromosome 18 (Fang et al., Reference Fang, Zhao, Jiang, Yu, Xiao and Yang2017) and comprises 10 exons, as stated by the NCBI Reference Sequence: NM_001080220.1. Previous studies have reported associations between polymorphisms in the LIPE gene and meat fatty acid composition traits (Fang et al., Reference Fang, Zhang, Yu, Li, Lu, Zhao and Yang2014, Reference Fang, Zhao, Jiang, Yu, Xiao and Yang2017). Furthermore, a missense polymorphism in exon 6 of the goat LIPE gene has been found to be associated with milk yield and composition (Zidi et al., Reference Zidi, Fernández-Cabanás, Carrizosa, Jordana, Urrutia, Polvillo, González-Redondo, Gallardo, Amills and Serradilla2010). While the structural and transcriptional characteristics of the LIPE gene have been investigated in sheep (Lampidonis et al., Reference Lampidonis, Argyrokastritis, Stravopodis, Voutsinas, Ntouroupi, Margaritis, Bizelis and Rogdakis2008) and cattle (Yonezawa et al., Reference Yonezawa, Haga, Kobayashi, Katoh and Obara2008), its association with milk composition traits in cows has not been thoroughly examined. Hence, the objective of this study was to identify potential SNPs in the LIPE gene that may influence bovine milk yield and composition traits, such as protein and fat percentages, lactose content and solid-not-fat (SNF) contents, in animals with high and low milk production.
Materials and methods
The current study was conducted at the Department of Animal Wealth Development, Faculty of Veterinary Medicine, Kafrelsheikh University, Egypt. The experimental protocol was approved by the Animal Care and Ethics Committee at Kafrelsheikh University with an ethical approval number of KFS 2017/9.
Animal source and categorization, sampling and milk composition analysis
A total of 200 pure Holstein–Friesian cows were involved in this study. These cows were sired through artificial insemination and were raised at the Animal Production Research Institute (APRI), Ministry of Agriculture, Al Qarada, Kafrelsheikh, Egypt. The cows were divided into two groups based on their milk yield. Cows producing milk above the herd average were categorized as high milk yield (HMY) animals, while those with milk yields below the herd average were classified as low milk yield (LMY) cows. To select the cows for each group, we considered the extreme values of the milk yield distribution. Specifically, the top 100 animals were included in the high milk yield group, while the bottom 100 animals were included in the low milk yield group. Before categorization, the milk yield records were adjusted to the 305-day milk yield. This value was obtained from the farm records, where it was calculated using the following equation: 305-day milk yield = [total milk yield/(lactation period + 100)] × 405 (Abou-Bakr, Reference Abou-Bakr2009).
All cows received the same management practices in terms of feeding and housing. They were milked twice daily, with a 12-h interval, and were fed concentrate mixtures. For data collection, we gathered information on the 305-day total milk yield, lactation length and seasons of lactation from official farm records for each cow. This data spanned the period from January 2017 to December 2020. We analyzed approximately 10,140 milk records from the 1st to 5th lactations (categorized as 1–5, with parities ranging from 1 to 5) of all selected cows. However, for this study, we only considered milk records (n = 800) from cows in the second lactation and in the early stage of lactation (2 months post-parturition) since the expressions of most lipolytic enzymes, including LIPE, are modulated during early lactation (Khan et al., Reference Khan, Hosseini, Burrell, Rocco, McNamara and Loor2013; Contreras et al., Reference Contreras, Strieder-Barboza and Raphael2017).
A total of 200 milk samples were collected from the cows following strict aseptic conditions for milk composition analysis. The analysis included determining the percentage of fat, protein, lactose, total solids, water content, milk temperature, milk freezing point and density. These analyses were performed using a Milko-Scope at the Animal Health Research Institute in Egypt. The milk composition parameters were adjusted to account for the 305-day milk yield of the animals.
For the extraction of genomic DNA, 200 blood samples were collected from the jugular vein of the cows, with a volume of 5 ml per cow. EDTA was used as an anticoagulant in the collection process. The blood samples were collected on ice and subsequently stored at a temperature of −20°C until they were used in the DNA extraction process.
Genomic DNA extraction, SNP detection and genotyping
Three fragments of the bovine LIPE gene, specifically containing exon 2, exons 3–5, and exon 6, were amplified through PCR using specific primers and annealing temperatures as provided in Supplementary Table S1. Further details can be found in the online Supplementary File. The PCR products (n = 25, each group) were sequenced. The resulting sequences were confirmed and subsequently submitted to GenBank. Sequence analysis and alignment were conducted using Geneious Prime software version 2022.2.2 (Biomatters, Ltd, Auckland, New Zealand). For sequence comparisons, BLASTN available on the National Center for Biotechnology Information (NCBI) website (http://www.ncbi.nlm.nih.gov/) was employed. The alignment of sequences was performed using CLUSTAL-W version 1.8.
Statistical analysis
The association between the identified SNPs and phenotypic traits was analyzed using the GLM procedures of SPSS version 22, employing the following model: Y it = μ + Sr + G i + M t + GMit + e ik. In this model, Y it represents the percentages of fat, protein, lactose, total solids, water content, milk temperature, milk freezing point, and density. The symbol μ denotes the overall population mean, Sr donates the random effect of rth sires, G i represents the effect of the reported SNPs in each animal population, including the subsequent genotypes (homozygous or heterozygous), M t represents the effect of animal groups based on their milk yield (high and low milk production), GMit tests the interaction between genotype and milk yield level, and e ik accounts for the residual effect. Regarding LIPE 1, since no variations were detected at the genotype level within each group, no interaction was reported, and comparisons were only performed separately for milk yield and genotypes. Genotypic and allelic frequencies were calculated using PopGene32 software. The Hardy–Weinberg equilibrium was assessed using the chi-square test (χ2) for population comparison. Milk yield and composition are presented as least-squares means ± standard errors.
The polymorphic information content (PIC) was calculated using the GenCal online tool (https://gene-calc.pl/). Linkage disequilibrium (LD) was estimated by calculating the LD coefficient (D') and the absolute association (r 2) between two reported SNPs (LIPE1 and LIPE3). Additionally, the minor allele frequency (MAF) was estimated using Haploview version 4.2 (Cambridge, MA, USA).
Results
PCR successfully amplified different sizes of PCR products, specifically 669 bp for exon 2 with partial sequences from the flanking introns, fragments spanning exons 3, 4, and 5, and 506 bp for exon 6 of the LIPE gene (Fig. 1A, online Supplementary Fig. S1, and Fig. 2A, respectively). The PCR products from various animals, including high and low milk producers, were sequenced and deposited in the GenBank database under the accession numbers ON638900 and ON638901 for exon 2 (LIPE 1) and exons 3–6 (LIPE 2 and LIPE 3, using overlapped primers), respectively.
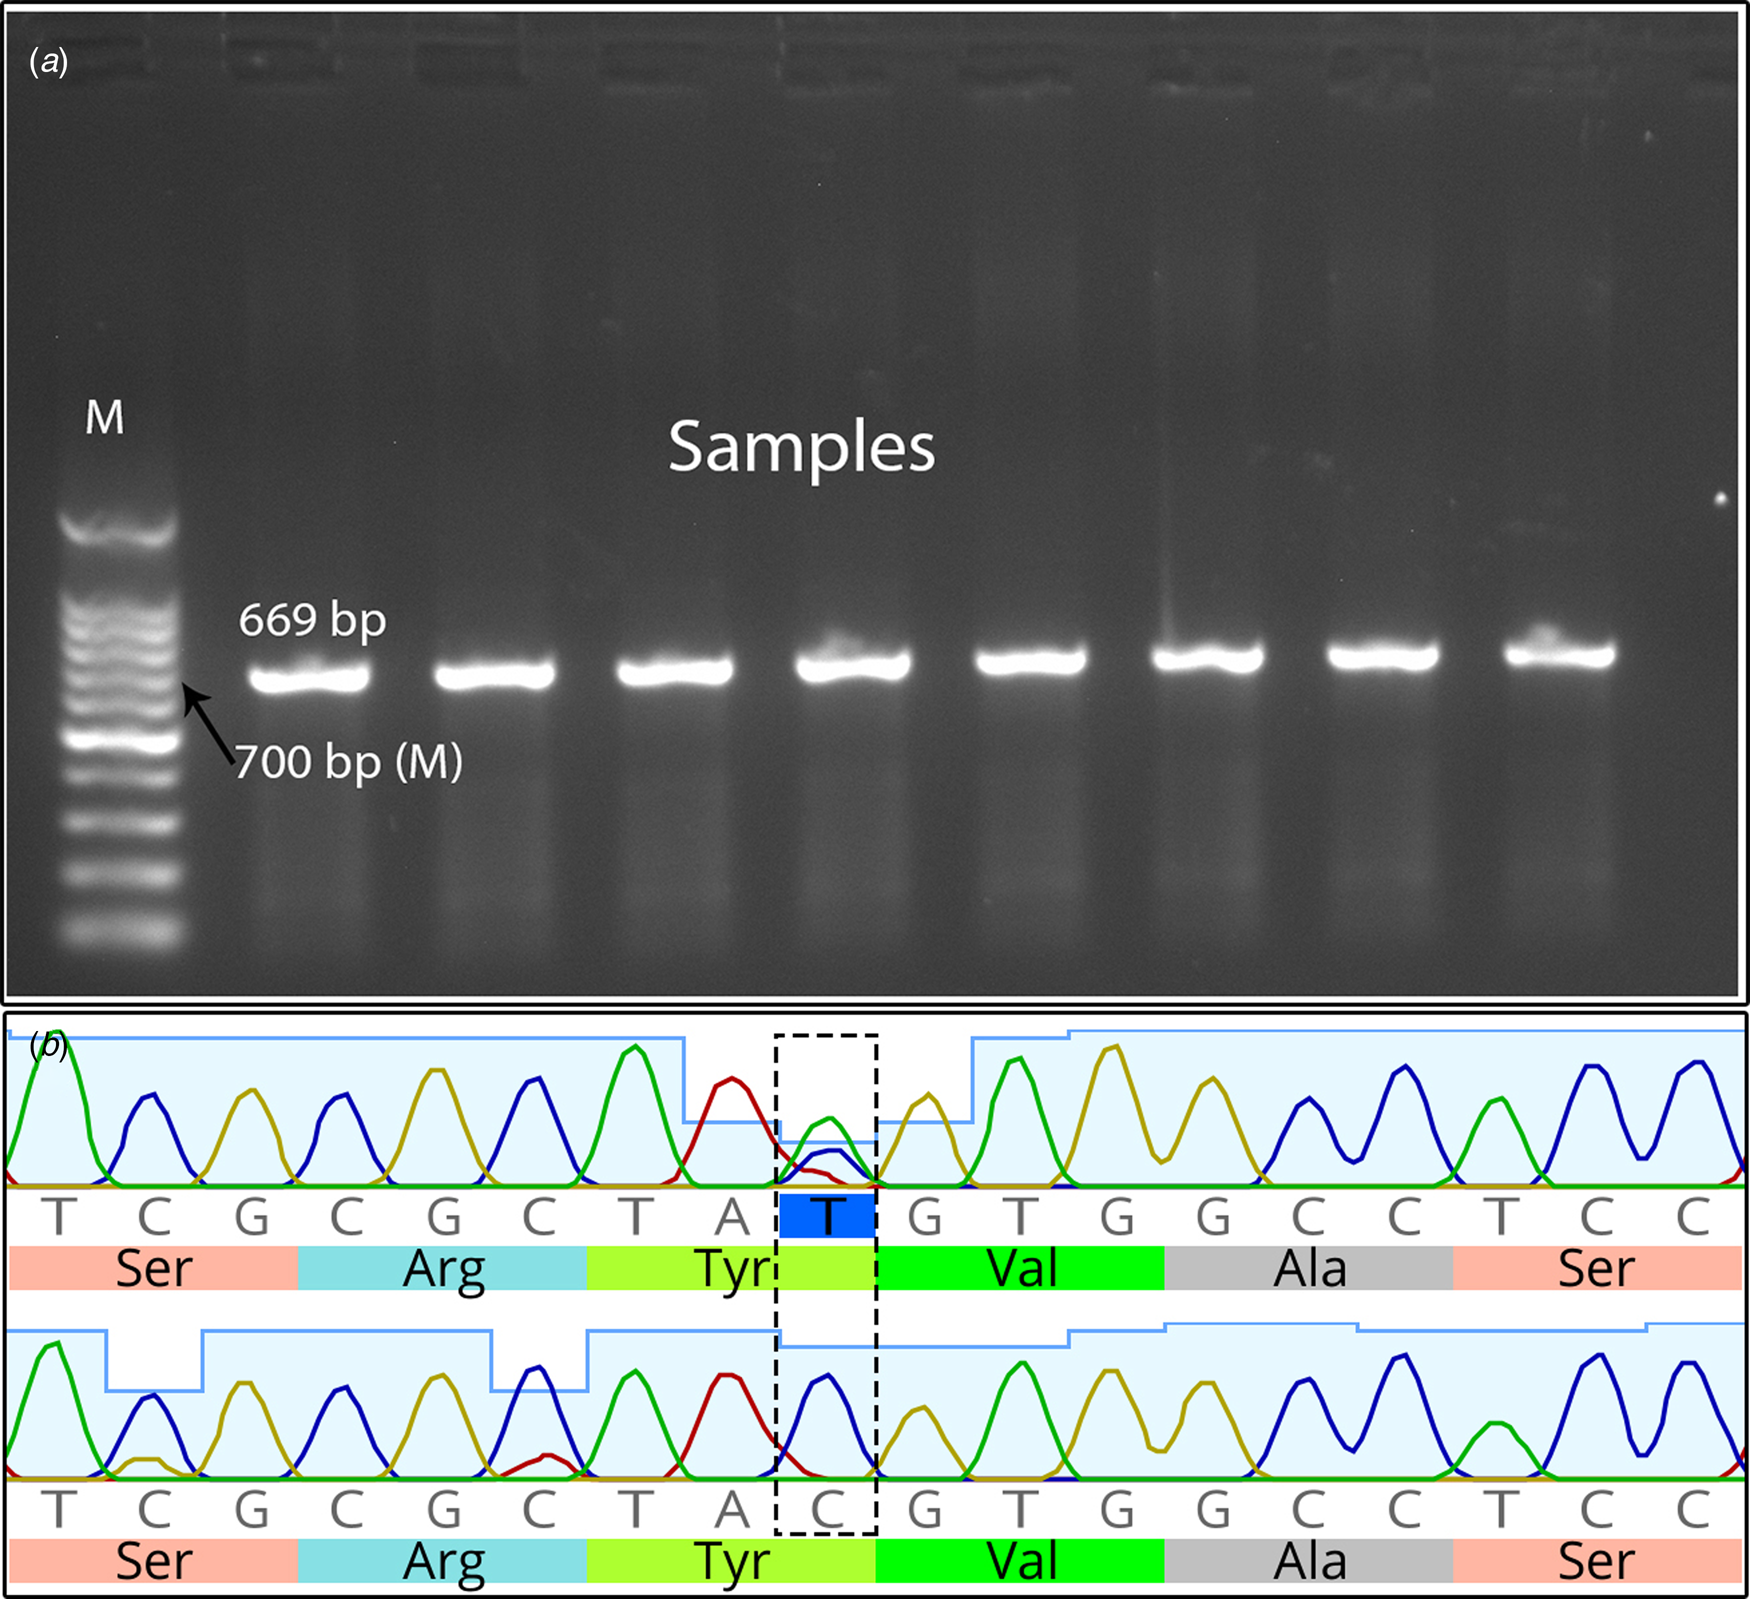
Figure 1. (A) Ethidium bromide-stained 1.5% agarose gel of PCR products from LIPE 1 (exon 2 with partial sequence from the flanking introns) of the cattle LIPE gene (lipase E, hormone sensitive type); target size 669 bp. M represents the DNA marker. (B) Sequence of exon 2 of the cattle LIPE, which indicates the synonymous SNP c.276 T > C (g.50631651 T > C; position 351 of LIPE 1) (dashed box).

Figure 2. (A) Ethidium bromide-stained 1.5% agarose gel of PCR products from LIPE 3 (exon 6 with partial sequence from the flanking introns) of the cattle LIPE gene (lipase E, hormone sensitive type); target size 506 bp. M represents the DNA marker. (B) Sequence of exon 6 of the cattle LIPE gene, which indicates the synonymous SNP c.219C > A in exon 6 (g.50635369C > A; position 1070 of LIPE3) (dashed box).
Comparison of the nucleotide sequences between HMY and LMY animals revealed two SNPs with different allele frequencies. At nucleotide position 351 of LIPE 1 (exon 2; ON638900), T was replaced with C (c.276 T > C; g.50631651 T > C, based on GenBank sequence ID: CM038096.1, Holstein–Friesian) (Fig. 1B). Similarly, at nucleotide position 1070 of LIPE 3 (exon 6; ON638901), C was replaced with A (c.219C > A; g.50635369C > A, based on GenBank sequence ID: CM038096.1, Holstein–Friesian) (Fig. 2B).
The detected SNPs, genotyping and linkage disequilibrium analysis
The genotype and allele frequencies of the identified SNPs were calculated (online Supplementary Table S2). Upon sequencing the samples, we observed the presence of both heterozygous genotypes (CT in exon 2 and AC in exon 6) and homozygous genotypes (CC for both SNPs). The genotypes of the reported SNPs in LIPE 3 for high milk yield cows were consistent with the Hardy–Weinberg equilibrium (P > 0.05), Notably, however, the genotypes of the detected SNPs in LIPE 1 (found in both HMY and LMY cows) and LIPE 3 (specific to LMY cows) deviated from it (P < 0.05). Additionally, we calculated the genetic indices of the reported SNPs in LIPE 1 and LIPE 3 (exon 2 and 6, respectively) (Table 1). The pair-wise LD analysis between the LIPE1 and LIPE3 SNPs in the HMY and LMY samples demonstrated the absence of LD. This conclusion is supported by the values of the linkage disequilibrium coefficient and the absolute association, which were D' = 0.00 (0%) and r 2 = 0.00, respectively (online Supplementary Fig. S2). These results suggest that there is no relationship between the two SNPs.
Table 1. Genetic indices of the identified SNPs

LMY, low milk yield; HMY, high milk yield.
Ho & He donate observed and expected heterozygosity, respectively. Ne represents the effective number of alleles. PIC means polymorphic information content.
Association analysis
Association analyses of the SNP c.276 T > C in exon 2 (g.50631651 T > C; position 351 of LIPE 1) revealed that animals with the TC genotype exhibited higher milk yield compared to those with the CC genotype (Table 2). Furthermore, this SNP demonstrated associations with various milk composition traits, including milk temperature, milk freezing point, density, and percentages of fat, protein, lactose, ash, and solids-not-fat. The homozygous CC genotype displayed higher values for these traits.
Table 2. Association of different LIPE 1 (exon 2) genotypes with milk characteristics in Holstein Friesian cows

SNF, solids-not-fat; data are presented as least squares means ± standard errors
* P values denote the effect of genotype and animal groups (according to milk yield: high or low) on milk quality. The P values were the same for the two factors because each animal group had only one genotypic form. No interaction was reported because there are no variations within the same group that make the P values for genotype and milk yield the same. The lowercase letters denote the statistical significances between the two categories of milk yield.
In the case of LIPE 2 (exons 3–5), no SNPs were detected, indicating that the observed variations between high- and low-milk producers can be attributed solely to differences in milk yield (online Supplementary Table S3). However, the SNP c.219C > A in exon 6 (g.50635369C > A; position 1070 of LIPE 3) exhibited a significant association with milk composition. Specifically, the CA genotype demonstrated higher percentages of fat, protein and lactose compared to the CC genotype. While the CA and CC genotypes exhibited similar percentages of fat and lactose (P > 0.05), the protein percentage was significantly higher in the CA genotype than the CC genotype. Notably, this effect was more pronounced in high milk producers compared to low milk producers (Table 3).
Table 3. Association of LIPE 3 (exon 6) genotypes with milk characteristics in Holstein Friesian cows

SNF stands for solids-not-fat, and the data are presented as least squares means ± standard errors. Different uppercase letters indicate statistical significance between the high and low milk yield groups, while lowercase letters denote statistical significance between different genotypes within each milk yield category.
Discussion
Although the identified SNPs, c.276 T > C in exon 2 (g.50631651 T > C; position 351 of LIPE 1) and c.219C > A in exon 6 (g.50635369C > A; position 1070 of LIPE 3) of the cattle LIPE gene, are located at the third position of genetic codons and do not result in amino acid changes, they show associations with milk yield and composition. The precise impact of such SNPs on gene expression is still unclear (Robert and Pelletier, Reference Robert and Pelletier2018). It is possible that these SNPs may influence translation efficiency, thereby affecting the levels of protein production or mRNA half-life. It is important to consider synonymous SNPs, also known as ‘silent’ SNPs, as they have been found to modulate translation efficiency and are strongly recommended for interpretation in association studies (Waldman et al., Reference Waldman, Tuller, Keinan and Ruppin2011). Factors such as rare tRNAs encoding specific anticodons complementary to synonymous codons on mRNAs, wobble base pairing and adjacent codon interactions can influence translation rates (Plotkin and Kudla, Reference Plotkin and Kudla2011; Brule and Grayhack, Reference Brule and Grayhack2017). Synonymous codons can affect ribosome occupancy time, leading to changes in translation elongation rates and subsequent modulation of co-translational protein folding (Plotkin and Kudla, Reference Plotkin and Kudla2011; Brule and Grayhack, Reference Brule and Grayhack2017). Gustafsson et al. (Reference Gustafsson, Govindarajan and Minshull2004) demonstrated that specific codons can significantly upregulate heterologous expression by more than 1000-fold. Moreover, SNPs within genes can result in posttranscriptional changes, including alterations in mRNA splicing and stability, nucleocytoplasmic export, and translation processes (Robert and Pelletier, Reference Robert and Pelletier2018). This information underscores the crucial role of SNPs in shaping associated phenotypes.
Generally, the majority of SNPs do not lead to changes in gene expression and, consequently, they do not affect the function and structure of the resulting protein (Karki et al., Reference Karki, Pandya, Elston and Ferlini2015). Nonetheless, ongoing research aims to identify SNPs and explore their potential associations with production- and health-related traits. For instance, Fang et al. (Reference Fang, Zhao, Jiang, Yu, Xiao and Yang2017) detected variants in the 5′-terminal sequence of the cattle LIPE gene, which exhibited a strong association with fat deposition traits and the fatty acid composition of the fatty tissue. Furthermore, a population genetic analysis of four missense mutations in exon 8 and a synonymous mutation in exon 9 of the cattle LIPE gene revealed a significant association of the three missense mutations with intramuscular fat content (Gui et al., Reference Gui, Raza, Memon, Li, Abd El-Aziz, Ullah, Jahejo, Shoorei, Khan, Quan and Liu2020).
Our results demonstrate a significant association between the TC genotype of the SNP c.276 T > C in exon 2 (g.50631651 T > C; position 351 of LIPE 1) and the CC genotype of the SNP c.219C > A in exon 6 (g.50635369C > A; position 1070 of LIPE 3) with high milk yield and favorable milk composition. However, the LD analysis and r 2 did not show any association between the two detected SNPs. In a study involving goats, Zidi et al. (Reference Zidi, Fernández-Cabanás, Carrizosa, Jordana, Urrutia, Polvillo, González-Redondo, Gallardo, Amills and Serradilla2010) identified a triallelic polymorphism in exon 2 (c.327C > A > T) and polymorphisms in exon 3 (c.558C > T and exon 6 (c.1162G > T) of the LIPE gene. Association analysis revealed that the LIPE genotypes in goats are linked to milk yield and composition. These findings, combined with our results, raise the question of whether exons 2 and 6 play a functional role in LIPE expression, which necessitates further studies and analyses, such as haplotype associations between different haplotypes and milk traits and genome-wide association studies (GWAS).
Our results also highlight the association between the c.276 T > C in exon 2 (g.50631651 T > C; position 351 of LIPE 1) and milk composition. Similar studies have demonstrated that synonymous polymorphisms in the LIPE gene are significantly associated with lipid metabolism, fatty acid composition, fat deposition and milk composition (Zidi et al., Reference Zidi, Fernández-Cabanás, Carrizosa, Jordana, Urrutia, Polvillo, González-Redondo, Gallardo, Amills and Serradilla2010; Fang et al., Reference Fang, Zhang, Yu, Li, Lu, Zhao and Yang2014, Reference Fang, Zhao, Jiang, Yu, Xiao and Yang2017; Kong et al., Reference Kong, Yuan, Liu, Li and Yue2022). These findings emphasize the regulatory role of LIPE in lipolytic function. These synonymous coding SNPs can potentially lead to changes in protein folding, binding, cellular localization and RNA secondary structure (Komar, Reference Komar2007; Shatoff and Bundschuh, Reference Shatoff and Bundschuh2020). Such molecular alterations can impact protein function, as well as the pathways and expressed traits that depend on it. Consequently, modifications in the genomic structure of LIPE can modulate its function, thereby influencing milk production and composition. However, the limited number of samples in our study restricted the detection of certain genotypes, and further investigations should explore the potential effects of these remaining genotypes.
LIPE is a crucial enzyme responsible for lipolysis, which involves the release of free fatty acids from adipose tissue, and it plays an essential role in lipogenesis and adipose metabolism (Kraemer and Shen, Reference Kraemer and Shen2006). This enzyme is predominantly expressed in adipose tissues and other tissues, such as macrophages, muscle, adrenal gland, testes and pancreatic islets, all of which have significant roles in mediating lipid metabolism and related pathways like steroidogenesis, insulin secretion and sensitivity and spermatogenesis (Saltiel, Reference Saltiel2000; Kraemer and Shen, Reference Kraemer and Shen2002, Reference Kraemer and Shen2006). The interaction between LIPE and polymerase I and transcript release factor (PTRF), a major caveolae-associated protein highly expressed in adipocytes, is suggested to be regulated by insulin during lipolysis (Aboulaich et al., Reference Aboulaich, Örtegren, Vener and Strålfors2006, Reference Aboulaich, Chui, Asara, Flier and Maratos-Flier2011; De Koster et al., Reference De Koster, Nelli, Strieder-Barboza, de Souza, Lock and Contreras2018). In bovine mammary epithelial cells, LIPE was downregulated by insulin or dexamethasone and upregulated by saturated long-chain fatty acids (Yonezawa et al., Reference Yonezawa, Haga, Kobayashi, Katoh and Obara2008). Notably, during late pregnancy and early lactation, levels of fatty acids and insulin increase to meet the requirements of mammogenesis and lactation (Greenfield et al., Reference Greenfield, Cecava and Donkin2000a, Reference Greenfield, Cecava, Johnson and Donkin2000b). During this time, LIPE appeared to be downregulated (Martín-Hidalgo et al., Reference Martín-Hidalgo, Huerta, Álvarez, Alegría, del Val Toledo and Herrera2005), while it was later upregulated during lactation (i.e., during peak and midlactation) (McNamara et al., Reference McNamara, McFarland and Bai1987; Zachut, Reference Zachut2015), suggesting its essential roles in milk production. Additional support for these findings comes from studies in dairy cattle, where basal lipolytic activity was lower during lactation compared to the dry period, and the use of an LIPE inhibitor (CAY) significantly reduced the basal lipolytic activity in fresh and lactating animals, with minimal or negligible effects in dry animals (De Koster et al., Reference De Koster, Nelli, Strieder-Barboza, de Souza, Lock and Contreras2018).
In conclusion, our results demonstrate that the LIPE gene plays a significant role in modulating milk production and composition. Specifically, the SNPs c.276 T > C (g.50631651 T > C) in exon 2 and c.219C > A (g.50635369C > A) in exon 6 hold promise as potential indicators for selecting superior milk producers in animal breeding strategies. To the best of our knowledge, this study represents the first evidence of a correlation between LIPE gene SNPs and milk production and composition in cattle. The identified markers exhibited associations with important milk traits, such as fat percentage, protein content, and lactose levels. These findings have significant implications for livestock improvement programs. By utilizing these favorable SNPs, it becomes possible to selectively breed animals with superior production traits, facilitating marker-assisted selection and the development of a high-quality genetic profile in livestock populations.
Supplementary material
The supplementary material for this article can be found at https://doi.org/10.1017/S002202992300050X


