


Introduction
All over the world, agriculture, industry, and other sectors share fresh water. Agriculture production takes the most, with a 70% usage rate generally and it exerts a constant pressure on freshwater resources (FAO, 2017). Therefore, water saving practices need to be applied in agricultural production. At the same time, irrigation practices which save water help to protect the environment. Farmers must prepare to face new challenges imposed by ongoing global warming, which is leading to warmer temperatures, constant droughts and the overuse of fresh ground water.
Agricultural areas are often located in arid and semi-arid regions where fresh water is the most limited resource. Many climate change models predict more arid climate conditions for the future (Collins et al., Reference Collins, Knutti, Arblaster, Dufresne, Fichefet, Friedlingstein, Gao, Gutowski, Johns, Krinner, Shongwe, Tebaldi, Weaver and Wehner2013). The Mediterranean region in particular has relatively lower rainfall with an irregular distribution during the year and most precipitation in winter. The Mediterranean basin has the highest evapotranspiration in the summer months, and this leads to severe water deficit conditions. Therefore, irrigation becomes more critical in these months (Lo Bianco et al., Reference Lo Bianco, Talluto and Farina2012).
Deficit irrigation (DI) strategies are recommended for irrigated fruit trees to save irrigation water with an acceptable reduction in yield. In fruit production, regulated deficit irrigation (RDI) is a technique that was developed to save water and minimize inputs in irrigation in areas where freshwater resources are limited (Talluto et al., Reference Talluto, Farina, Volpe and Lo Bianco2008; Ruiz-Sánchez et al., Reference Ruiz-Sanchez, Domingo and Castel2010). Ruiz-Sánchez et al. (Reference Ruiz-Sanchez, Domingo and Castel2010) claimed that RDI is a technique providing water saving of up to 40% without any negative effect on yield. Furthermore, RDI prevents excessive vegetative growth in many fruit crops in certain conditions and has positive effects on fruit quality parameters like soluble solid content, fruit firmness and skin colour (Blanco, Reference Blanco2019). However, these applications need to be formulated (Ebel et al., Reference Ebel, Proebsting and Evans1995), and this approach requires clear information about: (1) what are responses of fruit trees to water stress at different growing periods? and (2) Which growing periods of fruit trees are less sensitive to water stress? Determining the application period of deficit irrigation is necessary for fruit trees (Fereres and Goldhamer, Reference Fereres and Goldhamer1990).
Studies have shown that RDI applications saved around of 40% irrigation water and had no negative effects on yield, fruit size and fruit quality on peach, nectarine and apricot trees (Torrecillas et al., Reference Torrecillas, Domingo, Galego and Ruiz-Sánchez2000; Girona et al., Reference Girona, Gelly, Mata, Arbones, Rufat and Marsal2005; Pérez-Pastor et al., Reference Pérez-Pastor, Domingo, Torrecillas and Ruiz-Sánchez2009; de la Rosa et al., Reference de la Rosa, Domingo, Gómez-Montiel and Perez-Pastor2015; Blanco et al., Reference Blanco, Torres-Sanches, Blaya-Ros, Perez-Pastor and Domingo2019). When water stress is applied excessive or at the wrong moment, fruit size and yield are affected in fruit trees. There is limited information on the response of sweet cherry to water deficit strategies and drought stress and there is also very little information on fruit quality (Dehghanisanij et al., Reference Dehghanisanij, Naseri, Anyoji and Eneji2007; Marsal et al., Reference Marsal, López, Arbones, Mata, Vallverdu and Girona2009, Reference Marsal, López, del Campo, Mata, Arbones and Girona2010; Livellara et al., Reference Livellara, Saavedra and Salgado2011; Nieto et al., Reference Nieto, Prieto, Fortes, Gonzalez and Campillo2017), vegetative growth and long period yield in the Mediterranean Basin (Blanco et al., Reference Blanco, Torres-Sanches, Blaya-Ros, Perez-Pastor and Domingo2019).
Sweet cherry (Prunus avium L.) is more sensitive to water stress than other cherry species (sour and tart cherries) before and after harvesting periods (Chockchaisawasdee et al., Reference Chockchaisawasdee, Golding, Vuong, Papoutsis and Stathopoulos2016). Sweet cherry trees are sensitive to water stress especially before harvest. However, there is very little information on the effects of water deficit applications on the vegetative and generative response of sweet cherry in the Mediterranean Basin, where summer periods are dry (Centritto, Reference Centritto2005). Because sweet cherry is harvested at an early stage of the growing season, irrigation applied before and after harvest becomes important for yield, fruit quality and irrigation water saving in the growing year and in following years.
In 2019, global sweet cherry production was 2 638 179 tons, and Turkey ranked in first place with 664 224 tons in 2019 (FAO, 2021). Turkey's share in the EU market is over 90%. One of the main problems in sweet cherry growing in Turkey is to decrease the amount of irrigation water, especially after harvest. The second problem is farmers' practice of applying excessive irrigation water about three weeks before harvest to improve the fruit size according to farmer practice (Yıldız et al., Reference Yıldız, Küçükyumuk, Sarısu, Öztürk, Üzümcü, Türkeli, Seymen, Cansu and Gülcü2021). Farmers usually apply 50% more water during this period than the sweet cherry trees require. Harvest time for sweet cherry is in the middle of the growing period. This is why after harvesting, growers can neglect full irrigation or irrigation that sweet cherry needs. These practices negatively affect not only the yield obtained in the same year, but they also have negative effect on the yield and fruit quality of the next year (Doorenbos et al., Reference Doorenbos, Kassam, Bentvelsen, Branscheid, Plusje, Smith, Uittenbogaard and Van Der Wal1986). Therefore, to tackle this problem, a study was needed to determine the effects of RDI on sweet cherry fruits and trees.
The cherry cultivar 0900 Ziraat dominates sweet cherry production and trade in Turkey (Mert and Soylu, Reference Mert and Soylu2007). Additionally, it is the cultivar most preferred by producers. The current study was the first to be performed on the effects of RDIs on sweet cherry before and after harvesting on sweet cherry yield, fruit quality and tree development in the areas where the 0900 Ziraat sweet cherry cultivar is grown. The current study covered four years, and with this feature, it differs from other studies. A study conducted over a long period with fruit trees can give more reliable results. The aim of the current study was (1) to determine the effects of different irrigation strategies applied before and after harvesting on the yield, tree physiology, vegetative development and fruit quality of the 0900 Ziraat sweet cherry cultivar, (2) to develop deficit irrigation scheduling in order to save water against water deficit in growing seasons because of the decreasing availability of water resources, and (3) to determine the most suitable treatment for sweet cherry growers under RDIs conditions.
Materials and methods
The current study area and plant material
The current study was conducted at Eğirdir Fruit Research Institute (920 m altitude, 37o 49′18.24″N, 30o 52′22.90″E, Eğirdir, Isparta-Turkey) for four years (2016–2019). The current study area has a transition climate between the Mediterranean and Central Anatolia. Mediterranean summers are hot and dry, and winters are mild and rainy. The climate of Central Anatolia is one of hot summers and cold winters. The region also experiences significant temperature fluctuations between day and night. Maximum temperatures can reach 40°C in the summer months and drop below freezing in the winter. In the current study, the 0900 Ziraat sweet cherry cultivar grafted onto Gisela 6 rootstock was used. The sweet cherry trees were planted in 2010 at a spacing of 5.0 m × 3.0 m. Various physical and chemical characteristics of the experimental soil are given in Table 1.
Table 1. Soil characteristics of the experimental area

Irrigation treatments
Irrigation water for a drip irrigation system was supplied from an irrigation canal. All irrigation system parameters were calculated according to Yıldırım (Reference Yıldırım2005). Lateral pipes of 16 mm diameter with in-line pressure compensated emitters (emitter spacing 50 cm, discharge rate 4 l/h) were laid out on two sides of each tree as one lateral on each side. Each lateral was laid out 50 cm away from the tree trunk. To control water volume, one mini valve was installed at each lateral input.
Dielectric sensors (EC-5, Decagon Devices, Pullman, Washington USA) were used to measure soil moisture at soil depths of 30, 60, 90 and 120 cm before each irrigation in each treatment and replication. Effective root depth was considered to be 90 cm. In order to assess deep percolation below 0–90 cm effective root depth, soil water was monitored at 90–120 cm soil depth. One tree was selected for each replication, and an access tube was placed perpendicularly between the two lateral lines under the canopy of sweet cherry tree.
Full bloom dates of the 0900 Ziraat sweet cherry cultivar were April 18 in 2016, 21 April 2017, 10–11 April in 2018, and 24–25 April in 2019. By measuring the soil moisture after the full bloom period every year, when the soil water level at the effective root depth (0–90 cm) decreased to 40%, irrigation water was applied until available soil water at the effective root depth in all treatments reached the field capacity and subsequent irrigations were applied when the soil moisture decreased by 30%.
The current study consisted of six irrigation treatments: I C, in with no deficit irrigation (where available water at effective root depth) was brought up to field capacity in each irrigation); I 25, with non-deficit irrigation till harvesting and 25% deficit irrigation after harvest, I 50, with non-deficit irrigation till harvest and 50% deficit irrigation after harvest, I 25BH, with non-deficit irrigation 30 days after full bloom and 25% deficit irrigation after this period (including Stage III of fruit development), I 50BH, with non-deficit irrigation 30 days after full bloom and 50% deficit irrigation after this period (including Stage III of fruit development), I FRM, with farmer's treatment of non-deficit irrigation after full bloom till fruit colouring, using excessive irrigation (150% of ET) from colouring sweet cherry till harvest (Stage III of fruit development) and 50% deficit irrigation after this period to the end of the growing period (Fig. 1). I FRM treatment was conducted according to the sweet cherry growers' practice (Yıldız et al., Reference Yıldız, Küçükyumuk, Sarısu, Öztürk, Üzümcü, Türkeli, Seymen, Cansu and Gülcü2021). Sweet cherry growers apply irrigation in excess of requirements during the pre-harvest period and apply uncontrolled water deficit after harvest. Therefore, it was called farmer's treatment (I FRM). Sweet cherry has a clear separation of physiological stages: first rapid growth stage (cell division and enlargement) (Stage I), pit hardening (Stage II), and second rapid growth stage (colouring of fruit and cell enlargement) (Stage III) (Azarenko et al., Reference Azarenko, Chozinski and Brewer2008).

Figure 1. Treatments in this current study. * I, II and III numbers state ten days of each month; **Full bloom period for each year ends between 13th and 20th in April except extreme climate conditions. Harvesting period is between 20th and 25th in June for each year except extreme climate conditions. There are average 60 days between end of the full bloom period and harvesting period. Time periods in this table are the results of the climate data of long period and surveys of growth periods in sweet cherry trees (0900 Ziraat cultivar); IC, no deficit irrigation; I 25, non-deficit irrigation till harvesting, 25% deficit irrigation in comparison with the control after harvesting; I 50, non-deficit irrigation till harvesting, 50% deficit irrigation after harvesting; I 25BH, non-deficit irrigation 30 days after full bloom, 25% deficit irrigation after this period; I 50BH, non-deficit irrigation 30 days after full bloom, 50% deficit irrigation after this period; I FRM, farmer treatment, non-deficit irrigation after full bloom till colouring sweet cherry, excessive irrigation (150% of ET) from colouring sweet cherry till harvest and 50% deficit irrigation after this period to end of the growing period.
Irrigation water (I), evapotranspiration (ET) and water productivity (WP)
Irrigation water (I) was calculated in each treatment according to Eqn (1) (Kanber, Reference Kanber2002). The amount of water calculated for I c was considered to determine the amount of irrigation water for other deficit irrigation treatments.

In Eqn (1), I, is the amount of irrigation water (mm); PwFC is soil moisture content at field capacity (cm3/cm3) at the effective root zone (mm), Pw is the soil moisture content before each irrigation (cm3/cm3) at the effective root zone (mm) D Is the effective root depth (mm) γ is the soil bulk density: (g/cm3), and P is the shaded area (40%). The percentage of the shaded area was calculated as the ratio of the shaded area to the total surface area of the orchard. A water meter was used for each irrigation treatment to measure the irrigation water volume.
Evapotranspiration (ET) was calculated by using soil the water balance method (Eqn (2); James Reference James1988).

In Eqn (2), ET is the evapotranspiration (mm), I, is the amount of irrigation water (mm), R is the precipitation (mm), Cr is the capillary rise (mm), Rf is the surface run-off (mm), Dp is the water loss by deep percolation (mm), and Δs is the change in profile soil water content (mm).
Cr and Rf were considered to be zero because the current study area had no ground water problem and the emitter discharge rate on the lateral pipes was determined to be compatible with the infiltration rate. The soil water sensors were placed to measure deep percolation (Dp) below the effective root zone depth (90–120 cm). Δs is the change in the soil water storage in 90 cm soil depth at planting and at harvest (mm). Precipitation was measured after every rainy day by using a pluviometer which was near the cherry orchard.
Equation 3 was used to calculate WP for all treatments (Mali, Reference Mali2016).

where WP is the water productivity (kg/m3), Y is the yield (kg/ha), and I is the irrigation amount applied over the season (m3/ha).
Other measurements
Yield and fruit quality
For harvesting, five trees were selected in the middle of each experimental plot and all fruits were weighed (t/ha). Dates of harvest were June 21 in 2016, June 22 in 2017, June 12 in 2018, and June 22 in 2019.
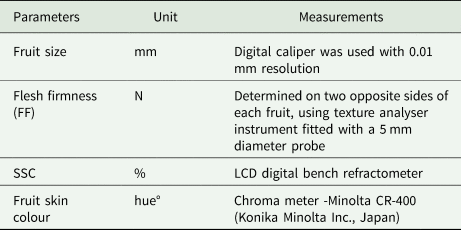
The analysis of the physical properties (fruit size, flesh firmness and fruit skin colour) and chemical properties (soluble solids content, SSC) of the fruit were analysed to determine the fruit quality (Table 2). The distance between the two opposite sides of the fruit was measured to determine fruit size. Measurements were made using a digital caliper of 0.01 mm resolution (Vernier Caliper, Germany). Flesh firmness (FF) was measured on all single fruits at two diametrically opposite locations on the cheeks of each fruit (penetrometer with a tip of 5 mm). A texture analyser (Güss FTA Type GS14 Fruit-Texture Analyser Model, Strand, South Africa) was used in the measurement and the data obtained were expressed in Newton (N). One hundred fruits from one tree for each plot were used for measurements of fruit size and FF analysis. For determining SSC, 30 fruits, whose seeds were separated, were crushed for each treatment, using a juicer to obtain fruit juice. Some fruit juice was dropped into the ocular part of the digital refractometer (HANNA Instruments) and the reading was performed (%). Fruit skin colour measurements were made on 30 fruits for each plot by using a Minolta CR-400 (Konika Minolta Inc., Japan) chromometer device equipped with a 5 mm measuring head and observer 10° and illuminant D65. The meter was calibrated using the manufacturer's standard white plate and the colour changes were quantified in the L*, a* and b* colour spaces. The hue° angle ([h° = tan − 1 [b*/a*] + 180°] was calculated when a* < 0 and b* > 0) and chroma values (C = [a*2 + b*2]1/2) were calculated from the a* and b* values. The hue values refer to a colour wheel. The red, yellow, green, and blue colours were at angles of 0°, 60°, 120° and 240°, respectively. Brightness (L*), red – green (a*) and yellow – blue (b*), hue angle (h) and chroma (C*) values were measured and hue° was used to evaluate the colour.
Table 2. Fruit quality parameters and measurements
Leaf water potential (Ψmd)
A pressure chamber was used to measure leaf water potential in the field (PMS Instrument Company, Model 1000, USA). The measurements were carried out in one tree selected from each replication by using the method of midday leaf water potential (Ψmd). At least five leaves per tree were used for Ψmd measurements and the measurements were carried out between 12:00 and 14:00 on the day before irrigations. Leaf samples were collected from the sun-exposed mature leaves of one year old shoots from different sides of the selected trees in every treatment.
Stomata conductance (gsw)
A porometer (Delta-T, Porometer-AP4, United Kingdom) was used to measure stomata conductance (gsw) on trees. g sw measurements were carried out simultaneously with Ψmd measurements on the same trees. At least five leaves were used for gsw measurements per sweet cherry tree and two repetitive readings were carried out on each leaf.
Trunk cross sectional area
Covariance analysis was made for trunk diameter. Trunk diameter (cm) was measured for all the sweet cherry trees in the dormancy period (February) using a digital caliper. Trunk diameter was measured on east-west and north-south orientations at 20 cm above the graft point and the average of the two values was calculated and taken as the trunk diameter. Equation 4 was used to calculate trunk cross-sectional area.

where trunk cross sectional area (TCSA) is in cm2, and trunk diameter (cm) is the diameter of the tree trunk.
Shoot growth
One-year shoots from the main branch were selected for each tree per replication, and the lengths of shoots were measured (cm) with digital calipers in the dormancy period (February).
Experimental design and statistical analysis
It was observed that there was a unidirectional heterogeneous soil structure in the field. For this reason, it was concluded that it was suitable to conduct the current study in a Randomized Block Experimental Design (Fig. 2). The blocks were created perpendicular to the heterogeneous soil structure. Each treatment had three replications and there were three rows in each replication, with seven trees in each row. Thus, there were twenty-one sweet cherry trees in three rows in each replication. Only five trees in the middle of the rows were considered for calculating yield and to do the other measurements. Therefore, all measurements and harvests were conducted on five trees in each replication. The analysis of variance test was conducted with JMP software (SAS Institute, 2002) for the data. The differences among treatments were compared by using the least square difference (LSD) method. The homogeneity of variances was tested to combine the years in the conducted experiment. Test results showed that the variances were not homogeneous. For this reason, years were evaluated separately.

Figure 2. Experimental design (a) and layout of the individual treatments (b) (X: sweet cherry tree) (grey coloured: considered trees for all measurements and harvesting in each replication).
Results
Irrigation water and evapotranspiration
The seasonal average temperature fluctuated during the growing season of the sweet cherry trees, between May and October (Fig. 3). The highest average temperature values were obtained in July and August. The available water at the effective root depth of the sweet cherry trees in the IC treatment was maintained at field capacity for each irrigation. I and ET were higher in 2016 and 2018 than in the other years (Table 3). The reason for this may be that the average temperature in the growing period in 2016 and the yield in 2018 were higher than in the other years. I and ET for all treatments fluctuated according to water deficit rates and application periods.
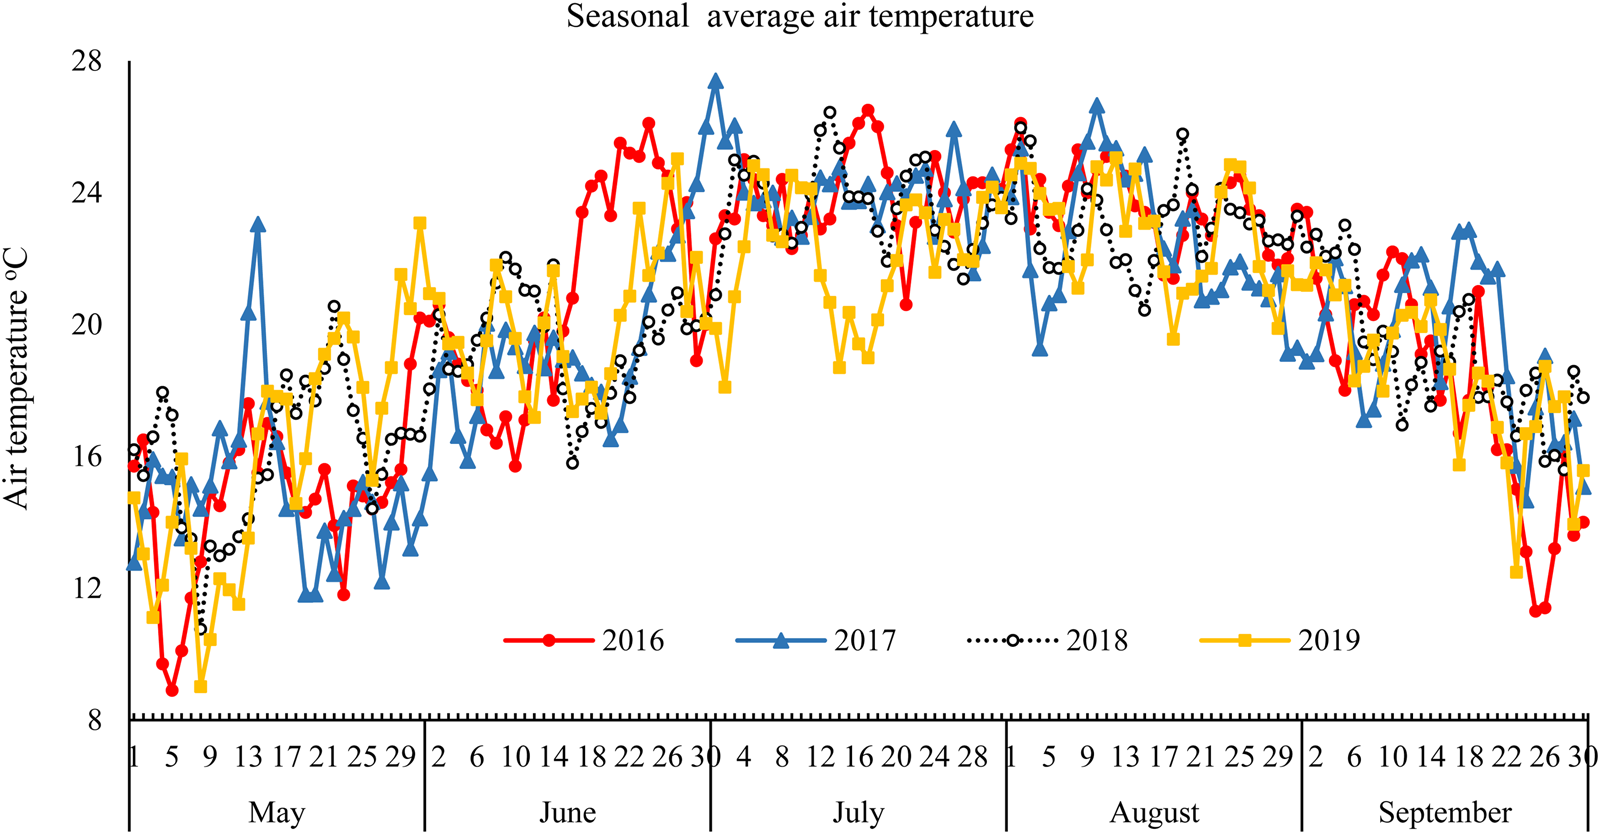
Figure 3. Seasonal daily average air temperature of the experimental area.
Table 3. Total amount of water (I, mm), evapotranspiration (ET, mm) and precipitation (P, mm) (May 1–Sept. 30) during the current study

I C, no deficit irrigation; I 25, non-deficit irrigation till harvesting, 25% deficit irrigation in comparison with the control after harvesting; I 50, non-deficit irrigation till harvesting, 50% deficit irrigation after harvesting; I 25BH, non-deficit irrigation 30 days after full bloom, 25% deficit irrigation after this period; I 50BH, non-deficit irrigation 30 days after full bloom, 50% deficit irrigation after this period; I FRM, farmer treatment, non-deficit irrigation after full bloom till colouring sweet cherry, excessive irrigation (150% of ET) from colouring sweet cherry till harvest and 50% deficit irrigation after this period to end of the growing period.
The soil water content (SWC) for all treatments was measured at 0–90 cm soil depth before each irrigation in the current study (Fig. 4). SWC at the effective root zone fluctuated during the growing season for all experiment years. When it rained during the growing season, SWC in the IC treatment exceeded field capacity and then deep percolation occurred. In other treatments, SWC exceeded field capacity on rainy days when irrigation water was applied to reach field capacity. SWC decreased especially after harvest. The reason for this decreased SWC may be associated with increasing air temperature and high ET in the summer months. The highest I and ET were determined in the IC treatment in the current study years because no deficit irrigation was applied.

Figure 4. The soil water content at initiation and after irrigations during experiment period in 2016, 2017, 2018 and 2019. FC, field capacity; WP, Wwilting point.
Irrigation water saving was obtained at different rates when deficit irrigation was applied. When compared to IC, deficit irrigation provided water savings ranging from 20.2 to 41.6% in 2016, from 22.5 to 39.7% in 2017, from 20.2 to 43.9% in 2018 and from 20.7 to 45.6% in 2019.
Yield and fruit quality
Sweet cherry fruit yield and various fruit quality parameters for the different treatments in the experimental years are presented in Table 4. The statistical analysis of the yield and various quality parameters are summarized in Table 5. Yield was not significantly different amongst the treatments in 2016 (Table 4). However, irrigation treatments resulted in significantly different yields in the 2017 (P < 0.05), 2018 (P < 0.05) and 2019 (P < 0.01) growing seasons. Due to low air temperature in 2017 when the sweet cherry trees were blooming (Fig. 3), yield was lower than in the previous year. The fruit yield was similar in the I C and I 25 treatments. The 50% water deficit application decreased yield in all experimental years. Cumulative yield data are shown in Fig. 5. The highest cumulative yield was obtained for the I C and I 25 treatments, 54.9 and 54.8 t/ha, respectively. I 50BH treatment had the lowest cumulative yield of 37.9 t/ha. It was determined that cumulative yield differences among treatments increased after the first year.
Table 4. Sweet cherry yield, fruit size, fruit flesh firmness (FF), SSC, skin colour, hue°, TSCA and shoot growth under different treatments in 2016, 2017, 2018 and 2019

I C, no deficit irrigation; I 25, non-deficit irrigation till harvesting, 25% deficit irrigation in comparison with the control after harvesting; I 50, non-deficit irrigation till harvesting, 50% deficit irrigation after harvesting; I 25BH, non-deficit irrigation 30 days after full bloom, 25% deficit irrigation after this period; I 50BH, non-deficit irrigation 30 days after full bloom, 50% deficit irrigation after this period; I FRM, farmer treatment, non-deficit irrigation after full bloom till colouring sweet cherry, excessive irrigation (150% of ET) from colouring sweet cherry till harvest and 50% deficit irrigation after this period to end of the growing period.
Different lowercase letters indicate significant differences. **LSD grouping at P < 0.01 level; *LSD grouping at P > 0.05; ns, not significant.
Table 5. Statistical analysis results of yield, fruit size, fruit flesh firmness (FF), SSC, skin colour, hue°, TCSA and shoot growth under different treatments in the experimental years

LSD, least significant difference; CV, coefficient of variation.
**LSD grouping at P < 0.01 level; *LSD grouping at P > 0.05; ns, not significant.

Figure 5. Cumulative yield of all treatments (t/ha). I C, no deficit irrigation; I 25, non-deficit irrigation till harvesting, 25% deficit irrigation in comparison with the control after harvesting; I 50, non-deficit irrigation till harvesting, 50% deficit irrigation after harvesting; I 25BH, non-deficit irrigation 30 days after full bloom, 25% deficit irrigation after this period; I 50BH, non-deficit irrigation 30 days after full bloom, 50% deficit irrigation after this period; I FRM, farmer treatment, non-deficit irrigation after full bloom till colouring sweet cherry, excessive irrigation (150% of ET) from colouring sweet cherry till harvest and 50% deficit irrigation after this period to end of the growing period.
Fruit size was affected by water deficit (P < 0.05 for 2017 and 2019, P < 0.01 for 2018) except for the first year (Table 4). As water deficit was applied to the sweet cherry trees in I 25BH and I 50BH treatments for a short period before harvesting (Stage III of Fruit Development), their fruit size was smaller than for the other treatments. In 2019, fruit size was negatively affected also for I 50. Fruit size was higher under I FRM compared with most of the deficit irrigation treatments but did not exceed the results found with I C and I 25.
With the water deficit applied to the sweet cherry trees in I 25BH and I 50BH for a short period during the first year before harvest, FF in these treatments was significantly increased (P < 0.05 for 2016 and P < 0.01 for other experiment years) in comparison with to the other treatments (Table 5). Fruit flesh firmness of the 0900 Ziraat sweet cherry cultivar was affected by water deficit even if the water deficit period was short (Table 4). Lower FF results were obtained with the I 25 and I 50 (water deficit applied after harvest), I C (no water deficit) treatments, and with I FRM.
The total SSC of sweet cherry was similar among the treatments in 2017 (Table 4). In the following years, the SSC with I 50BH and I 25BH treatments tended to be higher than with I 25 and I FRM. Deficit irrigation treatments had no effects on the hue° of any fruits in the first year. Water deficits (I 25BH and I 50BH) applied just before harvesting affected hue° positively (Table 4). I 4 (water deficit of 25% applied just before harvesting) had the highest hue° value. Farmer treatment (I FRM) had no positive effect on hue°, as the farmers claimed.
Water productivity
Water productivity measurements fluctuated according to the water deficit period in the treatments (Fig. 6). WP ranged between 1.07 and 1.59 kg/m3 in 2016 and the lowest WP was seen in I C. WP ranged between 1.05 and 1.30 kg/m3 in the second year of the experiment. I 25BH had the highest value with 1.30 kg/m3. In 2017, treatment I 50BH had the lowest WP in 2017. WP also increased with increasing yield in 2018 and 2019. In the final year, to which water deficit was applied after harvesting had the highest WP with 4.86 and 4.53 kg/m3 for I 25 and I 50, respectively.

Figure 6. Water productivity (WP) of all treatments during the experimental years. I C, no deficit irrigation; I 25, non-deficit irrigation till harvesting, 25% deficit irrigation in comparison with the control after harvesting; I 50, non-deficit irrigation till harvesting, 50% deficit irrigation after harvesting; I 25BH, non-deficit irrigation 30 days after full bloom, 25% deficit irrigation after this period; I 50BH, non-deficit irrigation 30 days after full bloom, 50% deficit irrigation after this period; I FRM, farmer treatment, non-deficit irrigation after full bloom till colouring sweet cherry, excessive irrigation (150% of ET) from colouring sweet cherry till harvest and 50% deficit irrigation after this period to end of the growing period.
Leaf water potential (Ψmd)
Leaf water potential (Ψmd) decreased generally towards the end of the growing season for all years (Fig. 7). Statistical analyses were made for each measurement date, and the results are shown on the graphs. There were more differences among treatments in the last measurements on 27th of September in 2017, 27th of September in 2018, and 17th of September in 2019. Water deficit applications in different periods affected Ψmd at different rates. Ψmd values ranged from −1.5 to −2.4 MPa in 2017, from −1.4 to −2.5 MPa in 2018 and from −1.6 to −2.6 MPa in 2019. Ψmd decreased in deficit irrigation treatments according to water deficit rates and application periods. No deficit irrigation treatment (I C) had the highest Ψmd results. The Ψmd of the sweet cherry trees responded quickly to water deficit applications. The trees were negatively affected by the water deficit applications, even if the applications lasted for short periods of time. The Ψmd in the water deficit applied at 25% after harvest was closer to I C during all project periods. The lowest Ψmd results were determined in treatments I 50BH and I 25BH which had longer water deficit periods, starting from pre-harvest to the end of the growing period.

Figure 7. LWP measurements in 2017, 2018 and 2019. Error bars indicate standard errors of the means. The letters in the box show the statistical analysis results for each measurement date and the mean of each treatment, **LSD grouping at P < 0.01 level; *LSD grouping at P > 0.05. I C, no deficit irrigation; I 25, non-deficit irrigation till harvesting, 25% deficit irrigation in comparison with the control after harvesting; I 50, non-deficit irrigation till harvesting, 50% deficit irrigation after harvesting; I 25BH, non-deficit irrigation 30 days after full bloom, 25% deficit irrigation after this period; I 50BH, non-deficit irrigation 30 days after full bloom, 50% deficit irrigation after this period; I FRM, farmer treatment, non-deficit irrigation after full bloom till colouring sweet cherry, excessive irrigation (150% of ET) from colouring sweet cherry till harvest and 50% deficit irrigation after this period to end of the growing period.
Stomata conductance (gsw)
Water deficit applications in different growing periods affected gsw and statistical analyses were conducted for all measurement dates (P < 0.01 and P < 0.05). gsw decreased generally towards the end of the growing season (Fig. 8). gsw ranged from 78.0 to 184.8 in 2017, from 88.9 to 167.0 in 2018 and from 84.9 to 160.0 mmol/m2/s1 in 2019. I C treatment had the highest gsw for all measurements. Also, I 25 had higher g sw in comparison with the other irrigation treatments close to that found with I C. Statistical differences among treatments according to gsw results were mostly detected in the last two measurements on 25th of August and 12th of September in 2017, 25th of August and 17th of September in 2018, and 24th of August and 17th of September in 2019. I 50BH and I FRM treatments had the lowest values with 50% water deficit applied. The data suggest that 25% water deficit had no negative effect on the gsw of the sweet cherry trees.

Figure 8. Stomata conductance measurements in 2017, 2018 and 2019. Error bars indicate standard errors of the means. The letters in the box show the statistical analysis of the results for each measurement date and the mean for each treatment. **LSD grouping at P < 0.01 level; *LSD grouping at P > 0.05. IC, no deficit irrigation; I 25, non-deficit irrigation till harvesting, 25% deficit irrigation in comparison with the control after harvesting; I 50, non-deficit irrigation till harvesting, 50% deficit irrigation after harvesting; I 25BH, non-deficit irrigation 30 days after full bloom, 25% deficit irrigation after this period; I 50BH, non-deficit irrigation 30 days after full bloom, 50% deficit irrigation after this period; I FRM, farmer treatment, non-deficit irrigation after full bloom till colouring sweet cherry, excessive irrigation (150% of ET) from colouring sweet cherry till harvest and 50% deficit irrigation after this period to end of the growing period.
Trunk cross sectional area
TSCA increased for all treatments during the experiment even when water deficit was applied (Table 4). TSCA was found to be statistically significant (P < 0.01 for 2018 and P < 0.05 for the other experiment years) (Table 5). The results indicate that the sweet cherry trees continued to grow despite water deficit applications. A higher increase of trunk cross section area was found with I C and I 25 relative to the other treatments. The TSCA grew the least for the trees in the I 50BH treatment (50% water deficit).
Shoot growth
The differences resulting from the treatments were recorded (Table 4). In 2016, the statistical differences were found not to be significant (Table 5). During the first year of the current study, shoot growth was not affected by deficit irrigation applications. I FRM treatment, consisting of excessive water application, had the lowest shoot development.
Discussion
RDIs saved from 20.2 to 45.6% of irrigation water over the whole experiment. The farmer's application (I FRM) also saved between 28.2 and 31.7% of irrigation water. Blanco et al. (Reference Blanco, Torres-Sanches, Blaya-Ros, Perez-Pastor and Domingo2019) found that deficit irrigation (DI) in sweet cherry trees saved the greatest amount of water (39%) over the whole experiment compared with the control treatment (no deficit irrigation). It is common for sweet cherry growers to apply an uncontrolled water schedule (less water than required for sweet cherry trees) during the postharvest period coinciding with summer in the Mediterranean region (Blanco et al., Reference Blanco, Torres-Sanches, Blaya-Ros, Perez-Pastor and Domingo2019). Available water resources have decreased in recent years because of drought and lack of precipitation. This decrease is more pronounced in the Mediterranean Region and causes severe water shortage. (Lo Bianco et al., Reference Lo Bianco, Talluto and Farina2012). Regulated deficit application is becoming more important in dry climates such as the Mediterranean region. Therefore, the results are currently relevant and important, and will be especially so in the future, with increasing water shortages caused by ongoing climate change. Sweet cherry growers can use these treatments in areas where water resources are scarce. On the other hand, any one of the deficit treatments tested in this current study can be applied for water savings by sweet cherry growers depending on the targets for fruit yield and fruit quality desired by the grower.
Deficit irrigation treatments did not affect sweet cherry fruit yield in the first year of the experiment. The reason may be that sweet cherry harvesting was early in the season and it was the first year of the current study. The harvesting date was only approximately six weeks after the first irrigation date. Due to low air temperatures when the sweet cherry trees were blooming in 2017 (Fig. 3), yield was lower than in other years. Sweet cherry trees in treatments I C and I 25 had the highest yield during the current study except in 2016. Both water deficit rates and the water deficit treatments applied before and after harvest had different effects on yield. Yield in treatments applying 25% water deficit (I 25 and I 25BH) was higher in comparison with 50% water deficit treatments (I 50 and I 50BH). Also, yield was higher in treatments in which water deficit was applied before harvest more than in treatments applied after harvest even if the same water deficit rates were applied. Extreme weather conditions and/or water deficits applied during the trees' productive cycle might affect their response in the following year (transportation effect). The effect of water deficit on the yield of temperate fruit trees, such as sweet cherry, could be felt in subsequent years (Doorenbos et al., Reference Doorenbos, Kassam, Bentvelsen, Branscheid, Plusje, Smith, Uittenbogaard and Van Der Wal1986). It is a requirement to know all the effects of deficit irrigation on the flowering of the current and following years; also, on flower bud's development, fruit and leaf area growth, fruit setting and the physiological process when a water deficit is applied (Blanco et al., Reference Blanco, Blaya-Ros, Torres-Sánchez and Domingo2020). Excessive water applications had a negative effect on flower development and could cause a decrease in fruit setting and yield in the following year (Goldhamer and Shackel, Reference Goldhamer and Shackel1990). Marsal et al. (Reference Marsal, López, Arbones, Mata, Vallverdu and Girona2009) reported that 20 and 50% water deficit applications increased yield compared to a control (no deficit irrigation) treatment. The reason for these results may be that the experiment lasted only for a period of two years. Blanco et al. (Reference Blanco, Torres-Sanches, Blaya-Ros, Perez-Pastor and Domingo2019) found that there was no significant effect of RDI on yield parameters. Water deficit rates and application periods used in that study were different from the current study. Treatment I 25 gave similar results to the no deficit irrigation treatment (I C) in terms of cumulative yield. It means that sweet cherry growers can apply 25% deficit irrigation water after harvesting when their only aim is maximum yield.
There are many factors that need to be considered in the terms of fruit quality in sweet cherry. Fruit size is one of the most effective parameters on yield. Fruit size is the most important factor in the marketing of cherries. There is a price difference between fruit size classes. Irrigation applications have a great effect on fruit diameter in addition to colour and other fruit quality parameters (Yıldız et al., Reference Yıldız, Küçükyumuk, Sarısu, Öztürk, Üzümcü, Türkeli, Seymen, Cansu and Gülcü2021). A grower producing large fruits can earn more money even if another grower has the same fruit yield. In 2017, yield was lower than in other years due to frost. Fruit size may be bigger than when yield is low than in years with an average yield. In the current study, the critical threshold for the fruit size of the 0900 Ziraat cultivar was achieved with 50% of water deficit. I 25 provided the greatest fruit size among the water deficit treatments. The fruit size obtained from treatment I FRM (excessive irrigation water applied before harvesting) was close to the yield obtained from the no deficit irrigation treatment (I C). This is an important result, but it should be considered with FF results which are important for marketing, transporting and storage. Water deficit treatments applied before harvesting (I 25BH and I 50BH) decreased fruit size. If farmers have limited water resources, they should consider that fruit size will decrease when they apply these treatments. The fruits were smaller in treatments in which water deficit was applied during fruit cell enlargement (Blanco et al., Reference Blanco, Torres-Sanches, Blaya-Ros, Perez-Pastor and Domingo2019). Marsal et al. (Reference Marsal, López, Arbones, Mata, Vallverdu and Girona2009) obtained the largest fruit size from 20% water deficit treatment. The reasons for the different results achieved in the current study may have been the use of different cultivar/rootstock combinations and a shorter experiment period than the current study.
Water deficit treatments applied before and after harvesting had different effects on flesh firmness (FF) and SSC (Table 4). Even though water deficit rates were different, water deficits applied before harvesting increased FF and SSC (I 25BH with 25% and I 50BH with 50%) more. I FRM had a negative effect on FF and SSC, because excessive irrigation water was applied before harvesting. If sweet cherry is to be stored after harvesting, treatments I 25BH and I 50BH can be applied but less yield should be expected. These results can be considered for the storage and food industries of sweet cherry. The most marketable cherry (Prunus avium L.) fruits are defined as having high fruit firmness (Christensen, Reference Christensen1995; Kappel et al., Reference Kappel, Fisher-Fleming and Hogue1996) and intense red skin colour (Crisosto et al., Reference Crisosto, Crisosto and Metheney2003). Sweet cherry growers need to consider the choice between – yield, FF or fruit size and they may apply one of the water deficit treatments according to the results of the current study. Water deficit treatments provided a higher SSC (Marsal et al., Reference Marsal, López, del Campo, Mata, Arbones and Girona2010; Blanco et al., Reference Blanco, Blaya-Ros, Torres-Sánchez and Domingo2022). Houghton et al. (Reference Houghton, Bevandicka, Neilsenb, Hannam and Nelsona2023) reported that PDI (postharvest deficit irrigations) did not affect SSC, but Marsal et al. (Reference Marsal, López, Arbones, Mata, Vallverdu and Girona2009) found that SSC decreased in deficit irrigations applied after the harvest period. The reason for obtaining different results may be the use of different cultivar/rootstocks combinations and RDI applications in these studies. Water deficit applications starting just before harvest (I 25BH) increased hue° in the last two years (Table 4). The critical threshold for obtaining high hueo was water deficit applications for a short period before harvest, and the highest hueo was obtained when 25% water deficit was applied before harvest. Blanco et al. (Reference Blanco, Blaya-Ros, Torres-Sánchez and Domingo2022) reported that deficit irrigation applied during the whole growing period negatively affected the hueo of sweet cherry. PDI (postharvest deficit irrigations) did not affect the fruit skin colour of sweet cherry fruits (Houghton et al., Reference Houghton, Bevandicka, Neilsenb, Hannam and Nelsona2023). The reason for different results in comparison with the current study's results may be due to the water deficit applications in different growing periods and at different rates. WP increased more in 2018 and 2019 than in the other years of experiment (Fig. 6). The sweet cherry trees continued to growth and boosted their yield. Therefore, an increase in WP was noticed. All WPs were lower in 2017 than in other years because frost negatively affected yields. Treatment I 25 had the highest WP in the last year of this experiment. WP in I C was the lowest in 2019. The reason for the result may be that there were no water deficit applications. All deficit irrigation applications increased the WP of the sweet cherry trees, compared with the sweet cherry trees to which full irrigation applications were applied. Blanco et al. (Reference Blanco, Zoffoli and Ayala2021) reported that in sweet cherry trees, the trees under deficit irrigation were those with the highest water productivity, and Ortega-Farias et al. (Reference Ortega-Farias, Villalobos-Soublett, Riveros-Burgos, Zúniga and Ahumada-Orellana2020) reported the same in hazelnut trees. These results are also consistent with those reported in other fruit trees subjected to reduced irrigation, such as nectarines (Prunus persica) and plums (Prunus salicina) (Conesa et al., Reference Conesa, Conejero, Vera, Ramírez-Cuesta and Ruiz-Sanchez2019; Monino et al., Reference Monino, Blanco-Cipollone, Vivas, Bodelon and Prieto2020). When water resources are insufficient for irrigation, I 25 treatment can be recommended in order to obtain the highest WP.
Ψmd measurements made before sunrise and at midday are considered to be one of the best indicators for determining the water status of plants (Shackel et al., Reference Shackel, Ahmadi, Biasi, Buchner, Goldhamer, Gurusinghe, Hasey, Kester, Krueger, Lampinen, McGourty, Micke, Mitcham, Olson, Pelletraou, Philips, Ramos, Shwankl, Sibett, Snyder, Southwick, Stevenson, Thorpe, Weinbaum and Yeager1997; Ameglio et al., Reference Ameglio, Archer, Cohen, Valancogne, Daudet, Dayau and Cruiziat1999). Due to decreasing tree water potential and soil water content in the rootzone area, Ψmd was different in each treatment (Küçükyumuk et al., Reference Küçükyumuk, Yıldız, Ertek and Kukul Kurttaş2014; Blaya-Ros et al., Reference Blaya-Ros, Blanco, Torres-Sánchez and Domingo2021). Treatments I C and I 25 treatments were similar (Fig. 7.). A water deficit of 25% after harvest, I 25, did not negatively affect the Ψmd of the trees. The decrease in Ψmd was dramatic in I 50BH, in which 50%water deficit was applied from before harvesting to the end of the growing period. Applying excessive water before harvesting did not positively affect Ψmd. Blaya-Ros et al. (Reference Blaya-Ros, Blanco, Torres-Sánchez and Domingo2021) reported that the minimum mean Ψmd values reached at the end of the first and second drought periods in moderate water stress v. severe water stress trees were −0.6 and −1.4 MPa (Ψpd), −2.2 and −3.1 MPa (Ψmd) and −1.3 and −2.3 MPa (Ψstem), respectively, for the study period. Ψmd results obtained from the current study were different because cultivar/rootstock and the ages of the trees were different. Since 50% water deficit decreased the soil water of the rootzone, the effect of water stress increased in I 50 and decreased stomata conductance. Excessive water was applied to the sweet cherry trees in treatment I FRM for a short period just before harvest, but 50% water deficit was applied to the sweet cherry trees in this treatment after harvesting. Consequently, gsw decreased for all treatments towards the end of the growing period. Sweet cherry trees in I 25 were affected less by water stress than the trees in other RDI treatments, according to gsw results. The threshold for gsw was determined as 25% water deficit applied after harvesting. When there is a decrease in soil water content at the effective root zone, this leads to water stress on plants (Mpelasoka et al., Reference Mpelasoka, Behboudian and Green2001; Küçükyumuk et al., Reference Küçükyumuk, Yıldız, Sarısu, Kaçal and Koçal2015), and plants start to close stomata to decrease transpiration from the leaf surface. The closure of stomata may be regarded as a defence mechanism against dehydration (Rieger and Duemmel, Reference Rieger and Duemmel1992; Girona et al., Reference Girona, Mata, Goldhamer, Johnson and DeJong1993; Taiz and Zeiger, Reference Taiz and Zeiger1998).
Although water deficits were applied to the sweet cherry trees, their trunk growth increased between 195.0% and 212.0%. The longer water deficit period treatments of 25% and 50% (195.0% for I 50BH and 201.1% for I 25BH) decreased trunk growth. I 25 was similar to I C during the current study. This means that 25% water deficit applied after harvesting had no negative effect on TSCA. The most effective factors for growth of TCSA in sweet cherry trees are the volume of irrigation water and irrigation frequency (Neilsen et al., Reference Neilsen, Neilsen, Kappel and Forge2014). Some previous studies have reported that deficit irrigation negatively affected the trunk diameter of sweet cherry trees (Cohen et al., Reference Cohen, Goldhamer, Fereres, Girona and Mata2001; Yazgan et al., Reference Yazgan, Büyükcangaz, Demirtaş and Candoğan2006). However, Blanco et al. (Reference Blanco, Torres-Sanches, Blaya-Ros, Perez-Pastor and Domingo2019) reported that different SDI and RDI treatments did not affect TSCA during their four years study. The reason for the different results may be due to the treatments in the studies mentioned here having different rootstocks, cultivars, water deficit rates, and experimental periods. Water deficit treatments did not affect shoot length in the first year. The highest shoot length value was obtained in I 25BH, and the lowest in I FRM. Although excessive water was applied for a short period in I FRM, a 50% water deficit was applied for a longer period after harvest. The longer period of water deficit negatively affected shoot length. Dehghanisanij et al. (Reference Dehghanisanij, Naseri, Anyoji and Eneji2007) also reported that deficit irrigation had a negative impact on the length of shoots. Different application times and irrigation deficit rates had different effects on sweet cherry trees (Küçükyumuk et al., Reference Küçükyumuk, Kaçal and Yıldız2013).
Conclusions
Mild water stress (I 25, 25% water deficit) applied after harvesting had a positive effect on yield and cumulative yield, the treatment did not negatively affect Ψmd and gsw. If sweet cherry growers are only interested in fruit size, they need to apply I 25 (25% water deficit, mild water stress) after harvest. In addition, farmer treatment can also be applied for this purpose (I FRM). Moderate water stress (50% water deficit) increased FF.
One of the deficit treatments mentioned in the current study can be applied to provide water saving by sweet cherry growers in similar climate conditions but yield and fruit quality need to be considered in the selection of the best treatment. Therefore, treatment I 25 (25% water deficit after harvesting) can be applied by sweet cherry growers because it leads to a high yield, better fruit quality and water saving.
Author contributions
C. Küçükyumuk conceived and designed the study, conducted data gathering, performed statistical analyses and wrote the article.
Funding statement
The article contains data from the research project ‘Effects of different regulated deficit irrigation applications on yield, fruit quality and storage of sweet cherry’ (Project number: TAGEM/TSKAD/15/A13/P02/14) supported by the General Directorate of Agricultural Research and Policies (Turkey) and carried out at Eğirdir Fruit Research Institute.
Competing interests
None.
Ethical standards
Not applicable.


