

30.1 Introduction
In a world of increasing economic, technological and legal globalization, transfer of laws and regulations between different legal systems is commonplace. Contemporary comparative law refers to these as ‘legal transplants’ and discusses that there is often a one-way transfer (‘diffusion’) from one country to another.Footnote 1 Corporate law and corporate governance have travelled extensively around the world through imitation, institutional investors’ lobbying, economic pressure or otherwise.Footnote 2 The UK has historically been a leading exporter of legal norms and principles, especially to former British colonial common-law countries.Footnote 3 More recently, the 1992 Cadbury Report and its successors have had significant influence on the development of corporate governance codes even in countries with no colonial ties.Footnote 4 At the same time, the US has also been influential in the corporate law field, especially in investor-related provisions,Footnote 5 while the EU has been an exporter of harmonized/standardized corporate law models even outside the EU, such as in Turkey and Ukraine.Footnote 6
The worldwide spread of stewardship codes in recent years presents a promising, but yet untested, terrain in which to explore and fine-tune the diffusion of stewardship norms. There is a widespread belief among investors and the public that many regulators and investor groups around the world have adopted a stewardship code ostensibly modelled after the UK Stewardship Code, mainly the 2012 version.Footnote 7 This diffusion hypothesis stems, in part, from the chronology of the development of stewardship codes and,Footnote 8 in part, from the capacity of the UK as a rule-generator and standard-setter in the area of corporate governance.Footnote 9 Both will be considered in this chapter by employing the method of ‘content analysis’.
In this chapter, we collect information from forty-one stewardship codes (including some earlier principles) published between 1991 and 2019,Footnote 10 and systematically examine, with computational tools, whether formal diffusion of stewardship codes took place. While we find support for the diffusion story of the UK as a stewardship norm exporter, especially in former British colonies in Asia, we also find evidence of diffusion from transnational initiatives, such as the European Fund and Asset Management Association (EFAMA) and the International Corporate Governance Network (ICGN) codes, and we report some regional clusters, such as Korea–Japan. To unpack the norm diffusion dynamics, we also examine how successfully the seven principles of the UK Code 2012 have travelled around the world, and we find that the principles on escalating engagement activities and shareholder collective action travelled the least. Our findings therefore raise doubt as to the one-way view of norm diffusion by the UK as well as the one-way view of norm-reception by policy and market actors of other countries or regional and international organizations.
These findings add to the existing academic literature in the field of comparative corporate law and corporate governance, albeit by adopting a novel methodology. Our findings also have implications for future shareholder stewardship policy and for future research on applying content analysis in the field of comparative corporate governance. For example, the analysis of these codes can contribute to the wider debate about the legitimacy and effectiveness of soft law in today’s global economy. From a normative perspective, it may also show how far, despite the lack of a global regulator, it is possible to direct the behaviour of institutional investors in a uniform way.
The chapter proceeds as follows. Section 30.2 will set out the scope and method of our analysis. Section 30.3 will consider precise textual patterns of diffusion, while Section 30.4 will focus on the diffusion of the seven UK stewardship principles and provide some reasons to account for this phenomenon. Section 30.5 ends with a brief summary of the main findings and an outlook on future work in this area and the challenges that remain.
30.2 Scope and Method of Analysis
30.2.1 Scope: Stewardship Codes across Countries
We evaluate the text of forty-one documents that can be considered ‘stewardship codes’ as displayed in Table 30.1. For the purposes of this study, a stewardship code is defined as a non-binding set of principles, standards or best practices that is accompanied by recommendations and suggestions directed to institutional investors (mainly asset owners and asset managers) and in some cases to service providers or lawmakers,Footnote 11 issued by public or private bodies, and relating to the oversight role of institutional investors to create long-term value for clients and beneficiaries and promote corporate sustainability, including engagement and monitoring of investee companies (corporate governance aspects) as well as their responsibilities towards their clients and end-beneficiaries, avoiding conflicts of interests and reporting duties (investment management aspects).Footnote 13
Table 30.1 Stewardship codes around the world
| Country and year(s) | Full name of code | Drafted by |
|---|---|---|
| Australia (ACSI) 2018 | Australian Asset Owner Stewardship Code | Australian Council of Superannuation Investors |
| Australia (FSC) 2017 | Principles of Internal Governance and Asset Stewardship | Financial Services Council |
| Brazil 2016 | AMEC Stewardship Code | Associação de Investidores no Mercado de Capitais |
| Canada 2005 | Statement of Principles Regarding Member Activism | Canada Coalition for Good Corporate Governance |
| Canada 2010 | Principles for Governance, Monitoring, Voting and Shareholder Engagement | Canada Coalition for Good Corporate Governance |
| Canada 2017 | CCGC Stewardship Principles | Canada Coalition for Good Corporate Governance |
| Denmark 2016 | Stewardship Code | Committee on Corporate Governance of the Danish Business Authority |
| EFAMA 2011 | EFAMA Code for External Governance: Principles for the Exercise of Ownership Rights in Investee Companies | European Fund and Asset Management Association |
| EFAMA 2018 | EFAMA Stewardship Code: Principles for Asset Managers’ Monitoring of, Voting in, Engagement with Investee Companies | European Fund and Asset Management Association |
| Hong Kong 2016 | Principles of Responsible Ownership | Securities and Futures Commission |
| ICGN 2003 | ICGN Statement on Institutional Shareholder Responsibilities | International Corporate Governance Network |
| ICGN 2007, 2013 | ICGN Statement of Principles on Institutional Shareholder Responsibilities | International Corporate Governance Network |
| ICGN 2016 | ICGN Global Stewardship Principles | International Corporate Governance Network |
| India (IRDAI) 2017 | Guidelines on Stewardship Code for Insurers | Insurance Regulatory and Development Authority of India (IRDAI) |
| India (PFRDA) 2018 | Common Stewardship Code | Pension Fund Regulatory and Development Authority (PFRDA) |
| India (SEBI) 2019 | Stewardship Code | Securities and Exchange Board of India (SEBI) |
| Italy 2013, 2015, 2016 | Italian Stewardship Principles for the Exercise of Administrative and Voting Rights in Listed Companies | Assogestioni |
| Japan 2014, 2017 | Principles for Responsible Institutional Investors | Council of Experts on the Stewardship Code, Financial Services Agency |
| Kenya 2017 | Stewardship Code for Institutional Investors | Capital Markets Authority |
| Korea 2016 | Principles on the Stewardship Responsibilities of Institutional Investors | Korea Corporate Governance Service |
| Malaysia 2014 | Malaysian Code for Institutional Investors | Minority Shareholder Watchdog Group |
| Netherlands 2011 | Best Practices for Engaged Share-Ownership | Eumedion |
| Netherlands 2018 | Dutch Stewardship Code | Eumedion |
| Singapore 2016Footnote 12 | Stewardship Principles for Responsible Investors | Stewardship Asia Centre |
| South Africa 2011 | Code for Responsible Investing in South Africa | Committee on Responsible Investing by Institutional Investors in South Africa |
| Switzerland 2013 | Guidelines for Institutional Investors Governing the Exercising of Participation Rights in Public Limited Companies | Swiss Association of Pension Fund Providers, together with other associations |
| Taiwan 2016 | Stewardship Principles for Institutional Investors | Taiwan Stock Exchange |
| Thailand 2017 | Thai Securities and Exchange Commission Investment Governance Code | Securities and Exchange Commission, Thailand |
| UK 1991 | The Responsibilities of Institutional Shareholders | Institutional Shareholders’ Committee |
| UK 2002, 2005, 2007 | The Responsibilities of Institutional Shareholders and Agents – Statement of Principles | Institutional Shareholders’ Committee |
| UK 2009 | Code on the Responsibilities of Institutional Investors | Institutional Shareholders’ Committee |
| UK 2010, 2012, 2020 | The UK Stewardship Code | Financial Reporting Council of the United Kingdom |
| US 2017 | Stewardship Framework for Institutional Investors | Investor Stewardship Group |
Some of these documents are explicitly called ‘stewardship codes’, while others use substantive terms such as ‘responsible ownership’ or ‘institutional investors’ rather than ‘stewardship’, and/or refer to the document not as a ‘code’ but as ‘principles’ or ‘guidelines’. To some extent, these differences indicate an evolutionary process from ‘pure’ self-regulation in terms of the degree of government/state involvement to more mandated forms of full or partial self-regulation, notably in the UK where, over time, the principles for the responsibilities of institutional investors, initially developed by the (now dissolved) Institutional Shareholders’ Committee (ISC) in 1991, became more formalized as a ‘stewardship code’ introduced in 2010 under the auspices of the Financial Reporting Council (FRC), and further revised in 2012 and 2019.Footnote 14 Another example of this evolution can be found in the Netherlands, where the Eumedion Best Practices for Engaged Share-Ownership of 2011 turned into a Dutch Stewardship Code in 2018.Footnote 15 Here, the issuer of both documents is the same, but the change in the terminology reflects the incorporation of new stewardship obligations stemming from the revised Shareholder Rights Directive which was transposed in the Netherlands in June 2019.Footnote 16 Yet, in other instances, differences in the titles are merely of a terminological nature since some codes with different titles are, in fact, very similar in substantive terms and they all use a principles-based approach.Footnote 17 In the remainder of the chapter, we will use the term stewardship code to refer to all these documents.
Table 30.1 also contains information about the issuers of these codes. It can be seen that they range from regulatory bodies, stock exchanges and committees organized by them, to national, supranational or international investor associations, and other investor-related groups.Footnote 18 Most of these codes relate to specific countries, but we also include six transnational codes, two drafted by the EFAMA and four by the ICGN.Footnote 19 Two investor associations in Australia and three public authorities in India have published stewardship codes meant to apply to specific sectors; yet, in substance, these codes address general issues of stewardship; thus, we included them in our analysis as separate observations.
The list of countries and codes in Table 30.1 is similar to (though more comprehensive than) websites and other publications that have listed and compared stewardship codes.Footnote 20 By contrast, a table in the Corporate Governance Factbook of the Organisation for Economic Co-operation and Development (OECD) on the ‘roles and responsibilities of investors’ covers more countries than Table 30.1.Footnote 21 However, for some of these countries, this refers to binding laws, which do not fall under the scope of this chapter. Some of the non-binding instruments mentioned by the OECD are predominantly about the investment management relationship between institutional investors and their clients – not their stewardship position as shareholders of companies. Finally, we exclude countries for which a stewardship code is not available in English,Footnote 22 given that our method – to be explained in the following – relies on textual measures of similarity.
30.2.2 Method: Content Analysis in Social Sciences and Law
The method of ‘content analysis’ is frequently used across the social sciences. In a nutshell, it refers to the analysis of the ‘informational contents of textual data’ employing tools that are ‘objective, systematic, and quantitative’.Footnote 23 The tools range from simple ones, such as counting the number of words, to complex forms of readability and sentiment analysis via computational methods. The main advantage of content analysis is that it can provide quantitative measures of comparisons for qualitative information. For example, in political science a frequent example of content analysis provides measurements of the substantive orientation of documents in terms of left–right-wing orientation.Footnote 24
As legal rules are typically based on a particular text (legislation, case law, contracts, etc.), it is possible to use content analysis also in legal scholarship.Footnote 25 Yet, examples are rare: there is some research that employs content analysis for court decisions – notably in the US, for example, to map the political orientation of the opinions of the justices of the US Supreme Court.Footnote 26 Following a growing trend of quantitative research in comparative constitutional law, there are also some examples of research on constitutional texts using content analysis.Footnote 27
In the present case, the raw material of our analysis is the forty-one stewardship codes of Table 30.1. In this regard, some limitations of the application of content analysis need to be acknowledged. First, as this analysis can consider only existing codes, it is not possible to answer the question of why some large economies, such as Germany and China, do not have such a code (yet).Footnote 28 Second, a textual analysis of stewardship codes does not consider the application of the codes in practice; thus, for example, our findings can analyze whether and how the Kenyan code is similar to other codes, but not why Kenyan institutional investors have not subscribed to the code.Footnote 29 Third, the use of content analysis is unable to consider subtle nuances of the text (also noting that we rely on the English text for all codes, even for non-English-speaking countries). Thus, given these limitations, we do not claim that this method is superior to more conventional tools of legal analysis; however, as we show in the following, it can be a useful tool to uncover textual patterns in a systematic way.
30.2.3 Concepts: Legal Transplants and Diffusion
The analysis provided in this chapter is inspired by and contributes to core concepts of comparative law, in particular ‘legal transplants’ and ‘diffusion’, as well as the broader theme of ‘legal families’ and other taxonomies of legal systems.Footnote 30 The traditional focus of the literature on legal transplants is that norms of a particular piece of legislation are deliberately copied with minor modifications.Footnote 31 However, recent discussions have broadened the scope of discussion as far as both the object of the transplant and the procedure for the transfer are concerned: thus, transplants may concern not only the positive law but, for example, also case law or – as in the present case – non-binding codes.Footnote 32 It is also said that the process leading to a transplant may be by means not of simply copying the rules but of a general legal and cultural influence.Footnote 33
This latter notion of a broader foreign influence often uses other terms than ‘legal transplant’, for example referring to ‘legal circulation’, ‘cross-fertilization’, ‘migration’ or ‘diffusion’.Footnote 34 Beyond comparative law, social scientists often also use the notion of diffusion, for example in the innovation literature and in the fields of political science, public administration and organizational studies.Footnote 35 It has been suggested that legal research should follow this terminology.Footnote 36 Findings from these other disciplines can also be relevant for law; for example, research by political scientists and sociologists examines whether policy diffusion is a result of ‘social construction, coercion, competition, or learning’.Footnote 37 A recent article on corporate governance codes also phrases their evolution as the ‘diffusion of regulatory innovations’, finding, for example, that certain models diffuse because standard-setters aim to signal that they conform to international benchmarks, but possibly also because they are motivated by efficiency considerations.Footnote 38
This chapter therefore uses the term diffusion as the main conceptual framework. As regards the types of ‘diffusion’, it focuses only on ‘formal’ diffusion and considers how far textual characteristics have diffused between stewardship codes. Thus, our systematic analysis does not imply that any such rules operate in a functionally identical way. Indeed, some codes that are formally similar function differently in practice, which is the phenomenon that has been coined ‘faux convergence’, and observed in the case of stewardship codes.Footnote 39
30.3 Evidence of Stewardship Diffusion
30.3.1 The Shareholder Stewardship Movement and Citation Patterns
The term ‘stewardship’ to refer to the corporate governance role of institutional shareholders was used for the first time by the UK’s Institutional Shareholders’ Committee Code of 2009.Footnote 40 In the academic literature, however, the same term can be found much earlier in the context of the stewardship theory of management, an alternative of the agency theory, which defines situations in which managers act as stewards in alignment with the objectives of their shareholder-principals.Footnote 41 Inherent in the term stewardship is the notion of accountability: accountability of managers in the context of the managerial stewardship theory, and accountability of institutional shareholders in the context of shareholder stewardship.Footnote 42
Shareholder stewardship was formalized in the UK Stewardship Code introduced by the FRC in 2010. However, stewardship traces can be found much earlier in the UK in the early 1990s, albeit using different nomenclature. In 1991 (one year before the landmark Cadbury Report), the ISC, a private body comprising four major institutional shareholder associations (insurance companies, pension funds, trusts and asset managers) published a statement of best practices on the responsibilities of institutional shareholders.Footnote 43 Although this ISC statement (along with its 2002, 2005 and 2007 versions) cannot be considered as thorough as subsequent stewardship codes, it is nonetheless important in the evolution of stewardship as it was the first document to define the responsibilities of institutional shareholders to use their influence as owners to ensure that the companies in which they have invested adopt good corporate governance standards. Historically, therefore, the UK was clearly the forerunner in the development of stewardship responsibilities for institutional shareholders.
To further understand the evolution of stewardship codes, Figure 30.1 distinguishes between preliminary stewardship initiatives and stewardship codes (in a narrow sense). A preliminary initiative is defined as a set of principles, standards or best practices relating to the stewardship role of institutional investors, but which is limited in its scope (for instance, it applies to a specific group of institutional investors), in its content (for instance, it refers only to voting rights) or in its drafting style (for instance, it is drafted as a policy statement or has no guidance even though it adopts a principles-based approach). This distinction is important for countries with more than one document referring to institutional shareholders’ responsibilities, such as the UK, Canada and the Netherlands. All three countries adopted a stewardship code after implementing what can be termed as first-generation principles. But some countries such as India, Switzerland and the US have still to adopt what can be characterized as a comprehensive stewardship code. In the following, we treat all forty-one documents as stewardship codes (in a wider sense).
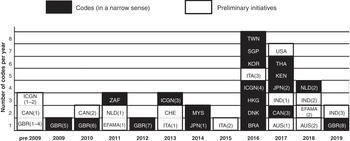
Figure 30.1 The evolution of stewardship codesFootnote 44
From the timeline, shown in Figure 30.1, it is evident that the development and adoption of stewardship norms is a recent phenomenon. Only a few countiesFootnote 45 as well the ICGN adopted codes up to 2009. Then, between 2010 and 2015, eight countries addressed shareholder stewardship through the adoption of stewardship codes or preliminary initiatives. Over the same period the UK revised its code, while EFAMA adopted a code ‘on external governance’ to provide principles and best practice for asset managers in engaging with their investee companies. The period between 2016 and 2017 marked a spike in the evolution of stewardship codes with eleven more countries adopting stewardship codes or similar initiatives (whereas in 2018 and 2019 we see only new codes in countries that already had such codes previouslyFootnote 46).
There may be various interrelated reasons explaining these developments. In the UK, for instance, the 2010 Code was adopted as a reaction to the financial crisis of 2007–08,Footnote 47 while in other countries different claims have been put forward. In Japan, shareholder stewardship was part of a broader government programme of economic liberalization and sound corporate governance.Footnote 48 In Kenya, the stewardship code, together with the preceding corporate governance code, was part of efforts to attract local and foreign investments and promote the country as the premier financial centre in central/east Africa.Footnote 49 The Indian codes are partly linked to the fragmented efforts to promote shareholder activism in India,Footnote 50 while other countries, such as Singapore, adopted stewardship codes to legitimize themselves as good standard promoters.Footnote 51 The presence of foreign institutional investors, the need to prevent the loss of investment incurred by ultimate beneficiaries, and the increasing calls for sustainability were also among the factors driving the adoption of stewardship codes.Footnote 52 Thus, using some of the terminology of the prior diffusion literature,Footnote 53 the diffusion of stewardship codes is owing to some ‘shared social constructs’ but also forms of ‘coercion’ and ‘competition’ as far as issuers follow the ‘leader’ of the stewardship movement (i.e. the UK) or one of the international codes.
It is also possible to examine the citation patterns of the forty-one stewardship codes vis-à-vis one another in order to identify traces of formal diffusion. Ten codes make specific references to foreign codes in their preambles, but in only two of them is there an explicit, visible influence by another code. All the Italian codes explicitly mention the EFAMA code as a point of reference,Footnote 54 while the Thai Code acknowledges that it ‘derives from the principles set out in the UK Stewardship Code’.Footnote 55 The UK Code is also cited as a point of reference by the Danish Code,Footnote 56 the 2013 ICGN CodeFootnote 57 and the Dutch 2011 Code which also refers to transnational developments, including the EFAMA and ICGN codes.Footnote 58 Generic references to other codes (but with no evidence of a direct influence) are also found in the SwissFootnote 59 and BrazilianFootnote 60 codes as well as the Australian 2017 Code developed by the Financial Services Council (FSC).Footnote 61
Thus, explicit comparative citation is, as expected, limited in the stewardship codes. But the absence of citation of foreign codes does not necessarily reflect the extent of foreign stewardship codes’ influence, which may be unacknowledged in the final codes or to which reference may be made at other preparatory stages of the drafting process.Footnote 62 To better assess the formal diffusion of stewardship, we now examine the language similarities among the codes.
30.3.2 Measurement of Identical Strings of Words
In a recent article, Allee and Elsig asked whether ‘the contents of international treaties [are] copied and pasted’. Specifically, they analyze preferential trade agreements, finding similarities of more than 90%.Footnote 63 In the present case, we pose a similar question for the contents of stewardship codes; yet, we also consider how far similar word patterns may be owing to deliberate copying or at least a sign of a more indirect influence.
In order to get a realistic picture of how far the language of stewardship codes overlaps, the texts of these codes have to be edited and formatted in a way that makes them comparable. Yet, this should not interfere with the substance of the texts, nor should it distort the writing style of the codes. Therefore, in this part of the analysis, we did not ‘stem’ words,Footnote 64 or replace abbreviations or other idiosyncrasies of the codes.Footnote 65
However, in order to make the texts comparable, we implemented the following adjustments. First, some of the codes are published in documents which contain further information that is not specifically related to shareholder stewardship, such as general information about the drafting body. We removed such text. Second, while the core elements of the stewardship codes are typically a number of principles together with specific explanations for each of these principles,Footnote 66 some of the codes also contain preliminary or supplementary remarks. As those additional remarks also contain meaningful information, for example, referring to the purpose of the code and providing definitions, they were generally included;Footnote 67 however, we excluded forewords by the panel chair in the codes,Footnote 68 listings of the participants of the drafting panel, and bibliographies or other lists of references. Third, given this decision, we also removed footnotes which provided mere references; we retained footnotes with substantive explanations, notably in cases where a particular statement (e.g. a definition) could have also been included in the main text of a code. Fourth, some but not all of the codes include a table of contents, and some but not all of them list the principles at the beginning and then restate them with explanations later in the text. We removed such duplicates.Footnote 69 Fifth, minor formatting was applied in order to reduce the risk of ‘false negatives’; for example, all spelling was changed to American English and all capital letters were replaced by small letters.Footnote 70
Our comparison tool is the plagiarism detection software program ‘WCopyfind’,Footnote 71 which has been used before in empirical legal studies, notably in order to detect overlaps between court opinions in the US.Footnote 72 This program allows for pairwise comparison of documents to locate similarities in the language used. The forty-one texts of the codes were uploaded in this program with the aim of identifying identical strings. Following Allee and Elsig, we set the required length of the strings at different thresholds in order to check the robustness of the results. For the main analysis that followed, we searched for strings of four or more words. This is a slightly stricter threshold than the one used for the purposes of identifying plagiarism;Footnote 73 yet, while it is clear that students need to be given the benefit of doubt, a similar line of reasoning does not apply here. Moreover, using a lower threshold had the advantage that it was possible to compare similarities between pairs of codes where a higher threshold would merely exhibit identical ‘nil results’.Footnote 74
Using this method, for example, the codes of UK 2012 and Malaysia 2014 show an overlap of 501 words. Some of them well exceed the four- or six-word thresholds. For instance, the phrase ‘signatories are encouraged to review their policy statements annually, and update them where necessary to reflect changes in actual practice. It should include contact details of an individual who can be contacted for further’ is found in both codes, with the likely explanation being that Malaysia copied this phrase from the earlier UK code. Other identical strings of words are more ambiguous: for example, both have phrases such as ‘should reflect the institutional’ and ‘how they will discharge’. A sceptic may regard such a match of words as accidental and thus possibly a ‘false positive’. Yet, there could also be cases of ‘false negatives’, for example, where a particular phrase is used in passive voice in one code and active voice in another, thus not showing a match. Overall, the measurement of common strings of words should, therefore, be seen as a parsimonious proxy for a measurement of similarity among the codes, which also needs to be carefully interpreted.Footnote 75
In the overall results, it is no surprise that the pairs of codes that overlap most are the ones from the same issuer: for example, Italy 2016 contains more than 90% of the text of Italy 2015; the same is the case for Japan 2017 and 2014, and for UK 2002, 2005 and 2007, the overlap is even above 98%. We also treat the Indian codes as deriving from the same issuer since SEBI, PFRDA and IRDAI are all regulatory bodies established by the Government of India; indeed, India (SEBI) 2019 and India (PFRDA) 2018 are very similar as the former includes 84% of the latter code.Footnote 76 Table 30.2 excludes these same-issuer ‘top’ pairs of similarities and displays only the highest ranked pair of codes of the same two issuers.Footnote 77
Table 30.2 Most similar pairs of codes by common strings
| Rank | Older code | Newer code | Common strings (in words) | All words of older code | All words of newer code | Overlap in older code | Overlap in newer code |
|---|---|---|---|---|---|---|---|
| 1 | UK 2009 | EFAMA 2011 | 561 | 1392 | 1809 | 40.30% | 31.01% |
| 2 | UK 2012 | Malaysia 2014 | 501 | 2954 | 2967 | 16.96% | 16.89% |
| 3 | ICGN 2013 | Malaysia 2014 | 411 | 7228 | 2967 | 5.69% | 13.85% |
| 4 | EFAMA 2011 | Italy 2016 | 473 | 1809 | 2615 | 26.15% | 18.09% |
| 5 | UK 2002 | Canada 2005 | 382 | 1474 | 1136 | 25.92% | 33.63% |
| 6 | UK 2012 | Hong Kong 2016 | 372 | 2954 | 2232 | 12.59% | 16.67% |
| 7 | ICGN 2016 | Kenya 2017 | 323 | 5062 | 3735 | 6.38% | 8.65% |
| 8 | Malaysia 2014 | Thailand 2017 | 298 | 2967 | 3819 | 10.04% | 7.80% |
| 9 | UK 2012 | India (IRDAI) 2017 | 284 | 2954 | 964 | 9.61% | 29.46% |
| 10 | Korea 2016 | Japan 2017 | 261 | 3231 | 4637 | 8.08% | 5.63% |
The most prominent result of Table 30.2 is that, in this top-ten list, the UK is in five instances the country of the code that has influenced a code from another issuer, with three referring to the 2012 Code and one each to the 2002 and 2009 codes, respectively. In four instances a UK code impacted the stewardship codes of common-law countries (Malaysia, Canada, Hong Kong, India), but we also see diffusion to the EFAMA 2011. It is also noteworthy that the UK Code 2012 also had an influence on the Japanese Code 2017 (UK 2012–Japan 2017 follows at rank 11 of the most similar pairsFootnote 78).
As regards the overlap between other codes, our data confirm the impact of the EFAMA on the Italian codes, which has been mentioned explicitly in the latter.Footnote 79 The impact of the ICGN Code on Malaysia and Kenya is also not surprising as developing countries often pay close attention to recommendations by international bodies.Footnote 80 Table 30.2 also reveals two other highly overlapping pairs, namely Malaysia and Thailand, and Korea and Japan. This may be regarded as plausible as they refer to neighbouring countries; yet, they require some further explanations. With regard to the Thai code, our findings seem to confirm the impact of the UK Code (as stated in the Thai Code itself), given that the Malaysian Code was itself impacted by the UK Code.Footnote 81 With regard to Korea–Japan, the direction of causality may actually be the reverse (from Japan to Korea) as there has also been a considerable impact from Japan 2014 to Korea 2016.Footnote 82
As a robustness check, we also ran WCopyfind with a higher threshold of requiring strings of six or more words. Here, the relationships among the pairs of the UK codes and EFAMA, Malaysia, Canada, Hong Kong and India retain a high number of common strings, as does the EFAMA and Italy pair.Footnote 83 For ICGN and Malaysia–Kenya, the numbers drop by a bit more than half.Footnote 84 The largest reduction in the number of overlapping strings shows for the pairs of Malaysia–Kenya and Korea–Japan,Footnote 85 thus confirming the cautious interpretation of the previous paragraph.
The codes examined here have different sizes,Footnote 86 which is bound to affect the extent of overlaps between pairs of code. Thus, Table 30.2 includes information about the percentage of common words as regards each of the two codes of each of the pairs. As expected, smaller codes have a larger overlap in terms of percentages compared to the overlap of larger codes (see e.g. the UK–India pair). Both percentages, however, need to be considered in interpreting the data. While it is clear that any influence will go in the direction of the older to the newer code, the overlap in the older code is also relevant: for example, assume that a newer code fully copied an older code while also adding further provisions, making this newer code ten times larger than the older code. Here, the overlap in the newer code is 10% – and thus apparently quite low; yet, by adding the information that the overlap in the older code is 100%, it is possible to recognize this complete copying of the older code.
30.3.3 Network and Cluster Analysis Based on Common Strings of Words
The full information about the common strings of words forms a matrix displaying the overlap of each of the forty-one codes with the other codes. Such a matrix can be visualized as a network and can be used for cluster analysis.Footnote 87 In this section we focus on the percentages of common strings per code as a measure of similarity; thus, in Figure 30.2 the codes are the ‘nodes’ of the network and the percentage similarities are the ‘ties’ between these nodes.
Figure 30.2 displays all country pairs where, at least in one direction, there is an overlap of more than 6% between the codes (see Table 30.2, applying a four-word threshold). A bold tie is used for pairs in which the 6% threshold is exceeded as regards both codes. The arrows of the ties indicate the possible diffusion from the older to the newer code. The size of each node reflects the different sizes of the codes;Footnote 88 the variations in the shapes and colours of the nodes identify all codes of the same country; and the layout of the network reflects the similarities between pairs of nodes (i.e. the position of the codes is determined by their linguistic closeness to each other).
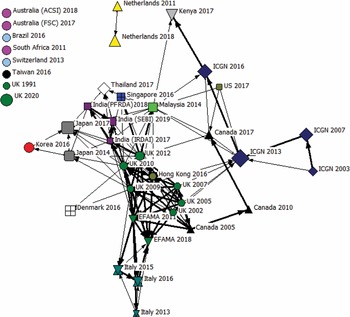
Figure 30.2 Network showing all >6 per cent overlaps of pairs of codes
Figure 30.2 shows that eight codes are not connected to any other code; in addition, the two Dutch codes are connected only to each other. Different reasons account for these isolates. To start with, it is no surprise that UK 1991, being a very preliminary initiative,Footnote 89 is unconnected to the other codes. It is not only its drafting style with the lack of explicit principles and guidance but also its content, with its sole focus on the corporate governance of investee companies identifying matters, such as the composition of the board, that should be a matter of concern to institutional shareholders, which isolates the early UK Code 1991 from subsequent codes. At the other extreme, the UK Code 2020, representing a significant departure from the UK Code 2012, is also an isolate. Being thirty-two pages long, the UK Code 2020 shifts the idea of stewardship in new directions not yet reflected in the other codes. For example, the UK Code 2020, with its extended focus comprising twelve principles aimed at asset managers and asset owners, and six principles aimed at service providers, broadens stewardship across all assets other than listed equity, and puts emphasis on reporting specific stewardship activities and outcomes rather than just stewardship policies.Footnote 90
South Africa 2011 also differs in substance from most of the other codes given its strong focus on the integration of issues of environmental, social and corporate governance (ESG) into investment management,Footnote 91 a trend, however, which has become more commonplace now.Footnote 92 As for the two Australian codes, which also differ from most of the other codes, their idiosyncratic language reflects the very particular institutional and market context in which the two codes were developed and the fact that both drafting bodies (the ASCI and the FSC) already had a well-established local tradition of policy-making and governance activism to draw on.Footnote 93 Also, in issuing their codes, both the FSC and the ACSI believed that they were taking different approaches from other stewardship codes, as reflected in the language of both codes.Footnote 94
As regards the remaining isolated countries, Brazil, the Netherlands and Taiwan have in common that their codes may have originally been written in a language other than English. Thus, it could be owing to variations of the translations into English (or possibly backward translations if some of their text was indeed translated from English) that they use a less ‘mainstream’ language. This finding is confirmed by the observation that two further non-English-speaking countries, Denmark and Korea, are only loosely connected with the main network. Exceptions are then the codes of Italy, Thailand and Japan which, even though they were presumably originally written in a language other than English, form part of the network of Figure 30.2. For the three Italian codes and the Thai one, this may be attributed to the fact that they all explicitly refer to foreign models in their codes.Footnote 95 As for the similarity between the Japanese codes and the UK ones, this should not be surprising given that Japan has a long tradition of copying business-law rules from common-law countries.Footnote 96 The high similarity between the two countries’ codes is also explained by the fact that the first version of the Japanese Code was created by way of directly translating the UK Code 2012 into Japanese for consideration by the Council of Experts.Footnote 97
The main part of the network displays the UK Code 2012 at the centre, surrounded by other English-speaking (or common-law) countries, in particular from Asia (i.e. Malaysia, Hong Kong, Singapore and India, which all enacted codes in the subsequent years). The US 2017, Kenya 2017 and Canada 2010 and 2017 codes are, however, less closely connected with this core.Footnote 98 Thus, it seems that within the group of English-speaking countries, trends for stewardship diffusion are particularly strong in Asia, but less so in other parts of the world (also noting again the outlier positions of Australia and South Africa).
Network analysis provides various tools to identify community structures.Footnote 99 Some of them rely on binary data, but for a valued network it is preferable to use tools that consider the full information of the dataset. Using such a method also has the advantage that it does not rely on a particular cut-off point (such as 6% in the network of Figure 30.1). The method applied here calculates ‘hierarchical clusters’. This refers to a procedure that divides data into subgroups ‘by successively increasing the tolerated level of within-cluster dissimilarity – (s)tarting with the lowest level of aggregation, where only identical observations are clustered together, observations and clusters are merged until the sample is allocated into two groups that constitute the top of the hierarchy’.Footnote 100
Specifically, Figure 30.3 uses hierarchical clustering of the current versions of the stewardship codes enacted by different issuers and in force in December 2019.Footnote 101 The previous versions of the codes were excluded since they are often very similar to current versions by the same issuer (and therefore would dominate the cluster analysis and make all other possible clusters disappear). Thus, a limitation of this figure, compared to the network, is that it does not include information about the older codes that had been more similar to the other codes: for example, in Figure 30.2 (as well as Table 30.2), it can be seen that EFAMA 2011 and India (IRDAI) 2017 had been closer to the UK codes than the more recent EFAMA and India codes; thus, here we observe a divergence over time from the UK 2012 model.

Figure 30.3 Hierarchical cluster of current codes
As with the network, the cluster analysis uses the percentages of common strings (in order not to reward or penalize according to the size of the codes). Yet, hierarchical clustering requires a symmetric matrix: for this reason, the data have been symmetrized averaging both sides of the matrix. These numbers showing the degree of similarity have then also been added to Figure 30.3: for example, it can be seen that Malaysia 2014 and UK 2012 are 17% similar, this being the average of the percentage numbers reported in Table 30.2.
In substance, the clusters based on low similarities of 3% or less should best be disregarded. Considering the codes only connected through such low-ranked scores, this includes all the isolated nodes of the network of Figure 30.2. Figure 30.3 shows that the main clusters are the ones of the UK and the Asian common-law countries (Malaysia, Hong Kong and Singapore), thus here too confirming the network of Figure 30.2. This is then followed by Thailand 2017, and then subsequently India (SEBI) 2019, EFAMA 2018 and Italy 2016 (which also form a cluster), and then Japan 2017 and Korea 2016 (also a separate cluster).
A further way of analyzing the position of codes within the network is to examine the ‘coreness’ of each node,Footnote 102 using the same information about current codes as in the cluster analysis performed already. Here, the UK 2012 has the highest value of coreness, followed by Malaysia 2014, Hong Kong 2016, EFAMA 2018 and Thailand 2017. At the other end, or at the periphery of the network, are South Africa 2011, Brazil 2016, Switzerland 2013, Taiwan 2016 and Australia (FSC) 2017.Footnote 103
Overall, both the cluster analysis and the coreness of each node point again at the central position of the UK Code 2012 in the stewardship network, at the same time as they show that stewardship diffusion took place among common-law Asian countries. In addition, it confirms the similarities between Italy and EFAMA and between Korea and Japan. To further understand the diffusion processes of stewardship, we now turn to analyze the substantive orientation of the principles of the codes.
30.4 Diffusion of UK-Style Stewardship Principles
30.4.1 The Principles of the UK 2012 Code across the World
One of the key findings of our content analysis so far has been the coreness of the UK Code 2012 in the stewardship network and the language similarities between the UK Code 2012 and the codes of Asian common-law countries. To further test the impact of the UK Code 2012 on the text of other codes, we used a set of words that are good ‘markers’ for each of the seven principles of this code (see Table 30.3) and then counted how often these words are mentioned in each of the forty-one codes. The choice to focus on the seven principles of the UK Code 2012 is reflective of the UK-inspired principles-based approach to corporate governance and stewardship that motivated many to talk about the ‘the seven magic stewardship principles’.Footnote 104
Table 30.3 ‘Marker’ words for the principles of the UK Code 2012
| Principle | Word | |
|---|---|---|
| 1 | Institutional investors should publicly disclose their policy on how they will discharge their stewardship responsibilities. | disclos |
| 2 | Institutional investors should have a robust policy on managing conflicts of interest in relation to stewardship which should be publicly disclosed. | conflict |
| 3 | Institutional investors should monitor their investee companies. | monitor |
| 4 | Institutional investor should establish clear guidelines on when and how they will escalate their stewardship activities. | escal |
| 5 | Institutional investors should be willing to act collectively with other investors where appropriate. | collect |
| 6 | Institutional investors should have a clear policy on voting and disclosure of voting activity. | vote |
| 7 | Institutional investors should report periodically on their stewardship and voting activities. | report |
To calculate the frequencies, we first removed all stop-words and decomposed all the words in the corpus into their roots,Footnote 105 by applying Porter’s stemming method.Footnote 106 The analysis presented in Section 30.3 included the recitals and some other preliminary information; by contrast, the present analysis focuses only on the principles-related text of the codes, that is, the core principles of each code and the accompanying text (guidance, recommendations or related commentary).Footnote 107
The most common marker word in the UK Code 2012 is discl (14 times), followed by vote (11 times), while the least common one is escal (2 times). Looking at all the codes, vote is the most common word marker (679 times) followed by discl (369 times), while escal is the least common (61 times). To some extent, such differences may reflect that some of the marker words (such as vote) are of a more general nature while others are more specific. Yet, we suggest that they reflect differences in substance. Voting is considered an essential aspect of stewardship activities and the exercise of voting rights is a key expression of shareholders’ rights and recognition of shareholders’ responsibilities. On the other hand, while Principle 4 of the UK Code 2012 asks that the investors establish clear processes on escalating their stewardship activities, especially when there are concerns about risks to long-term value, escalating engagement (for instance, through voting against managerial resolutions, requesting a general meeting, or proposing changes to board membership) is not advocated by seventeen other codes which adopt a more consensus-style language.
Figure 30.4 presents the results in detail in chronological order. A common feature of all stewardship codes is that investors are expected to disclose information about their stewardship policy along with other policies (including conflicts of interests and voting). Out of the forty-one codes examined, India (SEBI) 2019, Australia (ACSI) 2018 and UK 2012 are the three codes that refer most frequently to disclosure obligations, while the Malaysian, Taiwanese and the first two Indian (IRDAI 2017 and PFRDA 2018) codes also have very close frequencies to the UK Code 2012, adding more evidence to the earlier Asian common-law cluster.Footnote 108 Interestingly, earlier stewardship initiatives, including the first four versions of the UK Code, the two first Canadian codes, EFAMA 2011 and the first two Italian codes, make less reference to disclosure. Stewardship codes, similar to corporate governance codes, are disclosure-based regulatory mechanisms which rely on transparency to encourage good stewardship practices. One would therefore expect that codes that emphasize disclosure would also emphasize reporting requirements (i.e. report). Indeed, India (IRDAI) 2017, which is the code with the most frequent reference to reporting requirements, also makes frequent references to disclosure. The UK Code 2012 itself also frequently refers to both disclosure and reporting obligations. However, earlier codes, such as UK 2002, 2005 and 2007 as well as Canada 2005, seem to emphasize reporting rather than disclosure. An exception here is the UK Code 2020 which, despite being the most recent code, makes more frequent reference to reporting rather than disclosure obligations, perhaps because of its unique emphasis on the investment side of stewardship and the duties of institutional investors to their clients and beneficiaries.Footnote 109 But, overall, Figure 30.4 shows that disclos became more frequent only much later in 2012 or so and this may indicate a stronger emphasis on public disclosure.Footnote 110
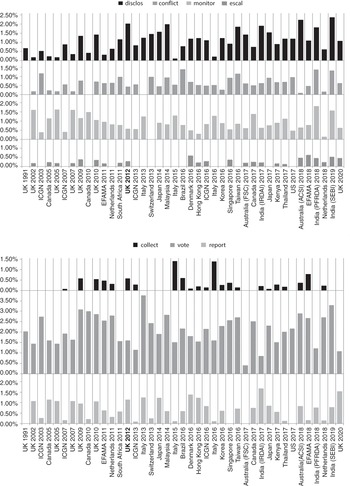
Figure 30.4 Relative frequencies of seven stewardship principles
All but three codes (UK 1991, Canada 2010 and Italy 2013) include a principle relating to how institutional investors manage conflicts of interests that may affect their stewardship activities. In general, conflict appears less frequently in most codes,Footnote 111 perhaps owing to its nature of acting as support for the overarching stewardship policy.
Monitoring of investee companies is recognized as an essential part of shareholder stewardship and all codes (except the very first UK Code and the Swiss one) mention the word monitor at least once. Monitoring includes both informal and formal activities, ranging from dialogue to attending annual general meetings. Despite the widely accepted merits of shareholder monitoring, the UK Code 2012 mentions monitor less frequently compared to all the earlier versions of the code (except the 1991 one). This suggests a gradual shift from a monolithic, corporate governance-inspired view of stewardship as a corporate governance tool of shareholder discipline to a more holistic approach to the responsibilities of equity-owning institutional investors,Footnote 112 and is associated with a movement away (at least in the UK) from stewardship as solely focusing on shareholder engagement.Footnote 113 But this untangling of stewardship from shareholder monitoring and engagement is not taking place outside the UK. Rather, the two more recent Indian codes (i.e. India (PRFDA) 2018 and India (SEBI) 2019) make more frequent reference to monitor compared to the earlier India (IRDAI) 2017 Code.
Associated with this trend is the fact that escal (the word marker for escal-ation, escal-ate) is the least frequent word across all the codes. This refers to a set of best practices for when and how investors might take action when their monitoring or engagement reveals concerns about a company that are not appropriately addressed by its management. The UK Code 2012 ranks tenth, while EFAMA 2018 makes the most frequent reference to this principle, followed by Denmark and India (SEBI) 2019. Seventeen codes, including the earlier EFAMA Code, all the Italian codes, the two Japanese codes and the Korean and Malaysian codes, make no reference to the word escal. This is owing to the way in which escalation of shareholder engagement and more aggressive forms of shareholder activism are perceived by different local markets. The Japanese codes, for instance, adopt a gentler language emphasizing ‘constructive engagement’ and dialogue, reflecting perhaps the ‘internalist’, ‘firm-centric’ focus of the alternative Japanese conception of the company as an organization or ‘community’.Footnote 114
Collect, the word marker for Principle 5 of the UK Code 2012, is also not well-perceived across the various codes. Eighteen codes, including all the Canadian codes, the four earlier versions of the UK Code, the 2014 version of the Japanese Code, the two latest India codes and the UK Code 2020, do not make any reference to shareholder collective action.Footnote 115 Similar to escalating activity, many codes prefer not to endorse collective engagement by institutional investors (there are eight codes that do not include either of these two word markers). However, it is interesting to note that, unlike the relatively low frequencies of escal across all codes, the most recent Italian codes mention collect thirteen times each. This emphasis on shareholder collective action in the Italian context is not surprising if one considers the strategic role of Assogestioni, the issuer of the Italian stewardship principles, in facilitating collective engagement by institutional shareholders especially in relation to the appointment of a minority of the members of the management and the statutory auditors’ boards.Footnote 116 Outpaced only by Italy 2015 and Italy 2016, EFAMA 2018 also refers to collect very often, which adds further support to the cluster identified above.Footnote 117
Finally, all forty-one codes, following Principle 5 of the UK Code 2012, require institutional investors to develop a policy for voting. Among the codes that mention vote most frequently are Italy 2013, India (SEBI) 2019, UK 2009, Canada 2010 and Australia (ACSI) 2018. While vote is the most frequent word marker in the UK Code 2012 itself, vote is mentioned more frequently in some of the previous versions of the code (that is, the 2009, 2010, 1991 and 2007 versions), and the UK Code 2012 ranks thirtieth in the frequency of this word marker. Interestingly, even though the importance attributed to the exercise of voting rights by institutional investors is such that there is no single code that does not mention the word vote at least once, it seems that more recent stewardship codes, such as the UK Code 2020, place less emphasis on voting perhaps because of their expansive scope. But on the antipode is the India (SEBI) 2019 Code, which makes the second most frequent reference to vote after the Italian 2013 Code. This may be striking as the other two Indian codes (i.e. India (PRFDA) 2018 and India (IRDAI) 2017) rank thirty-seventh and forty-first in the frequency of the word marker vote, although this may be explained by the detailed guidance provided by the latest Indian code in relation to Principle 5 on voting policy and disclosure.Footnote 118
30.4.2 Understanding the Diffusion Patterns
Our findings so far have revealed different diffusion patterns for the seven key principles of the UK Code 2012. To understand these patterns, we now take into account a select number of possible explanatory categories related to both the characteristics of the codes and the country of the code (thus, for the latter we excluded the ICGN and EFAMA codes). Table 30.4 contains an overview of the categories; the precise coding is available in Table 30.9 in the Annex.Footnote 119
| Category | Explanation | Source |
|---|---|---|
| Type of issuer | Private (1) or public (0) issuer. ‘Public’ is assumed if the issuer was composed entirely of persons representing the state (including state-owned entities) | Own coding |
| Other languages | Codes that have also been published in another language (1); otherwise (0) | Own coding |
| Nature of code | Code (1) or preliminary initiative (0), see Section 30.3.1 for details | Own coding |
| Enforcement mode | Categorical variable with (0) for codes of an entirely voluntary nature, (1) for codes following a ‘comply or explain’ approach and (2) for codes that have a mandatory element for a specific group of investors | Own coding |
| Legal family | Common law (1) or civil law (0), as defined in the comparative private law | Own coding |
| Global financial centre | Countries with cities that feature in the top 20 global financial centres (1); otherwise (0) | Long financeFootnote 120 |
First, stewardship codes around the world emanate from different issuers, and this can influence the content and innovation of a code. Even though the codes’ issuers can be classified into alternative categories,Footnote 121 we divide the stewardship codes into two groups based on the type of issuer: public ones where the code’s issuer is entirely composed of regulators or quasi-regulators and committees acting on behalf of the state, including state-owned entities;Footnote 122 and private ones which are initiated by entirely private industry participants, investor-related groups or associations and international organizations. The UK is the only country where the type of issuer has shifted over time, but in other countries many issuers coexist at the same time.Footnote 123
Next, we take into account whether the code has also been published in a language other than English. Owing to our focus on linguistic diffusion, it is possible that such codes may use different words than the ones only written and published in English. A similar way of presenting this criterion may be whether English is the original or the translated language of a code. Yet, it cannot be excluded that in some of the non-Anglophone countries, the two language versions of the code were co-drafted,Footnote 124 given that international (and Anglophone) investors are often the main audience of these codes. Thus, while it is possible that this criterion plays a role, it may also be the case that the unknown drafting history, as well as unknown differences in the mode of any translation,Footnote 125 influence any linguistic differences between these two groups of codes.
We also hypothesize that the nature and the enforcement mode of the codes are, in most instances, decided before the drafting of substantive details (reflected in the word patterns). Thus, we distinguish between preliminary initiatives and codes based on the three previously mentioned criteria (drafting style, content and scope), as explained earlier.Footnote 126 With respect to the enforcement mode,Footnote 127 even though stewardship codes, similar to corporate governance codes, are in general non-binding and fall into the category of soft rather than hard law, they vary in terms of their coerciveness.Footnote 128 Some codes, such as Brazil 2016 or Canada 2017, are completely voluntary, while others, such as Taiwan 2016 and Japan 2017, adopt the ‘comply-or-explain’ approach and have more coercive implications than traditional regulatory theories suggest. Other codes have different elements of coerciveness but equally cannot be flouted without consequences: for instance, India (SEBI) 2019 is mandatory for its members; the comply-or-explain approach of UK 2012 is mandatory for FCA-authorized asset managers; while UK 2020 adopts an ‘apply and explain’ approach, also on a mandatory basis for FCA-authorized asset managers.Footnote 129
For the country-specific codes, we also divide them into civil-law and common-law countries, given that legal families can be a possible source of policy diffusion.Footnote 130 We use the mainstream classification of the comparative private law scholarship;Footnote 131 thus, for example, Japan has been classified as a civil-law country, despite having also been influenced by US law in some fields. This criterion largely matches the previous one given that all codes that have also been published in a language other than English are the codes of civil-law countries. Yet, it excludes the non-country-specific codes (i.e. the ICGN and EFAMA codes). Finally, for the country-specific codes, we classify countries as having one or more cities that feature in the top twenty global financial centres, given that pressure by institutional investors may have shaped the language and substantive orientation of these codes.
Next, we aim to determine whether there is a significant difference between the means of any two groups by calculating t-test statistics for the six explanatory categories (Table 30.5).Footnote 132 The observations are for the codes enacted after the UK Code 2012; if the same issuer has enacted more than one code, we use the most recent code (relevant for Italy, Japan and ICGN), given that codes by the same issuer would not be independent of each other;Footnote 133 thus, the overall number of observations is twenty-one. Given this low number of observations (as well as the possible endogenous nature of some of the variables), we cannot claim that the subsequent findings are of a causal nature; yet, they do show some interesting patterns.
Table 30.5 Tests of group differences between post-2012 codes
| Keywords | Group category | Difference and means | p-value and significance levelFootnote 134 |
|---|---|---|---|
| Disclos | Type of issuer | Public > private (0.0151 vs. 0.0110) | 0.0853* |
| Conflict | Type of issuer | Public > private (0.0085 vs. 0.0058) | 0.0844* |
| Monitor | Enforcement | Mandatory > others (0.0110 vs. 0.0070) | 0.0840* |
| Escal | Other language | No > Yes (0.0028 vs. 0.0010) | 0.0660* |
| Collect | [none] | ||
| Vote | [none] | ||
| Report | Type of issuer | Public > private (0.0080 vs. 0.0039) | 0.0490** |
Table 30.5 shows that none of the six explanatory categories can explain the differences across the codes in the use of the words collect and vote. The type of the issuer has an impact on the frequency of the words disclos, conflict and report: we find that codes issued by public bodies focus more on stewardship-related disclosure, conflicts of interests, and reporting requirements. For the disclosure and reporting requirements, this may be owing to the fact that public issuers, part of whose role is to improve the business environment and encourage good stewardship activities, are paying increasing attention to disclosure and transparency and may consider such codes within their enforcement activities even if they do not have the means to effectively enforce any disregard of the disclosure and reporting obligations.Footnote 135 For conflict, it is less clear why this variable is significant; possibly, it may be owing to the fact that public authorities have a particularly strong interest in preventing conflict of interests. More generally, it can be noted that the type of the issuer is the variable with the most impact, probably because public issuers are more likely to copy the already established UK Code 2012 (also having been developed by a public issuer).
The word monitor is more often used in codes that have a mandatory element. This may be owing to the emphasis of such codes on engagement activities, but it is also likely that this is owing to the diffusion of the monitoring norm from the UK coercive code to other similarly coercive codes, prominently in India and Australia. Finally, escalation is found more often in codes only available in English, possibly since ‘escalate’ is an English term less commonly used than the other words, and, thus, non-native speakers (or translators) may tend to avoid it.
It is also noteworthy that the categories about the nature of the code, legal families and the global financial centre are insignificant for any of the marker words: thus, to phrase it in a positive way, it cannot be said that the diffusion of stewardship principles is obstructed by the diverse nature of a code, the civil-/common-law divide or the diversity of financial centrality.
30.4.3 Is the UK a Stewardship Exporter?
Section 30.4.2 observed that the UK principles relating to escalation activities and collection action seem to have travelled less successfully compared to the other principles of the UK Code 2012. It is the aim of this section to explore in more detail whether, based on the seven marker words, the UK can be considered a stewardship exporter.
Table 30.6 sheds light on this question by presenting the differences in coverage of the seven marker words between the UK Code 2012 and its twenty-two subsequent counterpart codes.Footnote 136 It divides the frequencies (see Figure 30.4) into three categories that provide a comparison to the UK Code 2012. The highest category (>90%) refers to instances where there is strong evidence of UK influence; the intermediate category (50–90%) refers to instances where some influence may be assumed; while the final category (<50%) shows cases of little influence.
Table 30.6 Coverage of principles at a level equivalent to the UK Code 2012
| disclos | conflict | monitor | escal | collect | vote | report |
|---|---|---|---|---|---|---|
| Brazil 2016 | Australia (ACSI) 2018 | Netherlands 2018 | Brazil 2016 | Australia (FSC) 2017 | Australia (FSC) 2017 | Australia (FSC) 2017 |
| Canada 2017 | Netherlands 2018 | Switzerland 2013 | Italy 2016 | Canada 2017 | India (IRDAI) 2017 | EFAMA 2018 |
| Italy 2016 | Korea2016 | Denmark 2016 | Japan 2017 | Denmark 2016 | India (PFRDA) 2018 | Italy 2016 |
| Kenya 2017 | Australia (FSC) 2017 | Hong Kong 2016 | Korea2016 | Hong Kong 2016 | US 2017 | Kenya 2017 |
| Netherlands 2018 | Brazil 2016 | US 2017 | Malaysia 2014 | ICGN 2016 | Australia (ACSI) 2018 | Netherlands 2018 |
| Singapore 2016 | Canada 2017 | Australia (ACSI) 2018 | Switzerland 2013 | India (IRDAI) 2017 | Brazil 2016 | Singapore 2016 |
| Australia (FSC) 2017 | Denmark 2016 | Australia (FSC) 2017 | Taiwan 2016 | India (PFRDA) 2018 | Canada 2017 | Switzerland 2013 |
| Denmark 2016 | EFAMA 2018 | Brazil 2016 | Australia (FSC) 2017 | India (SEBI) 2019 | Denmark 2016 | Thailand 2017 |
| EFAMA 2018 | Hong Kong 2016 | Canada 2017 | Canada 2017 | Japan 2017 | EFAMA 2018 | Australia (ACSI) 2018 |
| Hong Kong 2016 | ICGN 2016 | EFAMA 2018 | Hong Kong 2016 | Kenya 2017 | Hong Kong 2016 | Brazil 2016 |
| ICGN 2016 | India (IRDAI) 2017 | ICGN 2016 | India (IRDAI) 2017 | Korea2016 | India (SEBI) 2019 | Canada 2017 |
| Japan 2017 | India (PFRDA) 2018 | India (IRDAI) 2017 | Kenya 2017 | Malaysia 2014 | ICGN 2016 | ICGN 2016 |
| Korea 2016 | India (SEBI) 2019 | India (PFRDA) 2018 | Netherlands 2018 | Netherlands 2018 | Italy 2016 | India (PFRDA) 2018 |
| Switzerland 2013 | Italy 2016 | India (SEBI) 2019 | Thailand 2017 | Switzerland 2013 | Japan 2017 | India (SEBI) 2019 |
| Taiwan 2016 | Japan 2017 | Italy 2016 | Australia (ACSI) 2018 | Taiwan 2016 | Kenya 2017 | Japan 2017 |
| Thailand 2017 | Kenya 2017 | Japan 2017 | Denmark 2016 | Thailand 2017 | Korea2016 | Korea2016 |
| US 2017 | Malaysia 2014 | Kenya 2017 | EFAMA 2018 | US 2017 | Malaysia 2014 | Malaysia 2014 |
| Australia (ACSI) 2018 | Singapore 2016 | Korea2016 | ICGN 2016 | Australia (ACSI) 2018 | Netherlands 2018 | Taiwan 2016 |
| India (IRDAI) 2017 | Switzerland 2013 | Malaysia 2014 | India (PFRDA) 2018 | Singapore 2016 | Singapore 2016 | Denmark 2016 |
| India (PFRDA) 2018 | Taiwan 2016 | Singapore 2016 | India (SEBI) 2019 | Brazil 2016 | Switzerland 2013 | Hong Kong 2016 |
| India (SEBI) 2019 | Thailand 2017 | Taiwan 2016 | Singapore 2016 | EFAMA 2018 | Taiwan 2016 | India (IRDAI) 2017 |
| Malaysia 2014 | US 2017 | Thailand 2017 | US 2017 | Italy 2016 | Thailand 2017 | US 2017 |
Shadings refer to: >90% 50–90% <50%
It can be seen that conflict, monitor and vote are the categories where the UK influence has been pronounced for all but a few codes. For disclos, escal and report, the evidence of UK influence is mixed,Footnote 137 while least influence is noticeable for collect. This suggests that, while facilitating collective engagement by institutional investors has been championed by UK policymakers, expanding the opportunities for collective action has not been promoted by other stewardship codes, especially those developed in countries where public companies are dominated by family or state ownership, such as Hong Kong and Malaysia, or by ‘silent’ shareholders with distaste for confrontation and criticism, such as potentially in Japan.Footnote 138Footnote 139
Next, we calculate the overall similarity of the twenty-one (subsequent) codes to the UK Code 2012. The ranking of Table 30.7 is based on the difference between the UK Code 2012 and the other codes in each of the categories. For the purposes of the ranking, a code that is more than 100% similar to the UK one (because it refers to a particular principle more often) is capped at this number (i.e. it is not rewarded or penalized). For purposes of comparison, Table 30.7 also includes the ranking of the similarity to the UK Code 2012 based on the similarity of strings. Both rankings are moderately correlated.Footnote 140
| Rank | Average similarity for keywords | Comparison: similarity to UK Code based on similarity of stringsFootnote 139 | |
|---|---|---|---|
| 1 | India (SEBI) 2019 | 81.17% | 7.38% (rank 6) |
| 2 | EFAMA 2018 | 81.11% | 9.20% (rank 4) |
| 3 | Denmark 2016 | 80.39% | 5.93% (rank 10) |
| 4 | Australia (ACSI) 2018 | 79.74% | 5.10% (rank 11) |
| 5 | India (IRDAI) 2017 | 79.51% | 19.46% (rank 1) |
| 6 | ICGN 2016 | 78.09% | 3.65% (rank 14) |
| 7 | India (PFRDA) 2018 | 76.15% | 7.01% (rank 7) |
| 8 | Hong Kong 2016 | 74.16% | 14.43% (rank 3) |
| 9 | Singapore 2016 | 72.02% | 8.34% (rank 5) |
| 10 | Kenya 2017 | 70.70% | 3.77% (rank 13) |
| 11 | Brazil 2016 | 70.03% | 2.99% (rank 17) |
| 12 | Canada 2017 | 69.91% | 6.32% (rank 9) |
| 12 | Taiwan 2016 | 68.22% | 1.74% (rank 21) |
| 14 | Japan 2017 | 66.08% | 6.93% (rank 8) |
| 15 | Malaysia 2014 | 64.22% | 16.77% (rank 2) |
| 16 | Thailand 2017 | 63.77% | 5.30% (rank 11) |
| 17 | Korea 2016 | 60.15% | 3.32% (rank 15) |
| 18 | Italy 2016 | 59.96% | 2.20% (rank 20) |
| 19 | Australia (FSC) 2017 | 52.48% | 1.15% (rank 22) |
| 20 | US 2017 | 48.91% | 2.78% (rank 18) |
| 21 | Netherlands 2018 | 46.54% | 3.05% (rank 15) |
| 22 | Switzerland 2013 | 41.80% | 2.67% (rank 18) |
Both EFAMA 2018 and ICGN 2016 rank highly, perhaps because transnational codes tend to provide an overarching model for best corporate governance practices. From the country-specific codes, the India (SEBI) 2019 Code appears to be the most similar to the UK Code 2012, followed by EFAMA 2018 and the Danish Code. The two other Indian codes, the Singapore and the Hong Kong codes also rank highly, confirming the earlier findings about the similarities in the content between these codes and the UK Code.Footnote 141 From the top-ranked codes, the similarity between the Danish and the UK 2012 codes may surprise the reader, especially since the language used by the Danish Code (based on the similarity of strings) is not so similar to that of the UK Code 2012.Footnote 142 But this textual disparity may be attributed to the translation process, and the similarity of the Danish principles to those in the UK Code 2012 aligns with the fact that the Danish Code explicitly cites the UK Code.Footnote 143 A further key disparity concerns the Malaysian Code, which, even though it is drafted in a way similar to the UK Code 2012, ranks only fifteenth when it comes to the specific principles, mainly because the principles of escalating activity and shareholder collective action have not been adopted. The US, Dutch and Swiss codes are the codes that were influenced the least by the UK stewardship principles. The Dutch Code, for instance, has eleven principles, among which are principles on communicating with relevant stakeholders and not borrowing shares, both of which are absent from the UK Code 2012.
Finally, we calculate the t-test statistics for all the six explanatory categories of Table 30.5 with the aim of determining whether the ranking of Table 30.7 exhibits significant group differences.Footnote 144 We find that only the nature of the issuer and the availability in a language other than English are significant at the 10% level (p = 0.0690 and 0.0820). Public issuers have a higher mean similarity (72.02%) than private issuers (62.61%). This may be owing to the fact that public issuers around the world are more likely to draft codes on the basis of pre-existing public codes, while private codes may be more irregular as they are shaped by diverse types of issuer. Codes not available in another language (in other words, the codes of the Anglophone countries and the ICGN and EFAMA codes) have a higher mean of similarity (71.00%) compared to the other codes (61.88%), plausibly because some of the translated codes may use linguistically different terms. All the other categories cannot explain the diffusion patterns. This is in line with our previous findings and confirms that neither the divide between legal families (i.e. between common and civil law jurisdictions) nor the divide between financial centres and periphery can be said to have promoted or obstructed the diffusion of stewardship principles.
30.5 Conclusion
We confirm in this chapter a conclusion made many times in this handbook: within a mere decade of the introduction of the first UK stewardship code, shareholder stewardship has rapidly become a popular concept among policymakers, private standard-setters, companies and investors around the globe. Employing the method of content analysis and using information from forty-one stewardship codes,Footnote 145 this chapter has shown that there is in reality both uniformity and diversity among these codes.Footnote 146
Three of our main findings are as follows: first, while some overall formal (textual) diffusion can be observed especially among former British colonies in Asia, stewardship has travelled in non-linear ways and has often been vernacularized or adapted to local contexts.Footnote 147 For instance, Japan has adopted a ‘milder and more nuanced’ version of the UK Code 2012. While the English version of the Japanese Code uses the same word ‘monitor’, the original Japanese version requests investors to ‘properly grasp the circumstances of investee companies’.Footnote 148
Second, even though diffusion processes are too varied and complex to be reduced to a direct one-way transfer,Footnote 149 among the seven key stewardship principles of the UK Code, most of them have diffused widely, while the principles on escalating engagement activities and collective action are the least travelled. Our findings also support the claims about the way in which UK-originated norms have been renegotiated at the local context, with the possibility of ‘faux convergence’.Footnote 150 In other words, even when codes are drafted in a similar way to the ‘good’ UK stewardship standards, as is the case of the Malaysian and Singapore codes, it is done on a superficial level, often omitting key UK stewardship principles.
Third, there is no strong legal family effect on the diffusion patterns. While we find support for the diffusion of the UK stewardship model to common-law countries in Asia, we also find (i) evidence of diffusion from the UK to a number of civil-law countries (notably Japan and Denmark); (ii) impact of the transnational EFAMA and ICGN codes on a number of codes (notably Italy, Malaysia and Kenya); (iii) a regional cluster in Asia across the legal family divide (namely with Thailand, Japan and Korea showing some similarity to the common-law countries); as well as (iv) some idiosyncratic results (e.g. the US and one of the Australian codes being very different from the UK model). Thus, as in other fields of business law,Footnote 151 conventional paradigms such as the legal family divide seem to be weakening.
Following on from these findings, future research could further enhance our understanding of diffusion in the area of stewardship norms. From a technical perspective, the text of the codes could be analyzed with further tools,Footnote 152 and it may also be possible to consider the non-English-language versions of the codes.Footnote 153 From a broader perspective, future research could follow the insight that stewardship may mean something different for different types of company and investor. For example, the practice of stewardship at the firm level may be analyzed to see how differences in shareholder ownership structure impact the application of the stewardship codes.Footnote 154 As Singapore has enacted a separate stewardship code for family businesses,Footnote 155 and as there is also soft law for sovereign wealth funds,Footnote 156 it may also be suggested that a ‘one-size-fits-all’ model of stewardship may not be the right way forward.
Finally, the dominant current models may also be subject to change and thus a topic of future research. The transposition of the EU’s Shareholder Rights Directive (SRD) II is likely to have an impact on the operability of national stewardship codes in Europe.Footnote 157 Furthermore, as the UK Code 2020 has come into force, it is conceivable that future research may want to track a possible second round of exportation of the revised UK model into the transnational arena.Footnote 158 Hence, we expect that, while the future of stewardship norms and practices is not perfectly predictable and diffusion involves various actors, local contexts and complex pathways, stewardship norms and practices will continue to travel globally.
30.6 Annex
| Abbreviated name of codeFootnote 159 | Full text (in words)Footnote 160 | Principles and specific guidance only (in words)Footnote 161 | As previous column but excluding stopwordsFootnote 162 |
|---|---|---|---|
| Australia (ACSI) 2018 | 2964 | 1721 | 1074 |
| Australia (FSC) 2017 | 2640 | 836 | 488 |
| Brazil 2016 | 2184 | 924 | 506 |
| Canada 2005 | 1136 | 762 | 436 |
| Canada 2010 | 1176 | 778 | 466 |
| Canada 2017 | 1984 | 1348 | 795 |
| Denmark 2016 | 3044 | 1776 | 1001 |
| EFAMA 2011 | 1809 | 1104 | 629 |
| EFAMA 2018 | 2254 | 1110 | 637 |
| Hong Kong 2016 | 2232 | 1810 | 968 |
| ICGN 2003 | 1942 | 1424 | 769 |
| ICGN 2007 | 4665 | 2348 | 1244 |
| ICGN 2013 | 7228 | 3969 | 2167 |
| ICGN 2016 | 5062 | 2452 | 1441 |
| India (IRDAI) 2017 | 964 | 906 | 473 |
| India (PFRDA) 2018 | 1413 | 1129 | 655 |
| India (SEBI) 2019 | 1696 | 1371 | 760 |
| Italy 2013 | 984 | 121 | 80 |
| Italy 2015 | 2596 | 1583 | 924 |
| Italy 2016 | 2615 | 1615 | 937 |
| Japan 2014 | 3362 | 1590 | 888 |
| Japan 2017 | 4637 | 2285 | 1298 |
| Kenya 2017 | 3735 | 2926 | 1780 |
| Korea 2016 | 3231 | 1921 | 1133 |
| Malaysia 2014 | 2967 | 1498 | 850 |
| Netherlands 2011 | 2583 | 1079 | 611 |
| Netherlands 2018 | 3709 | 2220 | 1297 |
| Singapore 2016 | 1828 | 952 | 544 |
| South Africa 2011 | 2406 | 982 | 512 |
| Switzerland 2013 | 1943 | 733 | 413 |
| Taiwan 2016 | 2146 | 1220 | 702 |
| Thailand 2017 | 3819 | 2666 | 1585 |
| UK 1991 | 1474 | 261 | 148 |
| UK 2002 | 1462 | 1001 | 558 |
| UK 2005 | 1465 | 985 | 552 |
| UK 2007 | 1392 | 989 | 554 |
| UK 2009 | 1504 | 962 | 518 |
| UK 2010 | 1908 | 1041 | 560 |
| UK 2012 | 2954 | 1264 | 691 |
| UK 2020 | 4331 | 3016 | 1755 |
| US 2017 | 714 | 704 | 416 |
Table 30.9 Coding of explanatory categories for diffusionFootnote 163
| Abbreviated name of codeFootnote 164 | Type of issuer | Nature of code | Enforcement mode | Other languages | Legal family | Global financial centre |
|---|---|---|---|---|---|---|
| Australia (ACSI) 2018 | 1 | 0 | 0 | 0 | 1 | 1 |
| Australia (FSC) 2017 | 1 | 0 | 2 | 0 | 1 | 1 |
| Brazil 2016 | 1 | 1 | 0 | 1 | 0 | 0 |
| Canada 2005 | 1 | 0 | 0 | 0 | 1 | 1 |
| Canada 2010 | 1 | 0 | 0 | 0 | 1 | 1 |
| Canada 2017 | 1 | 1 | 0 | 0 | 1 | 1 |
| Denmark 2016 | 0 | 1 | 1 | 1 | 0 | 0 |
| EFAMA 2011 | 1 | 0 | 0 | 0 | n.a. | n.a. |
| EFAMA 2018 | 1 | 0 | 1 | 0 | n.a. | n.a. |
| Hong Kong 2016 | 0 | 1 | 1 | 0 | 1 | 1 |
| ICGN 2003 | 1 | 0 | 0 | 0 | n.a. | n.a. |
| ICGN 2007 | 1 | 0 | 0 | 0 | n.a. | n.a. |
| ICGN 2013 | 1 | 1 | 0 | 0 | n.a. | n.a. |
| ICGN 2016 | 1 | 1 | 0 | 0 | n.a. | n.a. |
| India (IRDAI) 2017 | 0 | 0 | 1 | 0 | 1 | 0 |
| India (PFRDA) 2018 | 0 | 0 | 2 | 0 | 1 | 0 |
| India (SEBI) 2019 | 0 | 0 | 2 | 0 | 1 | 0 |
| Italy 2013 | 1 | 0 | 0 | 1 | 0 | 0 |
| Italy 2015 | 1 | 0 | 1 | 1 | 0 | 0 |
| Italy 2016 | 1 | 0 | 1 | 1 | 0 | 0 |
| Japan 2014 | 0 | 1 | 1 | 1 | 0 | 1 |
| Japan 2017 | 0 | 1 | 1 | 1 | 0 | 1 |
| Kenya 2017 | 0 | 1 | 1 | 0 | 1 | 1 |
| Korea 2016 | 1 | 1 | 1 | 1 | 0 | 0 |
| Malaysia 2014 | 0 | 1 | 0 | 0 | 1 | 0 |
| Netherlands 2011 | 1 | 0 | 1 | 1 | 0 | 0 |
| Netherlands 2018 | 1 | 1 | 1 | 1 | 0 | 0 |
| Singapore 2016 | 0 | 1 | 0 | 0 | 1 | 1 |
| South Africa 2011 | 1 | 1 | 1 | 0 | 1 | 0 |
| Switzerland 2013 | 1 | 0 | 1 | 1 | 0 | 1 |
| Taiwan 2016 | 0 | 1 | 1 | 1 | 0 | 0 |
| Thailand 2017 | 0 | 1 | 2 | 1 | 0 | 0 |
| UK 1991 | 1 | 0 | 0 | 0 | 1 | 1 |
| UK 2002 | 1 | 0 | 0 | 0 | 1 | 1 |
| UK 2005 | 1 | 0 | 0 | 0 | 1 | 1 |
| UK 2007 | 1 | 0 | 0 | 0 | 1 | 1 |
| UK 2009 | 1 | 1 | 1 | 0 | 1 | 1 |
| UK 2010 | 0 | 1 | 1 | 0 | 1 | 1 |
| UK 2012 | 0 | 1 | 2 | 0 | 1 | 1 |
| UK 2020 | 0 | 1 | 2 | 0 | 1 | 1 |
| US 2017 | 1 | 0 | 0 | 0 | 1 | 1 |


