


1. INTRODUCTION
The currently accepted explanation for the slipperiness of ice and snow has a long history. Reynolds (Reference Reynolds1899), having developed the theory of hydrodynamic lubrication, described a ‘eureka’ moment wherein he postulated that a thin water film formed by pressure melting could account for the slipperiness of ice. However, Bowden and Hughes (Reference Bowden and Hughes1939) published the first systematic study, and while they agreed that lubrication was likely, they proposed a different mechanism. They pressed small sliders against rotating disks of solid ice and compacted snow and suggested that self-lubrication from frictional heating accounted for low sliding (kinetic) friction on both substrates. High static friction argued against pressure melting, whereas system changes that increased interface temperatures (higher ambient temperatures, heat conducted to or trapping at the interface) reduced sliding friction, consistent with their hypothesis. Numerous subsequent studies have produced results consistent with self-lubrication theory, and it remains widely accepted (Evans and others, Reference Evans, Nye and Cheeseman1976; Colbeck, Reference Colbeck1988, Reference Colbeck1992; Lehtovaara, Reference Lehtovaara1989; Persson, Reference Persson2000; Kietzig and others, 2010; Hasler and others, Reference Hasler2016; Nachbauer and others, Reference Nachbauer, Kaps, Hasler, Mossner, Braghin, Cheli, Maldifassi, Melzi, Sabbioni and Braghin2016). Because snow consists of bonded ice grains, studies often assume that self-lubrication prevails on both snow and ice surfaces. However, snow is porous and much weaker than solid ice, and other mechanisms could play important roles. Here, we specifically focus on snow sliding friction.
Within the theory of self-lubrication, a spatial distribution of friction modes inherently occurs along a finite-length slider (e.g. ski, sled or test coupon). Solid–solid contact occurs at the front, which first compacts the snow as needed to support the slider normal load. Further sliding warms persistently contacting snow grains to the melting point (0°C, neglecting small pressure-melting effects (Bowden and Hughes, Reference Bowden and Hughes1939; Colbeck, Reference Colbeck1995)). Continued movement generates heat to form meltwater layers, contacting snow grains become flat-topped, and the layers eventually thicken to support the slider without solid–solid contact. Because contact time for the stationary snow grains equates to distance along the slider, friction modes vary along the slider, from dry at the front to lubricated at the rear with mixed-modes in between. For self-lubrication to govern average frictional resistance, water layers at the contacting snow grains must support most of the slider weight.
The existence of mixed friction modes introduces a scaling requirement not generally acknowledged for laboratory snow-friction tests. In principle, tests using finite-length coupons (samples of materials of interest) must somehow isolate and separately scale the contributions from each friction mode to apply measured friction values to full-scale systems. Besides slider surface properties, many system variables (slider speed, normal pressure and thermal conductivity; snow structure and strength; ambient temperature; etc.) can affect the extent and resistance offered by each mode. For example, short sliders are proportionally more influenced by dry-contact friction than longer ones, other conditions being the same. Nachbauer and others (Reference Nachbauer, Kaps, Hasler, Mossner, Braghin, Cheli, Maldifassi, Melzi, Sabbioni and Braghin2016) and Hasler and others (Reference Hasler2016) justified development of a 24 m-long linear tribometer to test full-scale skis in part to avoid this scaling requirement. More complete understanding of the mechanics of each friction mode would aid scaling and lead to models that can predict full-scale performance from reduced-scale tests.
Researchers have attempted to quantify the modes within self-lubrication theory (Evans and others, Reference Evans, Nye and Cheeseman1976; Colbeck, Reference Colbeck1988, Reference Colbeck1992; Lehtovaara, Reference Lehtovaara1989; Baurle and others, Reference Baurle, Kaempfer, Szabo and Spencer2007; Makkonen and Tikanmäki, Reference Makkonen and Tikanmäki2014). The governing equation for lubricated friction assumes laminar flow in a parallel meltwater gap (Couette flow):
 $$\mu \equiv \displaystyle{{F_{\rm f}} \over {F_{\rm n}}} = \displaystyle{{\eta VA_{\rm r}} \over {h_{\rm w} F_{\rm n}}} = \displaystyle{{\eta V} \over {h_{\rm w} p_{\rm n}}} \left( {\displaystyle{{A_{\rm r}} \over {A_{\rm n}}}} \right)$$
where μ is friction coefficient, F f is friction force, F n is slider normal load, η is water viscosity, V is slider velocity, h w is water-film thickness, A r is real contact area, A n is nominal slider area and p n is nominal slider pressure.
Despite several attempts, self-lubrication on snow has not been conclusively verified. Huzioka (Reference Huzioka1958, Reference Huzioka1962, Reference Huzioka1963) showed micrographs taken after sliding iron, glass and plastic plates across snow that show flat-topped grains, abraded particles and possibly refrozen meltwater. Ambach and Mayr (Reference Ambach and Mayr1981) used a capacitive probe to infer 4–20 µm-thick water films between a ski and snow, with trends of increasing thickness with increasing temperatures and skier speed. However, Colbeck (Reference Colbeck1992) suggested that energy-budget analyses could not account for such thick films and that some solid–solid contact must occur during most skiing conditions. Modeling by Colbeck (Reference Colbeck1988) and Baurle and others (Reference Baurle, Kaempfer, Szabo and Spencer2007) supports this assertion, with water-layer thickness <1 µm expected for skiing conditions. Strausky and others (Reference Strausky, Krenn, Leitner and Aussenegg1998) used fluorescence spectroscopy to measure water-layer thickness for contact pressures on ice that they felt simulated skis on snow. Despite relatively low slider speeds (0.005–0.1 m s−1), they measured low friction (μ = 0.03 at −2°C) but observed no water films thicker than their detection limit of 50 nm. Colbeck and Warren (Reference Colbeck and Warren1991) and Lever and Weale (Reference Lever and Weale2012) measured the thermal response of skis and sleds, respectively, to sliding over snow, and Schindelwig and others (Reference Schindelwig, Hasler, Van Putten, Rohm and Nachbauer2014) used infrared (IR) sensors to measure snow-surface temperature under a ski. In each case, several degrees of warming occurred, but the sensing areas were too large to confirm that melting occurred at the snow-grain contact points.
In many regards, sliding on snow does not mimic sliding on ice. The front of a ski or sled compacts natural snow to less than the density and strength of solid ice. Compacted snow can further deform and fail in response to frictional shear before contact points warm to 0°C. Even with persistent snow-grain contacts, real contact area must increase during sliding either by melting or abrading contacting grains. This process is central to quantifying snow friction but is largely unknown and potentially quite different from contact evolution on ice. If meltwater films exist, pore spaces in snow allow water loss through squeezing, shearing and plowing by slider asperities. Owing to its solid structure and higher strength, ice is not a good surrogate to study these snow-friction processes.
Our study objectives were to verify that self-lubrication occurs at snow-slider contacts and to quantify the evolution of real contact area and the production and loss of meltwater to help constrain snow-friction models. We selected real-time, high-resolution IR thermography to observe the dominant signal of interest – warming and melting of the snow-slider contacts. We supplemented the thermography with pre- and post-test optical microscopy and post-test micro-computed tomography (micro-CT). To our surprise, we did not observe melting at contacting snow grains despite low friction values. Here, we describe our test methods, results and their implications for understanding and modeling snow friction.
2. APPARATUS AND TEST METHODS
We built a tribometer that rotates a ring slider (circular annulus) on a stationary tray of compacted and sintered snow (Fig. 1). Using pre-compacted snow allowed us to focus on the mechanics of snow friction after a slider compacts the snow sufficiently to support its weight. We chose the ring-slider configuration to minimize issues with mixed friction modes that occur along short coupons. Except for a minor radial speed gradient and a small slot in the slider ring, the tribometer established nominally uniform conditions around the snow-slider interface, so that all locations experienced the same friction mode at the same time.

Fig. 1. Rotary tribometer with IR camera. The camera captured a thermal image of a 9.7 mm × 7.7 mm stationary snow patch for each revolution of the slider. A torque cell supported the snow tray and measured its reaction to slider friction.
The ring slider was 30 mm wide × 405 mm centerline diameter × 9.5 mm thick ultra-high-molecular-weight polyethylene. The contacting surface was slightly glossy, and average roughness height, R a, was 0.65 µm (measured using a Taylor–Hobson Surtronic 3, with cut-off length of 0.8 mm).
Plastic screws fastened the slider to a precision ground, flat plate of 6.4 mm-thick aluminum to hold it flat and provide uniform thermal conditions. A square hole in the plate aligned with a slot in the slider, which allowed the synchronized IR camera to image the stationary snow sample once per revolution. The slot measured 36 mm wide at snow-slider interface (<3% of the circumference), including 8 mm radii leading and trailing edges to minimize scraping. One revolution of the slider corresponded to 1.24 m of travel across the snow surface. The collar that connected the slider plate to the drive shaft slid freely vertically and could pivot several degrees to ensure planar contact of the slider and snow surface. Optional circular weights increased slider normal load while maintaining uniform pressure distribution.
The snow tray consisted of a 65 mm wide × 25 mm deep annulus supported on 13 mm-thick aluminum plate. It bolted to a flanged, reaction torque cell with a central clearance hole for a rotary drive shaft. The only contribution to measured torque was the snow-tray reaction to sliding friction. A motor gearbox, mounted below the structural table, rotated the slider via the drive shaft. A data acquisition and control system triggered the camera, established the rotary speed profile, and recorded torque and speed at 10 Hz, with each value being the average of 100 1 kHz readings. A video monitor allowed manual focusing on the snow surface before a test and displayed each captured IR frame in real time.
The IR camera was a FLIR model A6703sc with 1× microscope lens and 3–5 µm wavelength sensitivity. Its 15 µm pixels provided contact-area resolution of 3 × 10⁻⁶ as a proportion of the 9.7 mm × 7.7 mm field-of-view (640 × 512 pixel array). Integration time (equivalent to shutter speed) was 5 ms. FLIR software allowed setup of camera parameters and triggering to capture one image (frame) per slider revolution for playback and analysis.
We performed non-uniformity corrections (spatial variations <0.1°C) before each test and periodically calibrated the camera with a blackbody chamber to achieve better than 0.1°C accuracy from −20 to 0°C. We manually input emissivity, distance to target (0.03 m) and the average ambient temperature to convert camera IR counts to temperature (FLIR, 2013). The emissivity of ice crystals and water in the 3–5 µm spectral range are both 0.95–0.98 (Salisbury and D'Aria, Reference Salisbury and D'Aria1994; FLIR, 2013). The calculated interface temperatures are insensitive to reasonable variations in input parameters: −0.03°C per 0.01 increase in emissivity, 0.002°C per 0.01 m increase in distance, −0.05°C per 1°C increase in ambient temperature.
To prepare the snow samples, we sieved and graded clean, natural snow (collected during winter) into the snow tray. We then compacted the snow and allowed it to sinter 1–3 d. The compaction process used a 63 mm-wide annular platen in a rate-controlled testing machine, and we recorded force-displacement data during compaction. Peak compaction pressures of 70–100 kPa ensured that the snow samples easily supported the slider nominal pressures (0.8–3.6 kPa). This preparation technique produced relatively uniform snow samples with grain sizes averaging 0.3–0.4 mm and bulk densities of 400–500 kg m−3, as determined by post-test micro-CT analyses. The compaction platen also produced a globally flat snow surface to ensure that the flat slider ring made planar contact with the snow.
We checked our IR-camera calibration by placing a warm (14°C), IR-transparent window over a stationary snow sample and recording the resulting warming, melting and refreezing of the snow-grain contacts at 30 Hz frame rate (Supplementary Fig. S1). The camera measured the dynamic melt and refreeze fronts as 0.0 ± 0.1°C. The record of maximum temperatures (warmest pixel within each image) showed a long refreeze plateau at 0.0 ± 0.1°C, as expected (Supplementary Fig. S2).
3. RESULTS
We conducted friction tests on 11 separate snow samples (Table 1) encompassing 28 combinations of slider pressure (0.8–3.6 kPa) and slider speed (0.3–1.3 m s−1) within a narrow range of air temperature (−5 to −8°C). For all tests, the snow samples easily supported the stationary slider, with no obvious compaction or lateral displacement of the snow under static load. Using hand snow-hardness measurements (Colbeck and others, Reference Colbeck1990) after each test, all snow samples represented relatively hard, strong snow (hardness R4).
Table 1. Summary of tribometer tests. Friction coefficients are 30 s average values. Maximum surface temperatures are from IR-camera frames
* Snow movement at the start of test 160425 filled the slider slot so the test was aborted.
† The snow sample for test 160613 was sintered at −20°C, so maximum surface temperature was initially colder than the air temperature when the test was conducted.
We observed two distinct modes of behavior of the snow samples under the action of slider shear: (1) widespread inter-granular bond failure, and (2) abrasive wear of persistent snow-grain contacts. We will describe results for each mode in turn.
Despite qualitatively strong snow, inter-granular bonds between snow grains were too weak to resist slider shear for five of the 11 samples. Based on the IR images, the failure cascaded quickly, requiring only a few slider revolutions to transition from movement of the first grains to movement of all grains in the field of view. Continued slider rotation would cause the slow build-up of lateral berms on the inner and outer edges of the slider, gradual sinkage of the slider and filling of the IR viewing slot. Supplementary Figure S3 shows IR images of snow features displaced near the start of a test that caused widespread bond failure. For all such cases, the predominant ‘flow’ of snow was in the direction of slider motion, with small radial components toward the inner and outer edges of the slider. Consequently, snow-grain contact locations were not persistent; they varied as the grains flowed.
For the five tests with widespread bond failure, the instantaneous friction coefficients (calculated from measured torques) were noisy but had relatively constant average values (Fig. 2a). Interestingly, average friction coefficients were often below 0.03 and were as low as 0.023 (Table 1). Snow-surface temperature rises were small and remained well below 0°C (Fig. 2b). Because snow movement caused the slider to sink, we stopped these tests when the slider backing plate contacted the snow tray (~10 mm of sinkage) or when the viewing slot filled with snow.
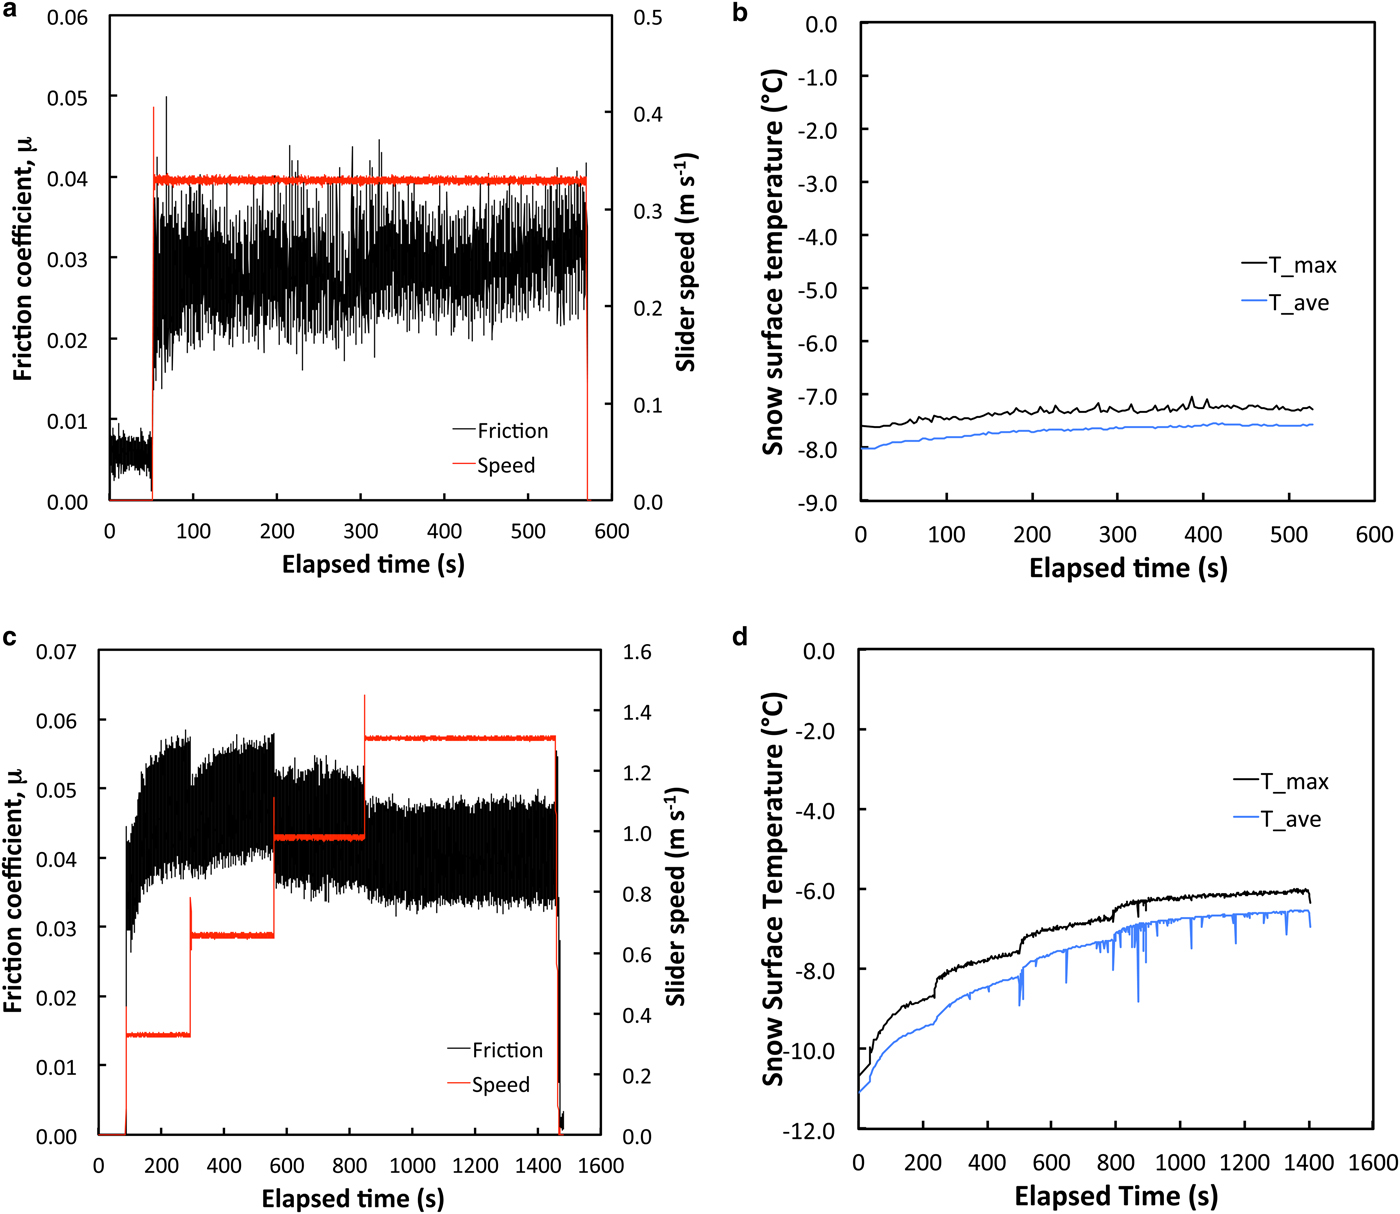
Fig. 2. Characteristic data from tribometer tests. The upper row shows data from test 160603, which produced widespread bond failure: (a) friction coefficient and slider speed; (b) IR-based maximum and average snow-surface temperatures, with scale set to include 0°C. The lower row shows similar data from test 160613, which developed persistent snow-grain contacts. Step increases in slider speed (c) produced abrupt increases in snow-surface temperatures (d). Imperfect camera-synch pulses introduced noise in average temperatures at higher speeds.
The remaining six snow samples resisted slider shear sufficiently for a second mode of behavior to occur: abrasion of snow grains at persistent snow-slider contacts. Because the snow grains did not move, we were able to increment slider speed from 0.33 to 1.31 m s−1, and in two cases add weights, to achieve 23 total pressure-speed settings. The snow-surface temperatures (average and maximum) showed abrupt jumps at the speed changes, consistent with rapid increases in frictional power, followed by more gradual increases toward steady values (Fig. 2d). Yet with even persistent snow-slider contacts, maximum snow-surface temperatures remained well below 0°C, and thus no meltwater layers were produced despite relatively low average friction values (0.025–0.050). Friction data showed somewhat surprising behavior (Fig. 2c). At the start of slider motion, friction was low and then gradually increased despite steadily increasing snow-surface temperatures. We speculate that the slider initially broke or abraded the relatively few static snow-grain contact points but then encountered higher resistance as abrasion increased contact area. The pattern repeated at the first speed change (0.33–0.66 m s−1) before showing the expected decrease in friction with increasing snow-surface temperatures at higher slider speeds.
When persistent contacts occurred, the IR images captured the evolving geometry of snow-slider contact in addition to snow-surface temperatures (Fig. 3). The first few frames showed the changing locations and shapes of the warmest areas, which we interpret as initial regions of snow-slider contact. The contact regions then stabilized and enlarged gradually as the test continued and temperatures rose; but as shown in Figure 2d, temperatures remained well below 0°C, so even persistent snow-slider contact areas did produce meltwater layers.

Fig. 3. Sequence of IR frames from test 160613, progressing from left to right beginning with upper row. Temperature range is −6 to −12 °C for all frames, with color bands auto-scaled to reveal differences across each image: warmest yellow-red, coldest blue-black, temperature of red band noted. Frame 1 (upper left) preceded slider motion, and the next five frames (upper two rows) were from successive slider revolutions. They show that warm areas from snow-slider contact initially changed locations. The last six frames correspond to intervals of 30–50 slider revolutions and show the evolution of persistent snow-slider contacts (arrows point to two examples). The warmer areas surrounding these features contain abraded particles collected within the snow's air pockets.
Following each tribometer test, we removed the slider and inspected and photographed the snow surface. All tests with widespread bond failure produced visibly obvious ruts and lateral berms of displaced snow grains. In contrast, all tests with persistent contacts produced no ruts and had a visibly glazed annular ring around the path of the slider. We interpret the glazed ring to be a consequence of the slider polishing the persistent snow-grain contacts (Fig. 4). The general uniformity of the glazed ring around the snow is consistent with globally flat slider-snow contact.

Fig. 4. Photograph taken after test 160613. The slider produced a partially glazed surface consisting of flattened snow grains. Slider motion was from bottom to top in this image.
Pre- and post-test optical microscope images (50×, 5 µm pixels, reflected light) revealed abrasion as the mechanism producing flat-topped snow grains for tests with persistent contacts (Fig. 5). For these cases, post-test images showed distinct changes in reflected light: uniform intensity, sharp-edged shapes that correspond to flattened snow grains; interstitial regions consisting of numerous bright points that we interpret as small ice crystals abraded from the contacting grains.

Fig. 5. Pre-test (a) and post-test (b) optical microscope images of snow surface from test 160606 (persistent contacts). Slider motion was from right to left. In (b), uniform-intensity, sharp-edged shapes are flat-topped snow grains, while the bright areas contain small light-scattering points that are consistent with abraded ice crystals. For tests with widespread bond failure, pre- and post-test microscope images were both similar to (a).
The three sets of surface images (IR, light photographs, optical microscope images) collectively revealed an unexpected finding: the flat-topped snow grains were not the warmest features. As shown by Figures 3–5, the flat-topped grains were well-defined, sharp-edged shapes, and the warmest regions were the interstices between these grains where the abraded crystals collected. These crystal deposits were as much as 1.5°C warmer than the flat-topped grains that corresponded to snow-slider contact areas.
An important objective was to quantify the evolution of real snow-slider contact area as sliding proceeded. Because melting did not occur, we could not identify contacting snow grains with a simple temperature (0°C) criterion. Instead, we used two subjective criteria: (i) sharp-edged, closed shapes, and (ii) systematic variation in area with time. Using ImageJ image-processing software (Rasband, Reference Rasband2012), we manually measured the area of these features for IR images from test 160 613 and also determined their corresponding surface temperatures (Fig. 6a). IR temperatures varied only slightly (±0.1°C) across a contacting grain. By summing all such contact areas, we determined the evolution of real slider-snow contact area throughout the test (Fig. 6b), assuming that the imaged area was representative of the entire snow-slider contact area. As far as we know, these are the first measurements of grain-scale contact-area and contact-temperature evolution during sliding on snow.

Fig. 6. Measured contacting-grain properties for test 160613. (a) Area and temperature evolution of four snow grains, identified in inset IR image by white symbols. Area ratios (black symbols) are the grain contact areas normalized by nominal (image) area, A r/A n. Surface temperatures (red symbols) increased similarly for all grains and tracked the average surface temperature for the whole image (blue line). (b) Evolution of total snow-slider contact as the sum of the areas of 29 grains manually identified and analyzed on the IR images (start and end images inset). The best-fit curve, A r/A n = −2.96 × 10⁻⁸ L 2 + 1.52 × 10⁻⁴ L + 3.96 × 10⁻³, suggests that initial contact area was ~0.4% of nominal area.
Contact area increased linearly with the logarithm of total slider travel, L, for three of the four contacting grains (Fig. 6a). The fourth grain showed a bi-linear increase, suggesting an abrupt change in abrasion conditions for that grain. Despite different rates of area increase, contacting-grain temperatures increased similarly, consistent with spatially uniform slider-surface temperatures. For the snow as a whole (Fig. 6b), A r/A n increased from ~0.004 to 0.15 ± 0.02 after 1300 m of slider travel, well below the asymptotic value of the volumetric or areal density of the bulk snow of 0.52 ± 0.03.
For individual grains, contact temperature essentially increased linearly with contact area (Fig. 7). Again, this result is inconsistent with meltwater formation, which would show constant snow-grain contact temperature (0°C) as contact area increased.

Fig. 7. Surface temperature vs area ratio for four contacting snow grains during test 160613. Symbols on the inset IR image identify the grains measured.
After most tests, we extracted specimens (30 mm diameter × 25 mm deep) from the snow trays and imaged them within 15 min in a Bruker SkyScan 1173 X-ray microtomograph, located in a cold room at −8°C, to reconstruct the snow structure for quantitative analysis. For tests with persistent contacts, the glazed contact surfaces looked like higher density planes when viewed edge-on (Fig. 8), consistent with near-surface deposits of abraded ice crystals. We did not see clear evidence of refrozen meltwater (e.g. surface grains with smooth, extended lobes along the slider direction).

Fig. 8. Micro-CT images of a snow specimen from test 160613, extracted from under the slider path. (a) Raw X-ray image, with arrow pointing to plane of glazed surface produced by the slider. (b) Three-dimensional reconstruction of the snow specimen, with snow (ice) grains shown in light gray and air pockets shown in dark gray. The arrow again points to the plane of the glazed surface. Snow grains above this surface fell onto the sample during extraction.
Unfortunately, the micro-CT resolution (15 µm voxels) was insufficient to resolve individual abraded crystals. Their presence nevertheless increased voxel density within the three-dimensional (3D) reconstructions of the specimens and affected subsequent analyses. For example, 15 µm reconstructed slice at the glazed surface from test 160 613 (Supplementary Fig. S4) had much higher areal density (A r/A n = 0.46 ± 0.02) than the total contact area of A r/A n = 0.15 ± 0.02 measured using IR images. The former included the contribution of collections of abraded crystals, while the latter tracked the evolution of sharp-edged shapes that constituted the actual contacting grains. Similarly, grain-size analyses could not reveal the presence of large numbers of abraded ice crystals in the top few slices through the reconstructed geometry (Supplementary Fig. S5). Nevertheless, high-resolution density profiles through the specimens showed that the slider produced very little sub-surface compaction (Supplementary Fig. S6), consistent with the strong snow tested. Despite their limitations, the 3D reconstructions provide geometric constraints to aid future snow-friction modeling efforts.
4. DISCUSSION
Our study objectives were to verify that self-lubrication occurs at snow-slider contacts and to quantify the evolution of real contact area and the production and loss of meltwater. We designed a rotary tribometer that established uniform friction conditions and allowed a high-resolution IR camera to image the same patch of snow surface once per revolution to document warming and melting of the contacting snow grains. We supplemented this real-time thermography with photography, optical microscopy and micro-CT analyses to seek detailed understanding of sliding-friction processes at the micro-scales they operate.
Considering the widespread belief that self-lubrication accounts for low kinetic friction on snow, we were understandably surprised to find contradictory results. We measured low friction for cases where slider shear failed inter-granular bonds and produced widespread snow movement with no persistent contacts to melt (μ < 0.03). More importantly, when the snow grains did not move and persistent contacts evolved, the slider abraded rather than melted the grains at low resistance (μ < 0.05). In these cases, the warmest areas were deposits of abraded ice crystals rather than the flat-topped contacting grains. The solid-ice snow grains apparently conducted heat away from the interface more efficiently than the porous assemblages of abraded particles.
The prevailing theory of snow kinetic friction anticipates the first mode of behavior, snow-grain bond failure, as potentially occurring on weak, natural snow. Dry slider-snow contact can cause inter-granular bond failure that limits frictional resistance. This mode could occur even after the front of the slider compacts natural snow sufficiently to support its weight. With regard to our tests, inter-granular bond failures occurred for snow samples prepared from older snow with coarse, well-rounded grains. Once we recognized that snow-sample shear strength was sensitive to source-snow type (fine- or coarse-grain), we increased sintering times and humidity to increase bond strengths before testing coarse-grain samples.
It is the second observed mode, abrasion rather than melting of persistent snow-grain contacts, that contradicts prevailing theory. We observed this mode for all tests with persistent contacts. Indeed, if the inter-granular bonds did not fail early during the tests, we generally increased slider speed (frictional power) and slider weight (frictional shear) and still did not observe melting of the contacts. Before addressing the implications of abrasion as a dominant snow-friction mode, we first consider whether potential test artifacts affected this key result.
The slider view slot, which briefly exposed the snow surface to ambient air, minimally affected measured surface temperatures. Air-exposure times varied 0.03–0.1 s across the IR images at 0.33 m s−1 slider speed and dropped by a factor of four at 1.31 m s−1. The IR images showed no systematic spatial gradient in the slider direction as would be expected if significant cooling occurred when the slot passed over the snow. IR videos taken immediately after the slider stopped also showed a snow-surface cool-down rate of only 0.01°C s−1. Even allowing for higher air-snow heat transfer during slider motion, snow-surface cooling during the brief air-exposure periods was too small to affect measured temperatures.
Similarly, pressure effects at contacting ice grains (Colbeck, Reference Colbeck1995) were too small to cause melting at the surface temperatures observed during the tests. At the maximum nominal pressure of 3.6 kPa and assuming an initial contact area of only 0.1% of nominal area (Baurle and others, Reference Baurle, Kaempfer, Szabo and Spencer2007; Theile and others, Reference Theile, Szabo, Luthi, Rhyner and Schneebeli2009), the melting point of the contacting snow grains would have been depressed by only 0.3°C. Thus, even before abrasion increased contact area, pressure melting would not have occurred at the snow-surface temperatures observed.
An important consideration is whether the IR camera's resolution, 15 µm or A r/A n = 3 × 10⁻⁶, was sufficient to observe if melting had occurred. Self-lubrication models (Colbeck, Reference Colbeck1988, Reference Colbeck1992; Lehtovaara, Reference Lehtovaara1989; Baurle and others, Reference Baurle, Kaempfer, Szabo and Spencer2007) envision lubricated contacts comparable to grain sizes (100 µm or larger) and estimate that A r/A n increases from ~10−3 (to support the static load) to more than 10−1 from frictional melting of the contacting snow grains. These are large dimensions and area ratios relative to the IR camera resolution, and thus the camera would have captured evidence of self-lubrication had it occurred as envisioned by theory.
Nevertheless, we can ask whether individual melted contacts existed that were smaller than 15 µm yet sufficiently numerous to govern frictional resistance. Physical and statistical considerations argue against this possibility.
Consider the physical situation. We measured area ratios for individual flat-topped grains that typically ranged A r/A n ~ 10−3–10−1 (e.g. Fig. 7). These flat-topped grains each included ~102–104 pixels. Moreover, the measured temperatures across each flat-topped grain were highly uniform (±0.1°C). It seems unlikely that numerous sub-pixel melt layers could produce such uniform grain-scale contacts yet remain isolated and thereby undetected by the IR camera. Water-layer squeezing under normal load, shearing from slider friction and plowing by slider asperities would all tend to merge the sub-pixel contacts. Given the large numbers required, random variations would likely cause some sub-pixel contacts to merge. Yet we did not observe even a single IR pixel reaching 0°C during any test with persistent contacts.
IR temperature distributions were also inconsistent with widespread, sub-pixel melting. Surface-temperature histograms, derived for each IR frame, showed single-mode, Gaussian-like distributions that shifted upward in temperature as sliding proceeded (Supplementary Fig. S7). If sub-pixel melting were widespread, these histograms would have shown bi-modal distributions, with the high-temperature mode caused by mixing IR emissions from melted areas with colder snow-grain temperatures within each pixel. The majority of pixels, with no sub-pixel melting, would have formed the dominant mode of the histogram. Yet histograms from persistent-contact tests did not display bi-modal distributions, consistent with physical arguments that widespread sub-pixel melting did not occur.
A related consideration is whether the IR camera would have measured temperatures considerably colder than 0°C when snow-grain surface temperatures reached 0°C and thereby miss melting had it occurred. IR-emissions mixing occurred because the emissions inherently emanated from within thin, near-surface regions of each grain, and the interiors were colder than the contact surfaces as the grains warmed from frictional heating. The mixing effect was strongest when temperature gradients were strongest: at startup and immediately after each slider-speed change. Supplementary Material includes a detailed analysis of the effect of IR emissions mixing on measured temperatures, but the effect was small. Emissions emanated from the top 130 µm of the contacting snow grains, and near-surface temperature gradients were small after one slider revolution. We estimate that IR-emissions mixing depressed measured temperatures by <0.02°C at startup and at each speed change. That is, the IR camera would have detected 0°C contacting snow grains within the tolerance of its calibration, ±0.1°C.
Did starting the tests from rest on new snow samples somehow bias the outcomes? If the system of interest is a ski or sled continuously sliding over untracked snow, the snow grains only experience a few meters of slider travel. Our IR camera captured the snow surface temperatures after each slider revolution or 1.24 m of slider travel. If self-lubrication governs friction for a ski or sled sliding over untracked snow, we should have observed grain melting within the first 2–20 slider revolutions (2.5–25 m of slider travel). Some of our tests exceeded the equivalent of 1200 m of slider travel and produced several degrees of average snow-temperature increase without revealing evidence of grain melting. Other research groups have conducted tests to seek steady-state friction coefficients through repeated passage, or run-in, of a slider over a snow or ice sample (Buhl and others, Reference Buhl, Fauve and Rhyner2001; Baurle and others, Reference Baurle, Szabo, Fauve, Rhyner and Spencer2006; Hasler and others, Reference Hasler2016). While such tests may be relevant for skis traveling repeatedly over the same snow tracks, they ignore the transient processes that occur as a ski or sled encounters new, untracked snow. For example, Hasler and others (Reference Hasler2016) measured friction coefficients on full-scale skis that increased for the first ~10 passes (~240 m of travel) over the same track then slowly decreased for the next 40 passes (additional 960 m of travel). Interestingly, our tests with persistent snow-grain contacts showed similar increasing-then-decreasing friction trends, albeit complicated by speed increases (Fig. 2c).
Did slider roughness bias our results toward abrasion? As noted, our polyethylene slider had R a = 0.65 µm. By comparison, R a values for ski bases are of the order 10–100 µm (Baurle and others, Reference Baurle, Szabo, Fauve, Rhyner and Spencer2006; Hasler and others, Reference Hasler2016). We would not expect lower slider roughness preferentially to abrade snow grains rather than melt them. In general, the role of slider roughness within self-lubrication theory has not been well addressed. In particular, the theory does not explain how water films thinner than 1 µm (Colbeck, Reference Colbeck1988; Baurle and others, Reference Baurle, Kaempfer, Szabo and Spencer2007) can support 10–100 µm slider asperities and prevent them from plowing and abrading the underlying snow grains.
We must allow for the possibility that the range of our test parameters excluded regimes where self-lubrication governs snow friction. Our slider speeds (0.3–1.3 m s−1) were low relative to competitive skiing (5–20 m s−1) although close to the range for polar sleds (2–4 m s−1). Our slider nominal pressures (0.8–3.6 kPa) were similar to the low range for skis and sleds (4–10 kPa). Test temperatures (−5 to −8°C) overlapped with ranges of interest for temperate-winter and summertime polar conditions. It is possible that self-lubrication dominates outside of our test parameters; but a question remains: Would faster, heavier sliders somehow avoid the abrasion regime observed here and warm contacting snow grains to the melting point?
System-level, energy-budget effects have been interpreted in light of self-lubrication theory. In particular, laboratory data from sliders on snow often show a decrease in friction with increasing ambient temperature (Bowden and Hughes, Reference Bowden and Hughes1939; Huzioka and Hikita, Reference Huzioka and Hikita1954; Buhl and others, Reference Buhl, Fauve and Rhyner2001), suggesting more abundant meltwater production. Field data from oversnow fuel and cargo sleds showed a similar effect (Lever and Weale, Reference Lever and Weale2012; Lever and others, Reference Lever, Weale, Kaempfer and Preston2016). Importantly, sled–snow interface temperature, which accounts for energy flow to and from the interface, effectively collapsed sliding friction coefficient across a broad range of field conditions (Lever and Weale, Reference Lever and Weale2012). Our tribometer data also showed a trend of decreasing friction with increasing interface temperature, albeit over a narrower range of conditions (Supplementary Fig. S8). In the absence of meltwater formation, what accounts for this effect? We suggest that increasing temperatures decrease abrasion resistance and thereby reduce frictional resistance.
Accelerated abrasion is a likely and potentially dominant outcome as frictional heating warms contacting snow grains toward 0°C. Because abrasive wear of the softer material is common for dry sliding surfaces (Rabinowicz, Reference Rabinowicz1965; Sarkar, Reference Sarkar1980), the slider will abrade the warmest surface layers of the contacting grains, exposing slightly colder snow. As sliding and abrasion continue, the vertical temperature gradient in a contacting snow grain will be a balance between heat input, heat conduction and abrasive wear. The Archard equation (Archard, Reference Archard1953) reasonably quantifies wear rates for dry sliding interfaces:
 $$W = \displaystyle{{kP} \over H}$$
where W is volumetric wear rate per unit distance of slider travel, k is a constant, P is slider normal load and H is indentation hardness of the softer material. For single-crystal and polycrystalline ice across a wide range of strain rates, H drops abruptly as temperatures approach 0°C (Butkovich, Reference Butkovich1954; Barnes and Tabor, Reference Barnes and Tabor1966; Offenbacher and Roselman, Reference Offenbacher and Roselman1971). Thus, as snow-grain surface layers (ice) warm toward 0°C, their abrasion resistance will drop and wear rates will accelerate. It is therefore likely that abrasion removes snow-grain surface layers before these layers warm to 0°C. This process is consistent with our micro-scale observations.
Abrasion mechanics are not included in current snow-friction models. The snow grains are assumed to respond to frictional shear only by warming and melting. Furthermore, the observed transport of warm, abraded ice crystals into nearby air pockets represents heat flux away from the snow-slider contacts and thus reduces the heat available to melt the grains. This heat loss is also not included in current snow-friction models. If abrasion mechanics and heat flux were included, friction models should be able to quantify the interplay between abrasion and warming of the contacts to identify regimes where either self-lubrication or abrasion governs snow friction. Given the ubiquity of abrasion, it is possible that the regime available for self-lubrication is much smaller than previously thought.
5. CONCLUSIONS
Prevailing theory postulates that meltwater produced by frictional heating causes low friction on snow. Our results contradict this interpretation within the parameter space we have investigated. We measured low friction values (μ < 0.03) for cases with widespread inter-granular bond failure and thus no persistent contacts to melt. More importantly, for tests with persistent contacts (flat-topped grains), maximum snow-surface temperatures remained well below 0°C, and abrasion of the contacting snow grains limited frictional resistance (μ < 0.05). Furthermore, the abraded particles transported heat away from the interface and thereby reduced the heat available to warm and melt contacting snow grains. Abrasion mechanics and the resultant heat loss are not included in the self-lubrication theory of snow friction (Colbeck, Reference Colbeck1988, Reference Colbeck1992; Lehtovaara, Reference Lehtovaara1989; Baurle and others, Reference Baurle, Kaempfer, Szabo and Spencer2007).
Overall, our results challenge whether self-lubrication is indeed the dominant mechanism underlying low snow kinetic friction. The interface must first satisfy two conditions: (1) the bulk snow must resist slider shear, and (2) abrasion and the resulting heat loss at the contacting snow grains must be small enough to allow the contacts to warm to 0°C. Given our observations and the potential for accelerated wear as the contacts warm, abrasion may govern snow friction across broad regimes of interest. Nevertheless, regimes where either abrasion or self-lubrication dominate snow friction remain to be mapped.
SUPPLEMENTARY MATERIAL
The supplementary material for this article can be found at https://doi.org/10.1017/jog.2017.76
ACKNOWLEDGEMENTS
We thank J. Hodge, D. Punt, C. Donnelly and C. Williams for their efforts to build the tribometer and associated instrumentation. We also thank CRREL refrigeration staff for maintaining our cold rooms throughout the extended test period and Chris Polashenski for suggesting an approach to quantify the depth of IR-emissions mixing. We are grateful for funding provided by the US Army Engineer Research and Development Center, Military Engineering Program under the Basic Research Portfolio.


 Open access