


1. Introduction
Glacier surface albedo (hereafter glacier albedo) is a key glacier surface property, which drives the glacier energy balance since it determines the net shortwave radiation (NSR). The latter often accounts for >50% of total absorbed energy (Zhang and others, Reference Zhang, Kang, Cuo and Qu2016), thus affecting glacier mass balance very significantly (Zhang and others, Reference Zhang, Gao, Kang, Shangguan and Luo2021). Many studies have shown that glacier albedo is significantly correlated with glacier mass balance and can be a good proxy to estimate annual mass balance (Brun and others, Reference Brun2015; Wang and others, Reference Wang, Cui, He, Zhang and Yan2015; Davaze and others, Reference Davaze2018; Williamson and others, Reference Williamson, Copland, Thomson and Burgess2020; Xiao and others, Reference Xiao, Ke, Fan, Shen and Cai2022). Due to low accuracy and limited data resources, it is difficult to directly observe the annual and seasonal glacier mass balance at high temporal resolution at regional scale, which is very important for local and regional water management. Glacier mass balance shows a high correlation with glacier albedo, which can be easily retrieved with remote-sensing data at high spatial and temporal resolution. Thus, exploring the variability of albedo is a good way to better understand glacier change. The glaciers in the Western Nyainqentanglha Mountains (WNM) are the main water source for Nam Co Lake (the second largest lake in the Tibetan Plateau) and Lhasa, but experienced continuous shrinkage and mass loss after the 1970s and accelerated mass loss in recent years (Bolch and others, Reference Bolch2010; Zhou and others, Reference Zhou, Li, Li, Zhao and Ding2018; Ren and others, Reference Ren2020; Hugonnet and others, Reference Hugonnet2021; Fan and others, Reference Fan2022; Xiao and others, Reference Xiao2023a). Long-term changes of glacier albedo have been less explored, however, which highly limits the understanding of glacier changes in this region.
The spatiotemporal variability of glacier albedo is related to local meteorology (e.g. Ming and others, Reference Ming, Du, Xiao, Xu and Zhang2012, Reference Ming, Xiao, Du and Yang2013; Wang and others, Reference Wang, Ye, Cui, He and Yang2014; Shaw and others, Reference Shaw2021; Xiao and others, Reference Xiao, Ke, Shen, Cai and Li2023b) and to the deposition of atmospheric light-absorbing impurities (LAIs) (e.g. Kang and others, Reference Kang, Zhang, Qian and Wang2020; Sarangi and others, Reference Sarangi2020; Zhang and others, Reference Zhang, Gao, Kang, Shangguan and Luo2021). On the one hand, local weather affects glaciers not only directly by mass supply and ablation, but also indirectly through the albedo feedback mechanism (Wang and others, Reference Wang, Ye, Cui, He and Yang2014; Naegeli and others, Reference Naegeli, Huss and Hoelzle2019). For example, temperature can accelerate the evolution of snow surface properties leading to the exposure of bare ice and debris and to the presence of liquid water on the glacier surface, thus contributing to a decrease in glacier albedo (Wang and others, Reference Wang, Ye, Cui, He and Yang2014; Naegeli and others, Reference Naegeli, Huss and Hoelzle2019). The quantity and frequency of snowfall and snow age determine snow albedo feedback on the glacier surface. Strengthening westerlies and weakening Asian monsoon have significantly changed the large-scale meteorology in the past several decades over the Tibetan Plateau (Yao and others, Reference Yao2012), but the effects of both synoptic weather systems on albedo need to be further revealed. On the other hand, LAIs deposition, including black carbon and dust (e.g. Sarangi and others, Reference Sarangi2020; Li and others, Reference Li2020b), can reduce albedo and thus increase absorbed radiation and glacier melting. Indeed, in situ observations and model simulations have demonstrated that LAIs can be transported over the Himalaya and reach the inner Tibetan Plateau (Qu and others, Reference Qu2014; Li and others, Reference Li2020a, Reference Li2020b), and also has clear seasonal difference (Cong and others, Reference Cong2015; Li and others, Reference Li2020a). Few studies have addressed the impact of LAIs on glacier albedo in the inner Tibetan Plateau, thus their long-term effects have not been well understood.
Glacier mass loss in the WNM is large (Li and Lin, Reference Li and Lin2017; Zhou and others, Reference Zhou, Li, Li, Zhao and Ding2018; Ren and others, Reference Ren2020), which suggests a high sensitivity to climate change of this transition region between a monsoon- and a westerlies-dominated climate. The significant LAIs deposition after long-distance transport further enhances the relevance of WNM to explore the role of albedo and the effects of potential drivers on the mass balance of glaciers in the inner Tibetan Plateau. Accordingly, the objectives of this study are: (1) to explore the spatiotemporal patterns of albedo at different time scales (annual and seasonal) during the past two decades; (2) to analyze the potential drivers of such variability in relation with local meteorology and LAIs.
2. Study area
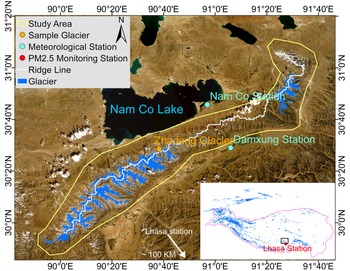
The study area is located in the WNM in the inner Tibetan Plateau (Fig. 1). The elevation range is 4150–7200 m a.s.l. and the highest mountain is the Nyainqentanglha Peak with 7162 m a.s.l. This area is divided into two parts by a northwest–southeast mountain ridge, i.e. northern WNM and southern WNM. The Indian monsoon dominates the weather in summer and the westerlies dominate in winter. According to the meteorological observations during 2006–2017 at the Nam Co station, the mean annual precipitation was 400 mm and the mean annual air temperature was −0.64°C. The glacier area in this region is ~700 km2 (Guo and others, Reference Guo2015), while only 15 km2 is debris-covered glacier (Herreid and Pellicciotti, Reference Herreid and Pellicciotti2020). The runoff from glaciers in the northern WNM feeds the second largest lake (Nam Co Lake) in the Tibetan Plateau, while the runoff from the southern WNM flows through Lhasa into the Yarlung Tsangpo River (Ke and others, Reference Ke, Kou, Ludwig and Qin2013). Glaciers in the WNM are subcontinental type and their equilibrium line altitude (ELA) is ~5800 m a.s.l. (Yao and others, Reference Yao2010; Huintjes and others, Reference Huintjes2015; Ren and others, Reference Ren2020). The PM2.5 Monitoring station in Lhasa is located ~100 km to the south of the WNM (Fig. 1). The dominant wind directions are S–SW and W–NW according to the observations in Zhadang Glacier (Zhang and others, Reference Zhang2013) and Lhasa (Ran and others, Reference Ran2014).

Figure 1. Overview of the Western Nyainqentanglha Mountains (WNM) of the Tibetan Plateau. The yellow polygon is the study area, the purple line is the ridge line of mountains and the blue-shaded areas are glacier outlines. The orange point is the Zhadang Glacier, the cyan points are the two meteorological stations. The positions of the WNM in the Tibetan Plateau are shown with black rectangle and PM2.5 monitoring station in Lhasa is indicated by the red dot in the lower right corner.
3. Data
Three data components were used in this study (Table 1):
(1) data to retrieve albedo and to estimate solar shortwave irradiance, i.e. the MODIS surface reflectance product (MOD09GA and MYD09GA), and the Global LAnd Surface Satellite (GLASS) Downward Shortwave Radiation (DSR) product;
(2) data on candidate drivers of glacier albedo including meteorological variables from the China Meteorological Forcing Dataset (CMFD) and field stations, PM2.5 concentration data from the Global Annual PM2.5 Grids data over the WNM and stations in Lhasa. The gridded datasets are used to characterize regional patterns, and station data are for detailed studies;
(3) Randolph Glacier Inventory Version 6.0 (RGIV6.0) dataset for glacier classification and delineation.
Table 1. The main datasets used in this study and all grid data were reprojected to WGS84 coordinate system

3.1 Glacier albedo retrieval and radiation estimation
Glacier surface reflectance. The MODIS sensors carried by the Terra and Aqua satellites (MODIS/Terra and MODIS/Aqua) were respectively launched in December 1999 and May 2002 and have been widely applied in mountain glacier albedo research (e.g. Ming and others, Reference Ming2015; Zhang and others, Reference Zhang, Gao, Kang, Shangguan and Luo2021). The MODIS Daily 500 m Collection 6 (C6) Surface Reflectance data products, i.e. MOD09GA (Terra) and MYD09GA (Aqua), contain the surface reflectance in bands 1 through 7 at 500 m spatial resolution with additional observations and geolocation statistics gridded at 1 km spatial resolution. In this study, both MOD09GA and MYD09GA products were used to retrieve glacier albedo.
Surface shortwave irradiance. GLASS is a gridded land surface dataset (Zhao and others, Reference Zhao2013a). The daily DSR dataset in GLASS was used to estimate long-term trends in DSR and estimate NSR on the glacier surface combined with our derived-MODIS glacier albedo. The DSR data apply to horizontal surface facets and achieve a good accuracy with mean bias <6.5 W m−2 at 5 km spatial resolution (Zhang and others, Reference Zhang2019). No further processing was done since we assumed that the DSR was uniform within a 5 km × 5 km grid (see Section 6.2). This product is available until 2017, so the variability of DSR and NSR was evaluated in the period 2001–2017 only.
3.2 Driving factors
Meteorological data. The long-term meteorological data, including air temperature, snowfall and rainfall, from the CMFD (1979–2018; He and others, Reference He2020) were used to analyze the regional response of glacier albedo to meteorological conditions. The CMFD was generated by combining satellite data products, reanalysis data and field observations at weather stations at 0.1° × 0.1° spatial resolution. Although CMFD is coarser than the retrieved glacier albedo, no other long-term high spatial gridded data are available. In addition, we used the meteorological observations at the Damxung station (4290 m a.s.l.) of the China Meteorological Administration and at the Nam Co experimental station (4750 m a.s.l.) of the Institute of Tibetan Plateau Research to explore the difference in meteorology between northern and southern WNM (Fig. 1). Since both datasets provide total precipitation only, snowfall and rainfall were distinguished by applying a threshold of 0°C to mean daily air temperature. A sensitivity analysis showed that snowfall indeed depends on this threshold, especially in years with heavy precipitation. This threshold generally has a limited influence on the inter-annual variability of snowfall, however (Fig. S1). Since the analysis of driving factors is based on inter-annual variability, the impact of the threshold to distinguish solid and liquid precipitation should be limited.
PM2.5 concentration data. Since long-term observations of LAIs on the glacier surface are unavailable in the WNM, we used two datasets on atmospheric PM2.5 concentration, where PM2.5 is the concentration of suspended particulates smaller than 2.5 μm in diameter, as an indicator of likely deposition of LAIs in the region to analyze their potential impact. One is the Global Annual PM2.5 Gridded data covering the period 1998–2016 at 0.01° spatial resolution, and estimated by applying a chemical transport model and multiple satellite instruments (Van Donkelaar and others, Reference Van Donkelaar2016). This may result in a footprint mismatch between PM2.5 and albedo data, but no other spatial data on PM 2.5 concentration in this region are available. The other one is hourly PM2.5 concentration observed during 2014–2020 at a station in Lhasa located ~100 km to the south of the WNM. Due to dominant S–SW winds, we assumed that the PM2.5 observed in Lhasa is an indication of LAIs conditions in the WNM, i.e. we assumed that the temporal evolution of PM2.5 can represent possible LAIs deposition on the WMN glaciers. The gridded data were applied for annual and the station data for seasonal LAIs, respectively.
3.3 Glacier inventory dataset
The glacier outlines from the RGIV6.0 were used to identify glaciers in the MODIS albedo images. Since the spatial resolution of MODIS is too coarse compared with the Landsat images used to produce RGIV6.0, we used glacier fractional abundance in each MODIS pixel to identify the glacier area. Firstly, the RGIV6.0 glacier outlines were applied to construct a glacier map with the spatial resolution of Landsat images, i.e. 30 m × 30 m. Secondly, glacier fractional abundance, i.e. the percentage of glacier area, was calculated in each MODIS pixel using the RGIV6.0-based glacier map as a reference. Finally, the MODIS pixels with >50% glacier abundance were labeled as glacier pixels. Although this approach still retains some mixed pixels that can lead to low albedo, it is an inevitable compromise since the limited number of MODIS pixels with 100% glacier fractional abundance was insufficient to capture spatial patterns and changes of albedo in the WNM. The method applied to retrieve albedo in this study was developed for clean ice (Ren and others, Reference Ren2021), so the debris-covered glaciers were excluded. The impact of excluding debris-covered glaciers on regional glacier albedo was limited, since these glaciers account for 2% of total glacier area only.
4. Method
4.1 Glacier albedo retrieval
Previous studies use either MCD43A3 (e.g. Mortimer and Sharp, Reference Mortimer and Sharp2018) or MOD10A1 and MYD10A1 (e.g. Ming and others, Reference Ming2015) MODIS albedo products to investigate the spatiotemporal variability of glacier albedo at regional scale. The albedo in MCD43A3 is retrieved by two algorithms: one is full inversion and is applied when the parameters of the Bidirectional Reflectance Distribution Function (BRDF) model can be successfully estimated with sufficient observations in a 16-day window. The other one is magnitude BRDF inversion and is applied when full BRDF inversion fails (Strugnell and Lucht, Reference Strugnell and Lucht2001; Schaaf and others, Reference Schaaf2002; Jin and others, Reference Jin2003). According to our previous study (Ren and others, Reference Ren2021), however, MCD43A3 with both algorithms still has too many gaps to capture rapid glacier albedo changes due to snowfall in most cases (Klein and Stroeve, Reference Klein and Stroeve2002). The studies based on MOD10A1 and MYD10A1 firstly identified snow pixels and then used snow albedo to explore the change of glacier albedo, which actually neglect the change of ice albedo and can lead to high uncertainty when snow disappears during the melt season, especially in the ablation zone.
Instead, we used an improved method to retrieve glacier daily albedo (Ren and others, Reference Ren2021) using MODIS surface reflectance data (MOD09GA and MYD09GA). This method accounts for both snow and ice BRDF properties and the retrieved albedo shows better accuracy, less gaps and good temporal evolution, which is particularly useful in mountain glacier regions, like the Tibetan Plateau, characterized by short snowfall events and frequent albedo fluctuations (Ren and others, Reference Ren2021). The method includes three parts: (1) Topography correction by applying two functions depending on the orientation of observed targets and the position of the satellite and the sun (Wen and others, Reference Wen, Liu, Liu, Xiao and Li2009). Terrain slope and aspect are calculated using the ALOS World 3D-30 m Digital Surface Model (DSM) dataset (Tadono and others, Reference Tadono2014), the zenith and azimuth angles of sun and satellite are directly read-out of the MODIS ancillary data records. (2) Narrowband albedo retrieval: applying anisotropic correction determined by the positions of sun and satellite for each band to convert bi-conical surface reflectance to narrowband surface albedo. (3) Broadband albedo retrieval: using two empirical equations (Eqns (1) and (2)) to convert narrowband to final broadband albedo of ice and snow surfaces (α ice and α snow), respectively.


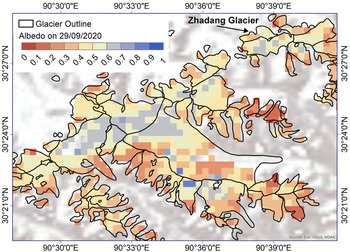
where b i (i = 1, 2, 3, ……, 7) represent retrieved narrow band albedo in the i-th MODIS band. Only pixels flagged ‘Clear’ in the MODIS Cloud Mask product are used for glacier albedo retrieval. All processes have been implemented on Google Earth Engine (GEE) for big data processing, and more details can be found in Ren and others (Reference Ren2021). An example of the retrieved daily albedo based on MODIS reflectance by our improved method in the central WNM is shown in Figure 2.

Figure 2. Example of the retrieved daily albedo based on MODIS reflectance and the method by Ren and others (Reference Ren2021) on 29 September 2020 in the central WNM of the Tibetan Plateau. A gap within the glacier outline indicates either cloud or debris cover.
4.2 Temporal and regional composition
Temporal composition. It is difficult to characterize the temporal variability of albedo directly using the daily albedo if there are too many invalid data due to clouds, thus we further composited daily albedo to half-monthly albedo. To reduce uncertainty, previous studies set a constraint on the required minimum number of valid observations per pixel in each composition period (e.g. Mortimer and Sharp, Reference Mortimer and Sharp2018). In this study, however, we found that too many invalid half-monthly composites were obtained when applying this constraint because of persistent clouds in the WNM. As a consequence, the half-monthly albedo was generated by averaging valid daily albedo retrievals within the half-month. Nevertheless, there were still gaps in the half-month composites due to no valid observation at all in some half-month periods. Therefore, we filled these gaps with the average of available pixels in each 3 × 3 window. To avoid more uncertainties caused by overfill, this gap-filling procedure was iterated twice for each half-month product. This procedure improved the percentage of valid pixels in winter by 8% and in some periods the improvement was up to 20–40%. After this step, the percentages of valid pixels in each half-month were >95%, which was sufficient to capture the spatiotemporal features of regional albedo. The seasonal, that is, spring (March–May), summer (June–August), autumn (September–November) and winter (December–February), and annual albedo datasets were generated by averaging the half-monthly albedo in each pixel.
WNM aggregation and uncertainty estimation. WNM albedo ($\bar{\alpha }$ ) in each period is calculated by averaging the albedo of valid pixels in the entire region, while WNM trend ($\bar{b}$
 ) is firstly calculated by linear regression for each pixel and then averaged to estimate the trend for the entire WNM region:


where α i and b i are albedo and its trend of each pixel and N is the number of valid pixels in the WNM. We then apply the standard deviation of albedo ($\sigma _\alpha$ ) and of its trend (σ b) as a metric to characterize their spatial variability, i.e.:


We use the standard errors of WNM albedo ($\overline {\sigma _\alpha }$ ) and of WNM trend ($\overline {\sigma _b}$
 ) to evaluate whether observed differences in averages of the entire WNM were significant. These statistics are calculated as:


4.3 Driving factors
The geospatial datasets on candidate driving factors have different spatial resolutions. We assumed that the values are uniform within each pixel for further analysis, without attempting to downscale these datasets from their original pixel size to 500 m (the latter is the spatial resolution of albedo). We selected all pixels within the glacier boundaries and aggregated them to regional averages as done with albedo (Eqns (3) and (4)). The Pearson correlation coefficient (R) was calculated to analyze their region-wide relationship with glacier albedo in five periods (annual and four seasons). The periods of the analyses of meteorological variables, annual and seasonal PM2.5 concentration, respectively, are 2001–2018, 2001–2016 and 2014–2020 because of the limited available data (see Section 3 and Table 1).
5. Results
5.1 Spatiotemporal variability of glacier albedo
5.1.1 Annual glacier albedo and its trend
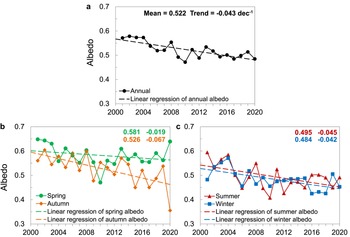
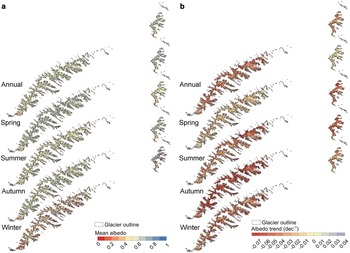
Overall, the annual albedo had a multiannual variability and a significant decreasing trend in 2001–2020 (Fig. 3a). The mean regional albedo was 0.522 ± 0.002 (Mean ± $\overline {\sigma _\alpha }$ ) with the highest albedo observed in 2002 (0.578 ± 0.002), while the lowest one occurred in 2010 (0.472 ± 0.002). The mean albedo in the northern region was 0.508 ± 0.003, i.e. lower than that in the southern region (0.527 ± 0.002), which could be a reason why glaciers in the northern region have been melting faster after 2000 (Li and Lin, Reference Li and Lin2017; Ren and others, Reference Ren2020). Two distinct spatial patterns can be noticed in the annual albedo (Fig. 4a): (1) it gradually increased from the glacier margins toward the glacier center since rocks and dusts are more abundant in the glacier margins; (2) small glaciers tend to have low albedo due to being located at lower elevation, with the ablation zone being a larger fraction of the total extent of a glacier. The annual regional albedo decreased by 15.2% from 0.571 in 2001 to 0.485 in 2020, the mean rate of change was −0.0431 ± 2 × 10⁻⁴ dec−1 with 80% of the pixels having a rate between −0.06 and −0.03 dec−1, indicating strong decreases in most of the WNM. The annual rates of decrease in the northern and southern WNM were generally similar (Table 2).

Figure 3. Time series of regional albedo for (a) annual and (b and c) four seasons in the WNM of the Tibetan Plateau during 2001–2020. The ‘Mean’ and the ‘Trend’ are respectively the spatial average of mean albedo and trend in the past 20 years presented in Figure 4.

Figure 4. Maps of annual and four seasonal (a) mean albedos and (b) albedo trends in the WNM of the Tibetan Plateau during 2001–2020.
Table 2. Mean glacier albedos and their trends in the WNM of the Tibetan Plateau during 2001–2020

$\sigma _\alpha$ and σ b are the standard deviations of albedo and of its trend (Eqns (5) and (6)), $\overline {\sigma _\alpha }$
 and $\overline {\sigma _b}$
 are standard errors of albedo and of its trend in the region (Eqns (7) and (8)). R 2 and p-value are regional mean determination coefficient and significance test of linear trends, respectively.
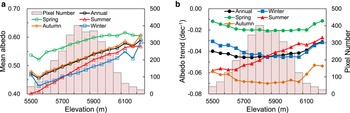
We also calculated the mean albedo and albedo trend in each 50 m elevation bin to analyze their relationships with the glacier elevation (Fig. 5). The pixels located in the <2.5 and >97.5% quantiles of elevation were removed due to limited observations. Although there are some fluctuations due to mountain shadows (Fig. S3a), annual mean albedo generally presents a significant positive correlation with glacier elevation (Fig. 5a), which may be explained by the abundance and depth of snow at higher elevation. However, the annual albedo had a maximum decreasing trend of about −0.045 dec−1 in the 5700–5900 m elevation range, close to the ELA. No large change was observed at higher elevation (Fig. 5b).

Figure 5. The distribution of (a) the mean albedo and (b) albedo trend in each glacier elevation bin in the WNM of the Tibetan Plateau during 2001–2020.
5.1.2 Seasonal glacier albedo and its trend
Maps of the multi-year mean albedo and its trend in the four seasons are generated (Figs 3, 4 and Table 2). First of all, the spring and autumn albedos were higher due to longer snow retention in these two seasons (Zhang and others, Reference Zhang2013, Reference Zhang, Kang, Cuo and Qu2016). Winter albedo was lower due to larger mountain shadows, as discussed in Section 6.1. The differences in seasonal albedos can be very large in some years (Fig. 3), in 2015, for example, the difference between the spring and autumn albedos was 0.137, very large compared with the mean annual albedo in the same year (0.494). Secondly, all seasonal albedos decreased during the last 20 years (Fig. 3 and Table 2) but at different rates. Spring albedo had the slowest decreasing rate (−0.0190 ± 2 × 10⁻⁴ dec−1), indicating an early start of the ablation season, while autumn albedo experienced the fastest reduction with a change rate of −0.0667 ± 3 × 10⁻⁴ dec−1, indicating a delayed ending of the ablation season. However, the seasonal trends in some regions were not significant, which underscores that these seasonal differences still need further study.
Albedos in all seasons generally gave a positive correlation with elevation, summer albedo is smallest at elevations below ELA due to snow disappearance and bare-ice exposure (Fig. 5a), which is also the reason why summer albedo is the smallest of all seasonal albedos after removing the effect of mountain shadows (Section 6.1). Likewise the annual albedo, a decreasing trend was observed for all the seasonal albedos in all elevation bins (Fig. 5b). During summer, continuous glacier retreat and mass loss related to LAIs and associated with the exposure of debris resulted in the largest change to occur at lower elevation. In other seasons, the increase of the snow line elevation (e.g. Tang and others, Reference Tang2020) and ELA (Ren and others, Reference Ren2021), due to the warmer atmosphere, was associated with a strong reduction in albedo at mid-elevations, indicating that the ablation region had extended to higher elevations. In addition, high elevations (>6000 m) did not exhibit strong albedo changes, indicating that snow metamorphism can reduce albedo but not as much as a decrease in the snow line elevation.
Some differences between northern and southern regions were also observed in seasonal albedos. In winter and autumn, albedo in the northern region was lower than that in other regions, while it was similar in spring and summer (Table 2, Fig. 4a). The temporal trends are also different, i.e. summer albedo decreased more rapidly in the northern region, especially around the Zhadang Glacier, while in winter it was the other way around (Table 2, Fig. 4b). In spring and autumn, these differences were small in both regions (Table 2). Although the findings in both regions still have uncertainties due to the errors in the retrieved albedo and in the obtained trends, to some extent, they have proven that local change of albedo is also due to terrain-related effects, which is explained in Section 6.1.
According to in situ daily albedo in Zhadang Glacier (Zhang and others, Reference Zhang2013, Reference Zhang, Kang, Cuo and Qu2016), glacier albedo showed large temporal variability, especially in summer to early autumn due to frequent snowfall events and rapid melting. The weekly albedo appeared to be a rather noisy signal, so that in this paper we show half-monthly values averaged over 2001–2020 and half-monthly trends to explore seasonal variability (Fig. 6). The seasonality of glacier albedo in the WNM had four stages: two maxima around April and November due to snowfall and long-term snow retention in these seasons, and two minima in July–August due to glacier ablation and December–January due to snow sublimation and metamorphism (Fig. 6a). Although albedo decreased in all periods, a large difference in the rates of decrease was observed in the range from −0.0823 to −0.0058 dec−1 (Fig. 6b). Overall, the albedo in the months dominated by westerlies, i.e. January to April, showed a smaller change, while in the monsoon and post-monsoon months, that is June to November, decreased rapidly.

Figure 6. Seasonality of regional mean albedo (a) and rate of change (b) during 2001–2020 in the WNM of the Tibetan Plateau. In each bin in (a), the red line represents the median, the blue box represents the 25th and 75th quantiles, the dashed line represents the maximum and minimum and the red cross represents outliers, respectively. The albedo is regarded as outlier if it meets |albedo – 25th/75th quantile| > 1.5 × (75th quantile – 25th quantile).
5.2 Driving factors of trends in glacier albedo
5.2.1 Annual trends and driving factors
With continuous drying (−42.3 mm dec−1 for rainfall and −41.6 mm dec−1 for snowfall) and warming (+1.0°C dec−1) (Fig. 7, Table 3), glacier albedo showed a decreasing trend in the WNM, indicating that these three meteorological variables were important drivers of glacier albedo. This was evident in 2004–2008 when fluctuations in albedo matched closely fluctuations in these variables. In 2008, especially, air temperature changed by −13.6% and snowfall by +86.9% compared with 2007, which led to a 6.3% increase in albedo. Significantly high correlations further indicated the importance of these variables in driving glacier albedo.

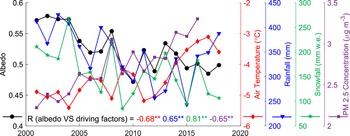
Figure 7. Time series of annual glacier albedo, annual air temperature, rainfall and snowfall in 2001–2018 and PM2.5 concentration in 2001–2016 in the WNM of the Tibetan Plateau. R shown in the lower left corner is the Pearson correlation coefficient between glacier albedo and driving factors, ** indicate significance at 99% level, and the red, blue and purple numbers apply to air temperature, precipitation and PM2.5 concentration, respectively.
Table 3. Mean and trend of regional air temperature, rainfall, snowfall and PM2.5 concentration and their correlations with glacier albedo in the WNM in five periods

R 2 is the determination coefficient of linear trend of driving factors, R is the Pearson correlation coefficient between glacier albedo and driving factors, ** denotes significance at 99% level. The rainfall in winter was not considered since no rainfall happened, and the trends of seasonal PM2.5 concentration were not calculated because of too short period (only 6 years).
Atmospheric PM2.5 concentration in the whole WNM experienced a significant increasing trend with +0.6 μg m−3 dec−1, and increased from 2.22 μg m−3 in 2001 to 3.30 μg m−3 in 2016 (Fig. 7, Table 3). The R between albedo and PM2.5 concentration was −0.65 and only slightly smaller than that between albedo and temperature (−0.68), which indicates that anthropogenic emission was also an important driving factor. In addition, PM2.5 concentration showed a clear relationship with albedo after 2010, which suggests that LAIs emissions may have been playing a more important role in the evolution of glacier albedo in recent years. However, this result indicates a possible relationship, since the PM2.5 grid data used here showed the concentration in the atmosphere instead of deposition on the glacier. Thus, the impact of LAIs on albedo remains to be verified using more data.
5.2.2 Seasonal trends and driving factors
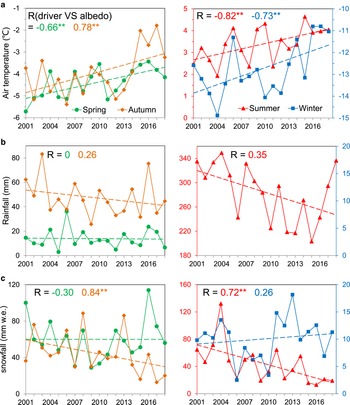
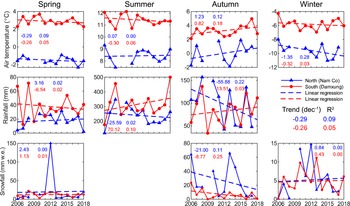
Significant differences can be noticed in the seasonal trends of three meteorological variables (Fig. 8, Table 3). Air temperature increased in all seasons, with a higher rate in winter and autumn and much smaller rate in spring and summer (Fig. 8a, Table 3). Consistently with the weakening monsoon and the strengthening westerlies described in the Introduction, both summer and autumn precipitation (rainfall and snowfall) decreased, while spring and winter precipitation remained constant or slightly increased (Figs 8b, c, Table 3). The patterns in albedo were in good agreement with precipitation and temperature. First of all, both had consistent fluctuations in most years. Furthermore, correlation analyses also show that the driving factor of spring and winter albedo was air temperature only, since the R with air temperature was >0.65 versus <0.3 with rainfall and snowfall, while summer and autumn albedo were controlled by both snowfall and air temperature with R > 0.7. Compared with Wang and others (Reference Wang, Ye, Cui, He and Yang2014, Reference Wang, Cui, He, Zhang and Yan2015), who found that precipitation was an important driver of summer albedo in the Dongkemadi glacier of the central Tibetan Plateau, this study gives a further understanding that solid precipitation (snowfall) has a stronger impact on summer albedo. As mentioned before, snow sublimation and metamorphism in spring and winter were the dominant processes in these seasons and were controlled by air temperature, while glacier ablation and mass replenishment in summer and autumn were controlled by both temperature and snowfall, thus resulting in different dominant drivers in different seasons. However, the meteorology in the glacier region may be different from the CMFD observations due to its coarse resolution, which hampers an accurate understanding of albedo drivers.

Figure 8. Temporal variability of seasonal (a) air temperature, (b) rainfall and (c) snowfall in the WNM of the Tibetan Plateau during 2001–2018. Note that rainfall in winter was not plotted because it was nihil. ** indicates significance at 99% level.
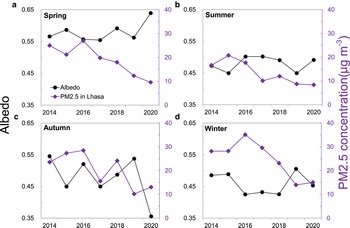
The concentration of PM2.5 was the highest in winter, followed by spring and autumn, and the lowest in summer (Fig. 9, Table 3). This finding is consistent with Zhao and others (Reference Zhao, Ming, Sun and Xiao2013b) who found that in the WNM carbonaceous aerosols were more abundant in the off-monsoon than that in the monsoon season. The aerosol observations at the Nam Co station also show that aerosol concentration was very high in spring, especially in April (Li and others, Reference Li2020b). Correlation analysis shows that anthropogenic emissions had larger influence on spring and winter albedo. There is a clear response of glacier albedo to PM2.5 concentration in spring (R = −0.64), followed by winter (R = −0.43), and no significant relationship in summer and autumn (|R| < 0.2). The most apparent change occurred in 2015–2016 when glacier albedo declined dramatically with the rapid rise of PM2.5 concentration in spring and winter (Figs 9a, d). The distance from Lhasa to the WNM is just ~100 km, thus the dominant S–SE wind in spring can indeed transport PM2.5 to the WNM as well as black carbon from biomass burning in South Asia (Cong and others, Reference Cong2015). Besides, a recent study also indicated that Arctic sea ice loss in winter can transport aerosols to the inner Tibetan Plateau in April (Li and others, Reference Li2020b), which may be another reason for albedo reduction in the WNM. However, long-term observations in the glacier region remain necessary to further understand the relationship between glacier albedo and LAIs.

Figure 9. Temporal variability of seasonal PM2.5 concentration in Lhasa and glacier albedo in the WNM of the Tibetan Plateau during 2014–2020.
5.2.3 Spatial driving factors
We attribute the albedo difference between northern and southern regions to patterns in meteorological conditions caused by terrain. Since the precipitation in the WNM is mainly due to inflow of moist air from the south by Indian monsoon, the high Nyainqentanglha Mountains can block the movement of water vapor and clouds to the northern region, thus resulting in different meteorological conditions in these two regions. To confirm this, we used the observations during 2006–2018 at the Nam Co station (northern region) and the Damxung station (southern region) to preliminarily investigate these differences (Fig. 1). Indeed, the mean precipitation (rainfall and snowfall) at Damxung was larger than that in Nam Co (Fig. 10). More abundant precipitation replenishes glacier mass and cools glacier, and more clouds reduce solar shortwave irradiance and absorbed energy, thus weakening melting and leading to higher albedo in the southern region. Consistently with the study of Yu and others (Reference Yu2013), the drying and warming rates are slower in the southern region, especially in summer when different trends are observed (Fig. 10). The slower drying and cooling slowed-down the decrease in summer albedo in the southern region (Fig. 4b, Table 2). Likewise mass balance, albedo is also determined by the terrain, both directly by the orientation of glacier facets, and indirectly by local meteorological conditions related to terrain (Yu and others, Reference Yu2013). However, because of the limited representativeness of station observations with only two meteorological stations, gridded data with high spatial and temporal resolution are still needed to capture different weather conditions on both slopes.

Figure 10. Temporal variability of seasonal air temperature (a), rainfall (b) and snowfall (c) observed at ground stations on a north-facing slope (Nam Co station) and a south-facing slope (Damxung) in the WNM of the Tibetan Plateau during 2006–2018. Dashed line is linear regression and R 2 is the determination coefficient. Note that rainfall in winter and snowfall in summer were not plotted because they were nihil. There are gaps in the observations at the Nam Co station.
6. Discussion
6.1 Sources of uncertainty
The pattern of albedo and analysis of driving factors are mainly affected by: (1) retrieval method which determines the accuracy of glacier albedo; (2) cloud cover that reduces the number of valid retrievals of glacier albedo; (3) adjacent terrain facets and mountain shadows that can lead to the error of measured solar shortwave irradiance at a target; (4) coarse resolution, limited representativeness and independent analysis of meteorological variables and LAIs that reduce the reliability of the analysis of driving factors.
Accuracy of retrieved glacier albedo. The main purpose of this study is to explore the spatial and temporal variability of glacier albedo, thus we need to characterize the uncertainty of retrieved albedo in both the space and time domains. As regards spatial uncertainty, we compared albedos retrieved from L8/OLI reflectance data and albedo derived from MODIS reflectance data on 29 September 2020 (Fig. 11). The method to retrieve L8/OLI albedo is similar with that based on MODIS data but with a different conversion of narrowband to broadband albedos, and the details can be found in Ren and others (Reference Ren2021). We selected albedo on this day because of the low cloud cover and high spatial variability at the end of the melt season, and then we averaged the L8/OLI albedos in each 500 m × 500 m grid (the spatial resolution of MODIS) to match MODIS footprint. Consistently with the experiment at the Parlung No.4 Glacier conducted by Ren and others (Reference Ren2021), the MODIS-derived albedo was lower than L8/OLI-derived albedo, while the variations with elevation were very similar, i.e., both were positively correlated with elevation. The differences in mean albedo retrieved with L8/OLI and MODIS data for each elevation bin were significant. It is difficult, however, to conclude that the accuracy of MODIS albedo is poorer because the range of albedo in each elevation bin is large, leading to an overlap in the spread of L8/OLI and MODIS retrievals. Moreover, large-scale differences between MODIS and L8/OLI caused by heterogeneity and complex terrain on the glacier surface can also explain this albedo difference (Ren and others, Reference Ren2021). In any event, this experiment indicates that our retrieved spatial pattern of albedo is reliable.

Figure 11. Comparison of retrieved albedos using L8/OLI and MODIS data in each elevation bin in the WNM on 29 September 2020. The error bar is equal to one standard deviation in each elevation bin.
As regards temporal uncertainty, we evaluated the temporal evolution of the half-monthly albedo retrieved from MODIS reflectance by comparing it with in situ observations on the Zhadang Glacier (Fig. 12). The in situ albedo was calculated as the ratio of the upwelling and the downwelling shortwave radiation fluxes measured by Campbell NR-Lite Net Radiometers installed at an automatic weather station (AWS) (Figs S2–3). The sampling interval was 10 min and the observation period was from January 2011 to July 2014 (Zhang and others, Reference Zhang, Kang, Cuo and Qu2016). We used the mean albedo during midday (11:00–13:00) to match the acquisition time of MODIS-derived albedo. The result shows that there are four gaps only out of 88 half-monthly samples in our retrievals in January 2011–August 2014. Although large differences are observed when albedo is >0.5 due to mountain shadow, mixed MODIS pixels (Figs S2–3) and absorption by clouds in the infrared spectrum, our results show a good agreement with field observations (R = 0.86) in the temporal domain and can capture the fluctuations of glacier albedo very well, such as the fast decrease in summer.

Figure 12. Time-series of half-monthly retrievals of glacier albedo by this study and in situ observations during January 2011–August 2014 in the Zhadang Glacier. R is Pearson correlation coefficient between these two time series of albedo.
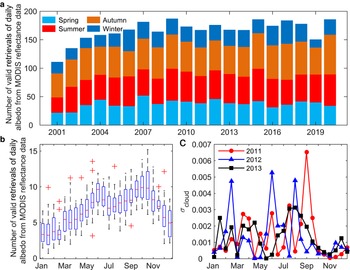
Effect of cloud cover. Cloud cover has been one of the main obstacles to accurately investigate long-term variability of glacier albedo (Brun and others, Reference Brun2015; Davaze and others, Reference Davaze2018; Williamson and others, Reference Williamson, Copland, Thomson and Burgess2020). In fact, cloud cover has not only an impact on the values of retrieved albedo but also its temporal distribution. First of all, in the past 20 years, the annual mean number of valid retrievals of MODIS daily albedo derived by our improved method was more than 150 (days), except for 2001 and 2002, because MODIS/Aqua data were available only after July 2002 (Fig. 13a). This means we can get one albedo retrieval almost every other day, which is sufficient for a reliable assessment of long-term albedo variability.

Figure 13. Number of valid retrievals of daily albedo from MODIS reflectance data (a) in each season and (b) in each half-month during 2001–2020 in the WNM of the Tibetan Plateau, and (c) glacier albedo errors caused by cloud cover (Eqn (9)). In each bin in (b), the red line represents the median, the blue box represents the 25th and 75th quantiles, the dashed line represents the maximum and minimum and the red cross represents the number of valid daily albedo in extreme conditions, respectively. The extreme condition is defined if the number meets |number – 25th/75th quantile| > 1.5 × (75th quantile – 25th quantile).
Secondly, valid daily retrievals in autumn were most frequent, followed by summer and spring, while are scarcer in winter (Fig. 13b). In order to quantify the effect of cloud cover on seasonal albedo, we conducted an experiment by assuming that clouds occurred randomly. Since the experiment required continuous daily albedo (i.e. ‘true’ daily albedo) all year round, we used in situ measurements of daily albedo during 2011–2013 on the Zhadang Glacier to carry out this experiment. The procedure included three steps: (1) we calculated the average of albedo in each half-month using in situ measurements approximately as ‘true’ dataset (α true). (2) We randomly removed some albedo values by assuming they were affected by clouds, and calculated the half-monthly albedo again as ‘experiment’ dataset (α experiment). (3) We used absolute difference between α true and α experiment to quantify the impact of cloud (σ cloud):

The number of cloudy days referred by this experiment in each half-month was equal to the average of invalid retrievals of MODIS daily albedo due to cloud in 20 years, and the experiment was executed 100 times by randomly removing albedo values from the time series of in situ measurements for stable evaluation. The result shows that the σ cloud is generally <0.003, and larger in summer and autumn because of large fluctuations of albedo caused by frequent snowfall, while smaller in winter and spring due to stable albedo even though with heavy cloud cover (Fig. 13c). Since these errors, i.e. values of σ cloud, are much smaller than glacier albedo (0.2–0.9), the cloud cover should have a negligible impact on the results presented in this study.
Effect of terrain on solar shortwave irradiance. The orientation (slope and aspect) of glacier facets is rather variable due to the complex terrain in our study area. This affects solar shortwave irradiance at a location due to reflection by the surroundings and shadow with a significant impact on retrieved glacier albedo. We took into account the orientation of glacier facets in our correction for the anisotropy of reflectance (see Section 4.1). We did not estimate the contribution of terrain solar shortwave irradiance at a location due to the uncertainty in the spatial aggregation of a high-resolution DEM to the MODIS spatial resolution of 500 m × 500 m. We could not consider the temporal variability in the surface topography of glaciers due to the lack of multi-temporal, high spatial resolution DSMs. We are aware that this may have led to some overestimation in our retrievals of albedo, since terrain solar shortwave irradiance, in combination with the high reflectance of glaciers can be significant (Roupioz and others, Reference Roupioz, Nerry, Jia and Menenti2014). It could be beneficial developing a new retrieval method using DSMs at high spatial and temporal resolution (Ren and others, Reference Ren2021). Furthermore, terrain affects solar shortwave irradiance at a location by casting shadows, which could largely reduce retrieved glacier albedo. For example, in winter, shadows partly cover the MODIS pixel where the AWS is located (Fig. S1d). To assess this effect, we removed shadow pixels and recalculated the regional albedos (Fig. 14). The classification of shadow pixels includes three steps: (1) extracting shadow outlines by applying a 0.1 threshold to the mean reflectance of L8/OLI visible bands, i.e. blue, green and red reflectance <0.1; we used the L8/OLI images near spring equinox, summer solstice, autumn equinox and winter solstice to capture shadow conditions in four seasons (Fig. S1); (2) merging four seasonal shadow outlines to a final shadow outline, referred to as the annual total shadow outline; (3) labeling glacier MODIS pixels as shadow where the shadow fractional abundance was >50%, as estimated using the higher resolution (L8/OLI) outlines.

Figure 14. Comparisons of mean albedo (a) and albedo trend (b) with and without mountain shadow in the WNM and its two sub-regions.
The results showed that the annual total fractional abundance of shadows was 21.6% in the WNM, with 27.4% in the northern region and 19.2% in the southern region, respectively, indicating a larger effect of shadows in the northern region. Overall, shadows mainly reduce the mean albedo, especially winter and autumn albedos (Fig. 14a), as well as result in fluctuations in the pattern of albedo depending on elevation (Fig. 5 and Fig. S3a). Winter albedo was higher than summer albedo (0.512 vs 0.484) after removing shadow pixels. As regards the trend, this effect is very minor and can be neglected (Fig. 14b).
In addition, the interaction between various glacier processes (e.g. heterogeneous mass loss or accumulation, movement and avalanche) and terrain is another source of uncertainty in albedo retrieval. These processes are highly dynamic, and can change glacier terrain, thus resulting in errors in albedo retrieval. In fact, this dynamic interaction makes it difficult to assess the effects on albedo retrieval.
Reliability of estimated trends. We evaluated the significance of estimated pixel-wise trends in glacier albedo and estimated the fractional abundance of pixels with p-value <0.05. The latter was 95.0% for the entire year and 91.5% in autumn, indicating that these two trends are reliable (Fig. 15). On the other hand, the fractional abundance was 56.3% in summer and 55.6% in winter, while it was 4.0% only in spring, indicating a much lower reliability of the estimated linear trend in spring albedo. Indeed, a qualitative assessment of the entire time series showed that spring albedo clearly decreased before 2010 and increased after that, leading to the low p-value associated with the linear trend. Moreover, two decades may be too short to estimate reliable trends in albedo and its driving factors, because of abnormal fluctuations of albedo in some years, such as the very low spring and summer albedo in 2010, the very high spring albedo and the low autumn albedo in 2020. Like the study of Shaw and others (Reference Shaw2021) in the extratropical Andes, extending the temporal coverage of observations, e.g. to three or four decades, could be a good option to increase the reliability of estimated trends, as well as the identification of the driving factors. In addition, glacier albedo is indeed highly variable due to interaction of complex processes, such as snow sublimation, mass loss, exposure of internal debris and LAIs deposition, thus leading to a large inter-annual variability in albedo and less defined trends.

Figure 15. Significance test of annual trend in annual and seasonal albedos during 2001–2020 in the WNM of the Tibetan Plateau.
Analysis of driving factors. Limited representativeness and coarse resolution of data are two main causes of uncertainty in our analysis. On the one hand, the spatial resolution of CMFD is too coarse to match the retrieved MODIS albedo. On the other hand, the data at the two weather stations can hardly represent meteorological conditions in two sub-regions far from glaciers and with a short observation period (2006–2018), which is reflected by the opposite trends in air temperature in winter estimated with the two datasets (Figs 8a, 10a). Similarly, observations of PM2.5 in the urban area of Lhasa may not reveal a seasonal pattern of LAIs in the WNM study area since the distance is too large and station observations may not represent regional concentration. Geospatial data with high spatial and time resolutions, such as satellite retrievals, could be a better option, although the retrieval of aerosol optical depth over land, particularly bright targets, remains challenging, see e.g. Wu and others (Reference Wu, de Graaf and Menenti2017).
Independent analysis of the influence of each driver is another cause of uncertainty. Indeed, the variability of albedo is affected by the interaction of meteorological variables and LAIs, that is the transport of LAIs is controlled by wind speed and direction (e.g. Ran and others, Reference Ran2014), the wet deposition by precipitation and the exposure by snow cover and glacier ablation associated with temperature. Previous studies have found that there are black carbon and dust in the samples of the Zhadang Glacier, indirectly indicating that LAIs can reduce glacier albedo in the WNM (Qu and others, Reference Qu2014; Li and others, Reference Li2020a). However, the effect of LAIs also depends on meteorological variables. For example, LAIs can reduce glacier albedo, but the albedo is still high when long-lasting snow covers the glacier surface, while rainfall can remove LAIs from the glacier surface, thus mitigating their effect. Innovative methods, such as coupling explicitly atmospheric processes and LAIs or high spatial and temporal resolution in situ observations, may be needed to account for this interaction mechanism.
6.2 The impact of glacier albedo on net shortwave radiation
Glacier albedo directly determines NSR at the glacier surface, which then drives the glacier energy and mass balance. We applied our albedo derived from MODIS reflectance data in combination with the GLASS DSR product to preliminarily estimate NSR and its trend. We assumed that the DSR was uniform within a 5 km × 5 km grid, i.e. the spatial resolution of the GLASS DSR product, while the NSR was estimated using our MODIS albedo retrievals (α) at 500 m spatial resolution:

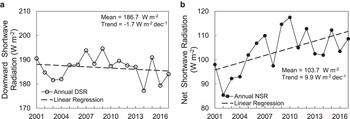
To be consistent with our retrieved MODIS albedo product, we first calculated daily NSR from the daily GLASS DSR and our daily albedo with Eqn (10), and then composited the half-month, monthly, seasonal and annual NSR in the same way as done with the daily albedo (see Section 4.2). The annual trends of DSR and NSR were analyzed only for the period 2001–2017 because the GLASS DSR data currently extend only until 2017 (Fig. 16).

Figure 16. Time series of annual downward (a) and net shortwave radiation (b) in the WNM of the Tibetan Plateau during 2001–2017.
During 2001–2017, the mean annual DSR in the WNM was 186.7 W m−2, and the annual DSR decreased slightly (Fig. 16a), i.e. −1.7 W m−2 dec−1, consistent with the solar dimming found in a previous study (Tang and others, Reference Tang, Yang, Qin, Cheng and He2011). As regards NSR, the average was 103.7 W m−2, increasing on average at a rate of 9.9 W m−2 dec−1, with significantly lower values in 2002–2004 and higher values in several years between 2006 and 2010 (Fig. 16b). Although the DSR showed a decreasing trend, NSR was still increasing due to albedo decline (Fig. 7). On the other hand, the correlation between NSR and albedo was also much higher than that between NSR and DSR (|R| = 0.95 vs 0.51), further indicating better consistency between the inter-annual variability of albedo and NSR. To some extent, these results underscore the crucial role of glacier albedo in determining the glacier shortwave radiation balance in the WNM, thus the mass balance.
Apparently, the estimated NSR is larger than the in situ observations in the Zhadang Glacier, possibly due to shadow and cloud cover (Zhang and others, Reference Zhang2013, Reference Zhang, Kang, Cuo and Qu2016). Several reasons may account for this: (1) as discussed earlier, shadow can lead to an underestimate of albedo (Fig. 15), thus resulting in errors in the estimated NSR; (2) using clear sky albedo to estimate annual NSR can inevitably lead to errors since albedo may change rapidly due to precipitation under a cloudy sky; (3) GLASS DSR product has a high uncertainty in complex terrain such as the WNM since the DSR is estimated for a horizontal surface. Here, we just qualitatively assessed the effect of glacier albedo on NSR, a quantitative assessment requires a more accurate estimation of NSR, i.e. taking into account topographic effects, and is also necessary to understand in detail the role of albedo in glacier energy and mass balance.
6.3 Comparison with previous studies
Some studies of glacier albedo, both targeting single glaciers and entire region, have been done in the WNM and other regions in the Tibetan Plateau. Qu and others (Reference Qu2014) used the MOD10A1 snow data and found that the albedo of the Zhadang Glacier decreased by −0.03 dec−1 in 2001–2012. The smaller rate of decrease estimated in the first decade indicates that glacier albedo has been decreasing more rapidly in recent years. Quicker increases of the ELA and snowline and more exposure of debris due to accelerated mass loss (Ren and others, Reference Ren2020; Hugonnet and others, Reference Hugonnet2021) may be attributed to the rapid albedo decline in recent years. The results of Ming and others (Reference Ming2015) showed that the glacier albedo in Hindu Kush-Karakoram-Himalaya region decreased by −0.01 dec−1 in 2001–2011, which is much smaller compared with our estimated rate in the WNM. Combined with the study for typical glaciers in Tibetan Plateau and its surroundings (Zhang and others, Reference Zhang, Gao, Kang, Shangguan and Luo2021), albedo in the WNM indeed showed a faster decrease. However, it is difficult to directly compare our results with previous studies due to different study periods or objectives. It is, therefore, relevant to cover a longer period of time and the whole Tibetan Plateau to assess and understand the spatial and temporal variability of glacier albedo.
7. Conclusions
Albedo in the WNM experienced large inter-annual fluctuations in the past two decades, with the mean albedo being 0.552 ± 0.002 and a clear decreasing trend of 0.0431 ± 2 × 10⁻⁴ dec−1, that is, it decreased by 15.2% from 0.571 in 2001 to 0.485 in 2020. Albedo in autumn and in the surroundings of the ELA decreased most rapidly, indicating that both the ablation season and ablation zone of glaciers in the WNM have extended.
Both local meteorological conditions and LAIs are important drivers of glacier albedo in the WNM, but their effects have distinct seasonal differences due to different processes on the glacier surface. Summer and autumn albedos are driven by air temperature and snowfall since both can affect glacier mass change, while winter and spring albedos are mainly driven by air temperature since snow sublimation and metamorphism are mainly affected by temperature. LAIs seem to affect spring albedo only due to high concentration of LAIs and south wind in this season. Local terrain also plays an important role in spatial pattern of regional albedo related to the interaction with meteorological conditions.
According to these findings, the change of albedo and associated energy balance are key drivers of glacier mass loss in the WNM, and should be paid more attention to when investigating the reasons of glacier change. Moreover, meteorological and LAIs observations should be part of the protocol of future experiments. As regards modeling, coupling e.g. the Weather Research and Forecasting (WRF) model and the SNow ICe Aerosol Radiative (SNICAR) model (Flanner and others, Reference Flanner, Zender, Randerson and Rasch2007) would be highly beneficial to quantify the effects of these drivers on glacier albedo.
Supplementary material
The supplementary material for this article can be found at https://doi.org/10.1017/jog.2023.45.
Acknowledgements
This study was jointly supported by the Second Tibetan Plateau Scientific Expedition and Research Program (STEP) (grant No. 2019QZKK0103), National Natural Science Foundation of China project (grant No. 42201144, 91737205), the Chinese Academy of Sciences President's International Fellowship Initiative (grant No. 2020VTA0001) and the MOST High Level Foreign Expert program (grant No. GL20200161002).


 Open access