


Policy Significance Statement
Sophisticated data tools such as dashboards with interactive maps are being used increasingly often for all kinds of policy issues, from COVID-19 to air pollution to traffic monitoring. Policymakers need to understand how their data tools are perceived and used by stakeholders, especially when personal data are involved. Otherwise, the policy could fail or even backfire. In our study, we used surveys and interviews to directly gauge public opinion on COVID-19 dashboards in Hong Kong. We believe that a similar exercise is necessary in other policy contexts to make sure that data tools for policy are effective without invading privacy or compromising security.
1. Introduction
The current COVID-19 pandemic is a rapidly evolving crisis with a high degree of uncertainty. As of July 2, 2021, the global number of cases has surpassed 182 million, with nearly 4 million deaths (World Health Organization, 2021). At such a turbulent time, it is crucial to provide citizens with accurate real-time data on COVID-19. However, this is a more difficult task than it may seem. For one, the data that are generated could be closed to the public or overly technical, making it inaccessible to non-experts. For another, the data could be misinterpreted, leading to widespread misinformation. A third challenge would be integrating a vast amount of health, environmental, and socioeconomic data to produce relevant and meaningful information. Failing to do so correctly would make it difficult to analyze the data, and it would also waste time and money. Therefore, it is important to carefully design information platforms that are easy to update, use, and understand.
Interactive dashboards have become increasingly useful information provision tools across a variety of policy issues. In the context of COVID-19, dashboards have been used extensively to track the spread of the virus. By displaying spatiotemporal data in real time, dashboards could help decision makers and citizens alike to understand the spread patterns of the virus in their localities. Information including the locations of confirmed cases, the health statuses of patients, and the waiting times at hospitals could inform citizens’ decisions regarding their health and safety. Moreover, transparency could build public trust and facilitate collective action during public health crises such as COVID-19 (OECD, 2020).
There is significant potential for COVID-19 data tools, such as dashboards, to build community trust and resilience. In the case of Hong Kong, the population is highly educated with an increasing interest in political involvement and a growing demand for transparency and accountability. Focusing on Hong Kong as a policy context is especially valuable for higher-level insights given the current socio-political climate of the city. Following the events of the anti-extradition bill protests in 2019, public trust in government has reached an all-time low (Lo, Reference Lo2021), and this lack of trust has to some extent impacted the implementation of anti-epidemic measures such as digital contact tracing and vaccine rollouts (Chau, Reference Chau2021; Lu Stout, Reference Lu Stout2021). On a broader level, distrust in the government has also affected citizens’ acceptance of smart city initiatives in general due to fear of the government’s potential misuse and abuse of smart technologies (Hartley, Reference Hartley2021). Understanding citizens’ concerns as well as decision makers’ considerations relative to the design of data technologies is key to developing solutions for data governance that will not only solve the policy issues they were designed to address but will also foster a healthy socio-political environment founded on trust.
With this in mind, the purpose of this study is to answer the question: how should data tools, such as dashboards, be designed and used to manage trade-offs between data transparency and privacy during public health crises? There are two parts to this study. Firstly, we examined the case of COVID-19 dashboards in Hong Kong and its implications for data governance. To achieve this, we conducted surveys and semi-structured interviews to understand the developers’ and users’ intentions and decisions, as well as their perceptions of the impacts of the dashboards. Secondly, similar dashboards of COVID-19 cases from other cities were categorized along with those in Hong Kong in a typological framework based on their levels of data transparency and the risks they pose to data privacy. Finally, we referred to the findings in both parts to make recommendations for salient, credible, and legitimate data policies for public health and beyond.
2. Literature Review
Debates over how personal data should be collected, managed, and used are not new. In fact, personal data have been recognized to hold immense value for a variety of applications, including economic growth, education, and public health (World Economic Forum, 2011; World Economic Forum and Boston Consulting Group, 2013). Jurisdictions around the world have generally adopted one of three policy approaches to regulate the use and transfer of personal data, which, in increasing order of stringency, are light touch or self-regulation, minimum standard setting, and ex-ante requirements (Beardsley et al., Reference Beardsley, Enriquez, Grijpink, Sandoval, Spittaels, Strandell-Jansson, Bilbao-Osorio, Dutta and Lanvin2014). Under normal circumstances where there is no crisis, these approaches and associated laws and regulations have mostly sufficed.
COVID-19 has disrupted traditional decisions regarding the trade-offs between the benefits of open data and risks to data privacy. At this time of crisis, governments often prioritize the disclosure of COVID-19 patient data to protect the health and safety of their citizens over individuals’ rights to privacy. For example, according to a media statement by Hong Kong’s Privacy Commissioner for Personal Data (PCPD, 2020), data privacy breaches may be justified in exceptional cases such as COVID-19, when access to and use of the data would “[safeguard] the physical or mental health concerns of the data subject or any other individual in the interests of the public”. Hence, the data-centric solutions that many governments have adopted to tackle COVID-19 and the problems that follow have led to a massive amount of personal data being collected and disclosed to the public.
This data collection process depends on the willingness of affected citizens, especially COVID-19 patients, to share data with their local governments. However, while there has been literature on expert analyses and appraisals of data platforms such as COVID-19 dashboards (Ivanković et al., Reference Ivanković, Barbazza, Bos, Brito Fernandes, Jamieson Gilmore, Jansen, Kara, Larrain, Lu, Meza-Torres, Mulyanto, Poldrugovac, Rotar, Wang, Willmington, Yang, Yelgezekova, Allin, Klazinga and Kringos2021), and other articles have gauged public opinion on the use of digital data (Grande et al., Reference Grande, Mitra, Marti, Merchant, Asch, Dolan, Sharma and Cannuscio2021) or contact tracing applications for COVID-19 (Samuel et al., Reference Samuel, Roberts, Fiske, Lucivero, McLennan, Phillips, Hayes and Johnson2021; Williams et al., Reference Williams, Armitage, Tampe and Dienes2021; Zhang et al., Reference Zhang, Kreps, McMurry and McCain2020), few studies have collected the opinions of citizens on the data collection process of COVID-19 patients. This is problematic because implementing data technologies without gauging public opinions over data governance could cause the policy to backfire, as demonstrated by the failure to adopt contact tracing applications in the United States due to lack of trust and privacy concerns (Rich, Reference Rich2021).
This study aims to answer the question as to how governments could navigate data governance trade-offs for public health purposes. We focus on COVID-19 dashboards, which are websites or documents that can efficiently share a substantial amount of COVID-19 case data, and we consulted developers and users of these dashboards in Hong Kong to understand the decisions and perceptions surrounding this data. We believe it would be valuable to see if COVID-19 dashboards could bring about opportunities for data governance in Hong Kong that would not only increase community resilience but also re-establish public trust at a time of crisis.
3. Methodology
We designed a bilingual (English and Traditional Chinese) online survey to gauge how users interact with COVID-19 dashboards in Hong Kong. The survey primarily consisted of multiple-choice questions, some of which are 5-point Likert-type questions (see S1 of Supplementary Information for the full questionnaire). One set of questions concerned the users’ experience, perceptions, and behaviors surrounding the data platforms. This included how the users perceive the accuracy and objectivity of the data they are presented, how much the users trust the dashboard and its developers, and how the users change their actions, if at all, after using the dashboards. The other set of questions pertained to the users’ personal information, namely their age and level of education, to see if certain subgroups of the Hong Kong population would respond differently. We also used existing questions on the survey, namely Questions 8, 12, and 13 in S1 of Supplementary Information, to gauge public trust in government data collection. We used the Qualtrics panel service to randomly select a sample population that was representative of Hong Kong’s adult population across age, gender, and education. Survey results were automatically processed in Qualtrics and further processed using Python.
We supplemented the survey results with semi-structured, in-depth phone interviews. Interviewees included willing survey respondents who were dashboard users, as well as developers of the key dashboards in Hong Kong. All interviewees signed an informed consent form prior to the interview. Interviewees who were users of dashboards were recruited via the survey, as respondents who would be willing to participate in a phone interview for this study would provide their email address or phone number in a text box. Respondents who provided their email address in the survey were prompted via email to share their phone number. As for the dashboard developers, we invited representatives of the Centre for Health Protection (CHP) dashboard, the COVID-19 in HK citizen dashboard, and the Coronavirus Dashboard by thebaselab via email to participate in the interviews.
Interviewees from the CHP dashboard, including members of the Development Bureau, Lands Department, Department of Health, and Smart City Consortium (SCC), responded with typed answers. The interviewees of COVID-19 in HK and Coronavirus Dashboard by thebaselab responded to phone interviews. To our knowledge, these three platforms are the only COVID-19 dashboards in Hong Kong that use, display, and frequently update spatiotemporal data. Therefore, our interviews provide a comprehensive understanding of the perspectives of dashboard developers in Hong Kong.
The interviews were conducted in English or Cantonese depending on the interviewees’ preferences. The phone interviews were recorded using a microphone into a laptop computer. Respondents who were too busy for a phone interview provided typed responses instead. In both cases, follow-up questions were answered via email. Direct quotes used in this paper were confirmed by the interviewees to ensure that the meanings of their comments have not been distorted.
We adapted the bilingual interview transcription and interpretation method from Halai (Reference Halai2007). We used NVivo to analyze and code the interviews. The NVivo transcription module was used for transcribing English interviews, and errors by the automatic transcription service were corrected manually. The Cantonese interviews were also transcribed manually. Due to time constraints, transcripts were only written for representative interviews.
We decided to focus on studying dashboards created by developers in Hong Kong for the general public. This eliminated platforms that appeared to target audiences other than the general public, such as the real-time dashboard by the School of Public Health at The University of Hong Kong (2020), from the pool of dashboards that we studied. We found a total of three dashboards that matched our criteria: the official dashboard jointly developed by the CHP and the SCC (2021), the local citizen dashboard “COVID-19 in HK” launched by the vote4.hk team (2021), and the global Coronavirus Dashboard created by Hong Kong app developer thebaselab (2021). We focused more on the dashboards that provided local data, since they would be able to provide more detailed information on the local COVID-19 situation and potentially inform citizens’ everyday decisions. However, we still referred to the global Coronavirus Dashboard by thebaselab when studying COVID-19 dashboards from the developers’ perspective, and other global and local dashboards from other countries emerged in our survey results and interviews, which we briefly discussed.
We also constructed a two-dimensional matrix to compare how city-level COVID-19 dashboards around the world, including those from Hong Kong, balanced data transparency with data privacy. We decided to focus on dashboards at the city scale because larger-scale dashboards, such as global dashboards, would not reasonably share sensitive data of every COVID-19 patient for any discernible purpose. We selected a handful of dashboards from cities with a similar size and economic standing to Hong Kong. For our analysis, the two dimensions were assessed qualitatively. Using data available on the dashboards as well as the interviews with the dashboard developers in Hong Kong, we constructed a typology of dashboards for COVID-19.
4. Results
4.1. Demographic characteristics
Between May 24 and June 21, 2021, we received a total of 804 valid survey responses. Of the respondents, 367 were users of COVID-19 dashboards and 437 were not. The age, gender, and education profiles of the sample population are mostly similar to those of the general Hong Kong population, as seen in Figure 1a–c. However, those aged 55 or above were underrepresented by about 15%, possibly due to there being fewer available members of the panel service in that age group at the time of data collection. Meanwhile, the dashboard users also shared similar gender and education distributions compared to the overall Hong Kong population, but their average age was noticeably younger. This suggests that dashboards are a more popular COVID-19 data tool among younger citizens. In contrast, older citizens would generally prefer more traditional information sources, such as printed newspapers.

Figure 1. The (a) age, (b) gender, and (c) highest level of education of the total sample population (blue), dashboard users among the sample population (yellow), and general Hong Kong population (pink). *The first pink bar represents the 15–24 age group in the Hong Kong population according to census data.
As for the interviewees, we interviewed 11 survey respondents who were users of the dashboards, as well as three representatives from each dashboard in Hong Kong. The respondents varied in age, gender, and race. However, most of the interviewees were aged 18–29 and had at least completed their undergraduate education. Half of the interviewees also had some degree of research experience, which they explicitly shared during their interviews.
4.2. Behaviors related to COVID-19 data
Firstly, we identified three behavioral responses to COVID-19 dashboard use. The first is intellectual proactivity, which refers to the proactive demand for COVID-19 case data. In this case, users are motivated to find detailed case data to inform their estimates of personal risk relative to COVID-19. As for the types of data that were demanded by users, we learned that most of the participants were interested in knowing the number, locations, and types of confirmed COVID-19 cases in Hong Kong (see Figure 2). 175 out of the 367 dashboard users (47.68%) also wanted to know the residence of COVID-19 patients, even though this information may be sensitive. According to the interviews, some users would even actively search for the age, sex, profession, and health condition of the patients. The COVID-19 in HK developer was surprised to know that citizens wanted more data than expected:
“Our website, at first, [was] very simplistic, with very basic information. But later on, we discovered that an ordinary citizen would go, ‘I want to see’, for example, ‘Case 17’, and what age they are, what their sex is, where they live… like they’re looking for very ‘solid’ facts.”Footnote 1
When asked to provide more details as to why people would search for such specific data, one interviewee noted that they wanted to know the whereabouts of the COVID-19 patients prior to testing positive, so that they could deduce where the virus could have potentially spread. Others shared that they wanted to know the demographic characteristics of individual patients so that they could identify potential risk factors that could make a COVID-19 patient likelier to suffer from severe symptoms or even die.

Figure 2. Answers to the question “What information regarding COVID-19 do you usually seek out?” (Question 3 in S1 of Supplementary Information).
Some participants were also physically proactive, such that they changed their plans and activities based on data from COVID-19 dashboards. Notably, 74.11% of the survey respondents who used dashboards did so to locate and avoid high-risk or crowded areas (see Figure 3). Based on this information, users may adjust their daily activities accordingly. For example, one of the interviewees was a business owner, so they had to decide whether to open their office to customers based on the number and location of COVID-19 cases. Another interviewee and their colleagues used the government dashboard to decide whether the severity of COVID-19 in Hong Kong would warrant them working from home. Over 90% also shared that they wear masks. They do so not only to protect themselves but to protect others around them as well. About 80% of the respondents also used hand sanitizers. However, based on the interviews, people use these protective supplies simply because it is good practice, not because the dashboards informed them to do so. Even though the dashboards in Hong Kong do share relevant information about these best practices, including wearing masks, users were either not aware of or not using these dashboard functions.
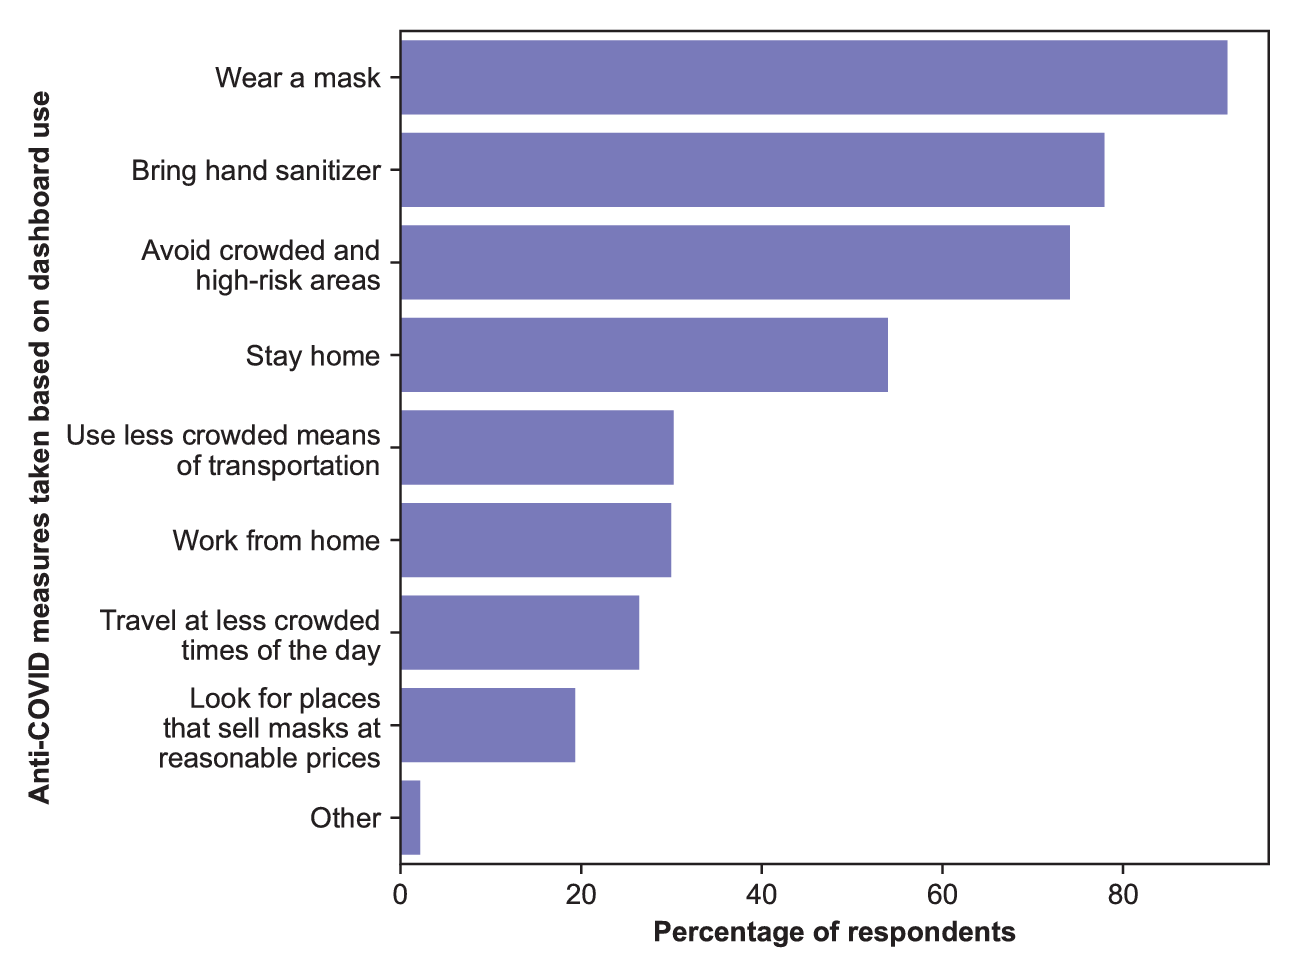
Figure 3. Answers to the question “Based on the information you receive from the dashboards, what actions will you take to protect yourself from COVID-19?” (Question 5 in S1 of Supplementary Information).
Finally, some dashboard users respond to COVID-19 case data with indifference. Indifferent users only occasionally checked the dashboards to retrieve an overview of the COVID-19 situation in Hong Kong. This is because, unlike the proactive users, indifferent users perceived the risk of contracting COVID-19 as constant regardless of geographical location. Some interviewees reasoned that Hong Kong is too small of a city for differences in COVID-19 cases across districts to matter. As such, the data presented on the dashboards would not affect their final decision. Some indifferent users believed that the safest option would therefore be to stay home regardless of the geographical spread of COVID-19 in Hong Kong. Other indifferent users would continue to go out despite the risk, because their perceived risk level of contracting COVID-19 was sufficiently low.
4.3. Public trust and COVID-19 data
We also wanted to know what would impact a user’s decision to use a specific COVID-19 dashboard (see Figure 4). We discovered that, despite the current political turmoil in Hong Kong, most individuals were not concerned about political factors such as the political alignment of the data source, because accuracy often mattered above all else. Users would be concerned if the source used its political biases to distort the accuracy of the information provided. For example, if an anti-government group were to create a dashboard that inflated the numbers of COVID-19 cases to discredit the Hong Kong government, the presented data would be inaccurate, and users would not trust the dashboard. Many interviewees seemed to trust that the government will provide accurate and unbiased COVID-19 data, even if some of them expressed distrust in the government in other circumstances. It is also important to note that the interviewees revealed that they believed several of the factors regarding willingness to use COVID-19 dashboards were interrelated; for example, an accurate dashboard would therefore be trustworthy.

Figure 4. Answers to the question “To what extent do the following factors affect your decision to use a dashboard?” (Question 7 in S1 of Supplementary Information).
Another discussion that arose during the interviews concerned whether a person’s political stance would factor into their decision to use a dashboard, such as if a pro-democracy individual would use a government dashboard despite lacking trust in the government. Interviewees shared that they were indeed willing to use dashboards created by parties whose political ideologies clashed with their own views. At the same time, the degree of politicization mattered more than the political orientation of the source. Thus, even if the developer of a dashboard were to share a similar political stance to the users, the users would still critically assess the source and dismiss comments that they consider to be biased. In some cases, excessive politicization may even deter the individual from using the dashboard at all. This is because, similarly to the survey results, the interviewees overwhelmingly prioritized the accuracy of information above all else. Therefore, they would trust an accurate dashboard from any developer more than a biased dashboard from a developer whose political beliefs aligned with their own.
We wanted to know whether this same level of trust was present if the users were to hypothetically provide personal information to both dashboards. About 80% of the 367 dashboard users among the sample population were generally hesitant to provide data to either the government dashboard (see Figure 5a) or the citizen dashboard (see Figure 5b). This distribution changed drastically depending on whether the respondents indicated that they were concerned over the government collecting their data. More than 90% of the 144 survey respondents who would not want their data to be collected by the government were, at most, moderately willing to share their data to either dashboard At the same time, the proportion of users who would be slightly or not at all willing to share data decreased from half to one-third if they were to give their data to the citizen dashboard rather than the government dashboard. According to one interviewee whose survey responses matched this scenario, they had lost faith in the government and would rather provide relevant data to a citizen group or expert they trusted. Meanwhile, about 80% of the respondents who would be absolutely or very willing to share data with the government dashboard were not worried about their data being collected by the government. Such individuals believed that the government dashboard would be more reliable than a third-party dashboard in terms of data collection.

Figure 5. Distribution of answers to the questions “to what extent would you be willing to provide personal information to [(a) the government dashboard or (b) the citizen dashboard]?” (Questions 8 and 9 in S1 of Supplementary Information). Results were processed for all dashboard users (darkest slices), users who would not like the government to collect their data (slightly lighter slices), and users who are not concerned about the government collecting their data (lightest slices).
All the interviewees also mentioned that their willingness to share data depended on trust. In some cases, users were willing to share data to a dashboard if the developer was a group they trusted. Some interviewees trusted the government, especially public health departments and bureaux, to store and use their data. In contrast, they were less likely to entrust a citizen group or an unfamiliar organization with their data. Two other interviewees were reluctant to share information with the government. One of the two interviewees noted that they would be more comfortable with providing data to the government if the government specifically stated how the data would be used, because they believed that they would be protected by law if the government violated the terms of data use. The other interviewee stated that they would not want to share data with the government unless absolutely necessary, because they had lost faith in the government following the events of the anti-extradition bill protests. The latter interviewee was the only one who would be more willing to share data with citizen groups or individuals who they believed had good intentions. Yet another interviewee shared that they would trust some governments, including the Hong Kong government, more than other governments in handling their data. Therefore, overall, the reasons for trusting one dashboard over another were mixed.
4.4. Privacy concerns surrounding COVID-19 and personal data
The results reveal another concern that Hong Kong citizens have regarding data privacy and security (see Figure 6). Over 70% of survey respondents wanted to protect their own privacy by not providing their personal data. Almost 60% shared that they were worried about their personal data potentially being leaked. About 40% of the respondents also shared that they wanted to protect others’ privacy, and a similar proportion did not want to share personal data with the government.

Figure 6. Answers to the question “What are reasons you would not be willing to provide personal information?” (Question 12 in S1 of Supplementary Information).
The most effective method to relieve these concerns according to the survey results would be to delete the stored data after a specified period of time. Another solution would be to explain the purpose of data collection. For example, one respondent specified that they would be more likely to provide their personal data if the party collecting the data were someone they trusted, such as a medical professor. In this case, with the informed consent of the people involved, it may be possible to keep the data for a longer period of time, provided that the data are used purely for the indicated purposes. Other factors that could reassure a user when they provide their personal information include making sure that the data are anonymous or de-identified, or being under a trustworthy political system.
The types of data that users were hypothetically willing to provide to a COVID-19 dashboard were also mostly data that did not involve personal identifiers, further supporting the fact that Hong Kong users significantly value data privacy (see Figure 7). People were generally willing to share their health data (59.13%), who they had close contact with (53.13%), and relevant personal experiences (52.59%). People were much more reluctant to provide potentially sensitive or identifying data such as their location data (41.14%), contact information (40.60%), name (32.43%), identification details (6.54%), and family information (4.09%). According to the follow-up interviews, individuals were uncomfortable with sharing such information because they believed it would be irrelevant, or that the government should already have this information on hand. Meanwhile, if they were to provide data to a dashboard by citizens or other third parties, those parties should not have any reason to collect such sensitive information.

Figure 7. Answers to the questions (a) “What types of personal information would you be willing to provide” and (b) “What other types of information would you be willing to provide” (Questions 10 and 11 in S1 of Supplementary Information).
Some users were uncomfortable with the fact that identifying characteristics were being shared with the public on COVID-19 dashboards, as they believed that it may be possible to re-identify confirmed COVID-19 patients based on the presented data. In fact, as one interviewee pointed out, one COVID-19 case had so much detail that they “could easily find out who that person is,” especially in a close-knit community such as a small village in Lantau Island. Since the identifying information and location data of the patients’ residences are readily available, it could theoretically be possible for anyone to not only re-identify the patients but also figure out where they live, thereby posing a security risk. Some people were also concerned over potentially stigmatizing COVID-19 patients, either for being infected with COVID-19 or for having any underlying health conditions or bad habits that would make them more susceptible to severe symptoms or death from COVID-19.
There could also be a cultural element to users’ perceptions of privacy risks. For example, the interviewees who were concerned about re-identification risks and data privacy had previously lived in Western countries. One interviewee commented:
“In Canada, I cannot imagine them identifying […] ‘55-year-old male who lives on this street’ […] Not even the house number or their apartment building number, but on ‘this’ street or in ‘this’ neighbourhood. […] I’m not sure that everyone in Hong Kong needs to know […] the age and gender of every patient or the building that they’re in.”
In contrast, two dashboard users that were from Hong Kong and India were interested in understanding the COVID-19 cases in more detail, whether it is the patients’ health conditions or their age and sex. With such a narrow pool of interviewees, it may be premature to make such a generalizing conclusion, but differences in culture may affect whether users prioritize data transparency or data privacy. Other studies have also explored how culture and history may influence perceptions of privacy, data privacy, and relevant policies (Ess, Reference Ess2005).
It is important to mention several factors that should be considered in relation to this comment. For one, the sample size of 11 interviewees is not sufficient to confirm that there is indeed a correlation between culture and privacy perceptions in the case of COVID-19 dashboards, let alone in general. For another, even if these differences in opinion do exist, contextual details, such as population density and the effectiveness of existing COVID-19 prevention measures, are crucial in deciding the appropriate extent of COVID-19 data disclosure. For example, most Hong Kong citizens live in high-rise buildings with hundreds of units, in contrast to Canadian citizens in the suburbs where one street may only have about 20 housing units. Thus, disclosing the residential building where a COVID-19 patient lives in Hong Kong does not pose nearly as high of a privacy risk as disclosing the street where a COVID-19 patient is located in suburban Canada. More research should be done to explore the relationship between data privacy and culture for the sake of adapting data policies to different contexts.
4.5. Capacity for dashboard development
Through the interviews with the developers of the dashboards in Hong Kong, we were able to gather some insights about the capacity needed to create effective data tools for crises such as COVID-19. We identified two intertwined elements that were necessary to ensure that these data platforms were salient, credible, and legitimate: technical expertise and social networks. Technical capacity is imperative to build a functional and easy to use platform with accurate medical data and knowledge, and the involvement of health experts increases credibility. Meanwhile, social networks and interactions are crucial for recruiting individuals with the required expertise and knowledge.
Technical capacity depends on available data infrastructure in the case of COVID-19 dashboards. In Hong Kong, the availability of multiple dashboards was only possible because of the open COVID-19 case data provided by the CHP. Although the CHP has been transparent with its data of COVID-19 cases since the beginning of the outbreak in Hong Kong, the two non-official dashboard developers, as well as other citizens, initially encountered difficulties with managing this data because it was only provided via PDFs. While the government was able to update these PDFs daily, the PDF format was inconvenient for geomapping without heavy reformatting, and it was not useful for visualizing the spread of COVID-19 in Hong Kong. This data is now shared as raw comma-separated values (CSV) files via the open data government website (Department of Health, 2021), and the same data are presented on the three dashboards, indicating that the issues of compatibility and readability have been solved. From this experience, it is evident that open data by itself is not enough, and that careful data formatting and presentation are crucial for better access and use.
Software skills and prior experience are also crucial for every COVID-19 dashboard developer in Hong Kong. For the official government dashboard, the SCC leveraged private company Esri’s ArcGIS technology and their prior experience with SARS case mapping to build the dashboard with data from the CHP. Similarly, the creators of COVID-19 in HK were inspired by a previous student initiative for SARS case mapping, but they recruited a wide variety of citizen volunteers to code, update, and translate the website. Developers from thebaselab used their prior experience with mobile application development to create the dashboard, and they collected user feedback via e-mail to improve the functions of the dashboard. As stated before, both unofficial dashboards benefited from the open COVID-19 case data from the CHP.
Each dashboard developer was able to acquire the necessary technical expertise via their social networks or recruitment methods. The CHP benefited from the practical experience and technological capabilities of Esri China (Hong Kong). COVID-19 in HK depended on not only its volunteers but also the Public Health Research Collaborative (HKPHRC), a research organization that primarily consists of former and current medical students in Hong Kong. The HKPHRC shared their public health knowledge with the developers of COVID-19 in HK to fact-check and share accurate medical information about COVID-19, and they also co-wrote a “COVID-19 for Dummies”Footnote 2 webpage to inform citizens using layman terms. Recruitments for Coronavirus Dashboard were minimal, as the founders of thebaselab already had the necessary programming skills to construct the dashboards, but they depended on their friends as volunteers to update the dashboard with relevant news articles.
Another social element contributing to the success of COVID-19 dashboards is citizen engagement, wherein citizens could interact with the dashboards to provide feedback or crowdsourced data. The dashboards each use different avenues to collect user feedback. The COVID-19 in HK citizen dashboard has the most straightforward feedback method with an embedded Google form on the website. Meanwhile, the CHP dashboard and Coronavirus Dashboard both welcome feedback via email. For the Coronavirus Dashboard, users can locate the email address at the bottom of the web page. In contrast, feedback for the government dashboard is collected via the general email address for the CHP website, which is not mentioned at all on the dashboard itself. Nonetheless, all the developers in Hong Kong have changed the design and functions of their dashboards in response to user feedback.
In the future, technical and social expertise could be further enhanced by encouraging collaboration and fostering knowledge co-creation and policy learning among stakeholders. When the COVID-19 in HK and Coronavirus Dashboard developers were asked if they would be interested in collaborating with the government on improving the existing dashboards or creating a new dashboard for other policy issues, the developers commented that they would be open to collaboration if the government approached them first. The potential for collaboration between citizen developers and public administrators could create a feedback system that could improve the government’s open data policies, and it could create opportunities to increase direct citizen participation in improving government services, including the COVID-19 dashboard. This could even be a first step to regaining public trust, as it would be an open invitation to the policy arena regarding information provision policies.
4.6. Dashboard typology
Finally, we wanted to understand how the developers for the COVID-19 dashboards in Hong Kong decided to confront the trade-offs between the extent of data disclosure and risks to data privacy, compared to those of similar dashboards around the world. The resultant typology is illustrated in Figure 8 with the degree of comprehensiveness as the horizontal axis and the extent of data privacy risks posed to patients and users alike as the vertical axis. The list of COVID-19 dashboards in Figure 8 is not extensive, but we have made efforts to identify a diverse array of dashboards based on the types of data they present and how they present the data. We also made sure to represent a wide range of countries. The complete list of dashboards used in this study is available in S2 of Supplementary Information.
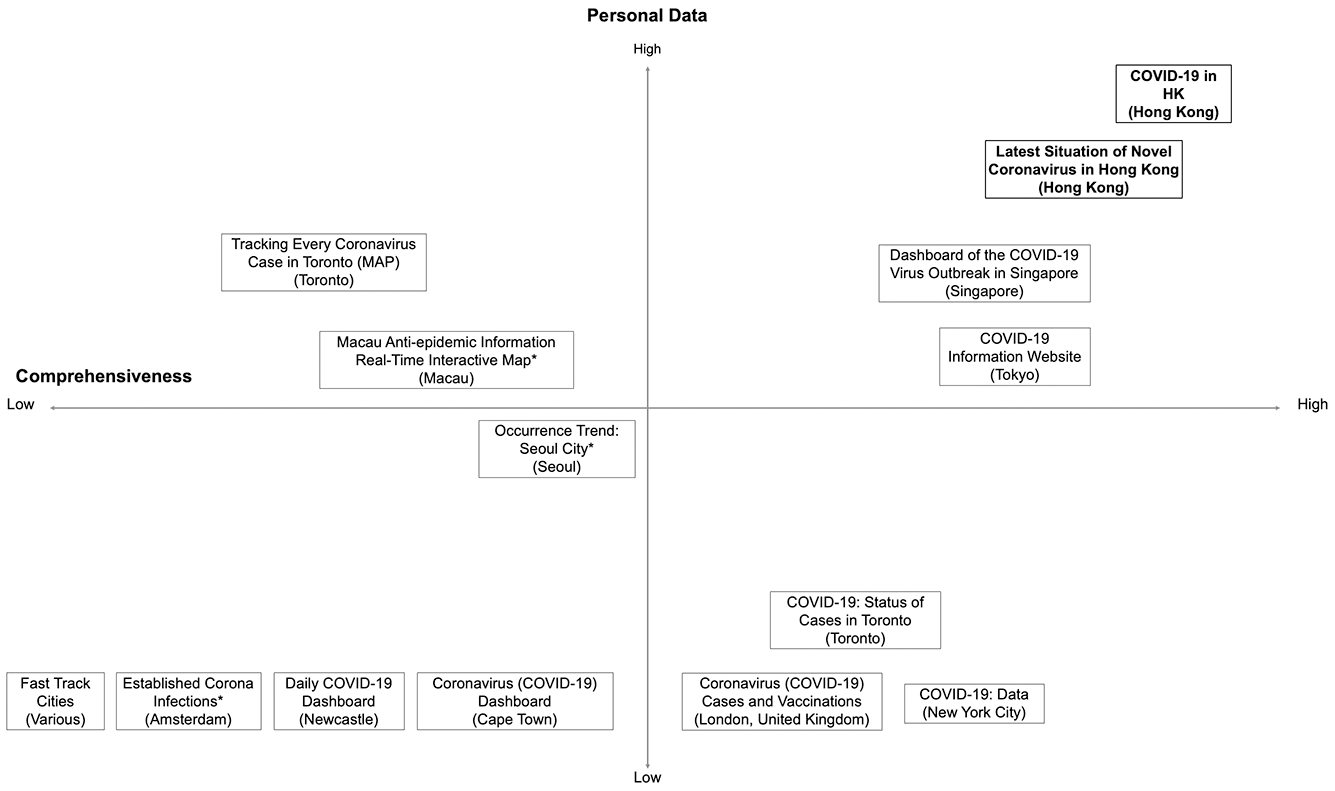
Figure 8. Typology of various COVID-19 dashboards with varying degrees of data disclosure and data privacy risks. Dashboards by Hong Kong developers are highlighted in bold. *Names of these dashboards were translated into English.
The dashboards belonging in the lower left quadrant have a low level of comprehensiveness and low levels of personal data. They serve to provide an overview of the local COVID-19 situation, rather than to highlight specific cases and their characteristics. Therefore, these dashboards tend to only show a city’s COVID-19 case data at an aggregate level, such as the total number of confirmed cases over time, the total number of deaths, and the density of cases in different municipalities or districts. The exception is the Occurrence Trend website for Seoul City, which has data on the districts, health statuses, and travel histories of individual cases, but identifying information such as age and occupation have been omitted (Seoul Metropolitan Government, 2021). This dashboard follows the Guidelines for Disclosure of Information such as Movement Routes of Confirmed Patients in South Korea, which stipulates that the government should not disclose personal data such as age, gender, nationality, or residence of COVID-19 patients (Seoul Metropolitan Government, 2021).
The dashboards in the lower right quadrant display more data analytics regarding cases, tests, vaccinations, and deaths. Examples of data insights include breakdowns of cases by demographic properties such as age, gender, and race or ethnicity, as well as by more detailed geographic locations such as ZIP codes, schools, and residential homes for the elderly. Even with this higher level of detail, the dashboards still do not share any personal data, hence their lower position on the matrix. The insights from these dashboards allow visitors to understand patterns and trends of COVID-19 cases and vaccinations more clearly, and personal data are not needed to achieve this objective.
In contrast, the dashboards located in the upper left quadrant show less varied data, but the data they do show include personal data. Both the Toronto and Macau dashboards in this quadrant share the age, gender, location of origin, and health status of each case. The dashboard Tracking Every Coronavirus Case in Toronto (MAP) by journalist Ainsley Smith (Reference Smith2020) even mentions how cases are related to each other, as well as where each patient underwent isolation. As for the Macau dashboard, it shares the locations that have previously been visited by COVID-19 patients, but the locations are mapped without being associated to specific individuals (Netcraft Information Technology, 2020). These dashboards focus on providing anonymous profiles of COVID-19 patients for users’ reference.
Finally, the top right quadrant encompasses dashboards that are rich in aggregate and individual case data. The COVID-19 Information Website by the Tokyo Metropolitan Government (2021) is in this quadrant because it includes data categories that are not present on other dashboards, such as the number of calls to COVID-19 call centers, and it shares the age, gender, and occupation of individual COVID-19 patients. Even so, it is located at the bottom of the quadrant because it separates the municipalities where the cases are located from individual patients, instead opting to classify COVID-19 cases as from within or outside Tokyo and only dividing the overall number of cases by prefecture. This approach is vastly different from that of Hong Kong’s two dashboards, which is to share the residential buildings, quarantine locations, and other visited places of each COVID-19 case along with their demographic characteristics. Hong Kong even shared details such as the seat numbers of transportation that were previously occupied by confirmed COVID-19 patients. The Dashboard of the COVID-19 Virus Outbreak in Singapore takes yet another approach by associating each patient with a cluster and mapping the cluster networks to understand how the virus spread from one patient to another (Upcode Academy, 2021).
The four quadrants represent the decisions made by the developers of the dashboards to balance the trade-offs between data sharing and privacy. In theory, sharing more data, especially personal data, would increase the data privacy risks posed to COVID-19 patients. The opposite is also true; prioritizing the privacy protections of COVID-19 patients could lead to valuable data being omitted from the dashboards, thereby hindering users’ knowledge and risk assessment relative to COVID-19. These opposing outcomes are represented by the lower left and upper right quadrants respectively. However, the dashboards in the other two quadrants suggest that these trade-offs could be circumvented or that new problems could arise from the data. For example, the Singapore dashboard’s demographic breakdowns of the COVID-19 cases in its country indicated that most patients by nationality and gender were Bangladeshi and male respectively (Upcode Academy, 2021). These statistical analyses without context could give users the impression that Bangladeshi and male patients are less careful than other patient groups, when in reality, most of the patients under these categories were low-wage migrant workers who lived in such densely populated quarters that they could not effectively perform social distancing measures (Illmer, Reference Illmer2020). This case illustrates that, even when data are shared on an aggregate level, dashboards could pose risks not to individuals but to certain sub-groups of a population.
5. Discussions and Policy Implications
5.1. COVID-19 data as a public good
One question raised in this study is whether people would be willing to share the same amount of information that they seek. The fact that survey respondents were most comfortable with sharing their health data coincides with some of the top categories of desired COVID-19 data in Figure 2. This means the demand and supply of information are mostly congruent. However, far fewer people indicated that they would be willing to share residential and location data, which approximately two-thirds of the survey respondents were interested in knowing. This mismatch can be viewed as an example of a typical free-rider problem for public goods, wherein data are the public good being generated. While knowing the residences of confirmed COVID-19 cases could be helpful in assessing personal risk, disclosing a patient’s address could potentially subject the patient to harm such as doxing, which is the public sharing an individual’s personal and contact information, usually for malicious purposes. The problem of doxing is especially pertinent in Hong Kong, where it has been used for cyberbullying or politically motivated purposes (Chang, Reference Chang, Golley, Jaivin, Hillman and Strange2020; Chen et al., Reference Chen, Chan and Cheung2018), and it has even been publicly recognized as a concern by Chief Executive Carrie Lam (Zhang, Reference Zhang2019). Naturally, citizens would prefer not to share this information unless absolutely necessary. On the other hand, as discussed previously, many people would benefit from others sharing this information, as it would help them to gauge the risk of contracting COVID-19 by going to a certain location.
Further investigation is necessary to identify possible ways to prevent this free-rider problem. In the meantime, governments facing this issue could consider a solution proposed from a public goods perspective, which is to provide collaborative tools to communities to strengthen communication, align interests, and encourage constructive decisions in a “repeat game” of personal data use (Fairfield & Engel, Reference Fairfield and Engel2015). COVID-19 dashboards and other data platforms should develop stringent and transparent privacy policies that detail how data will be used, and users should be prompted to provide consent to share their data whenever the terms of use change. The feedback channels could also be used to gain insights into how users may want to calibrate the data sharing relationship.
In addition, while about 40% of dashboard users in the sample population wished to protect the privacy of others, a similar proportion of respondents was also willing to share who they were in close contact with, even though it was not specified whether they would have the other individuals’ consent to do so. There could be several reasons behind this inconsistency. One is that the group of close contacts may not necessarily coincide with the group of people whose privacy the users would like to protect. Another is that, should the users unfortunately contract COVID-19, they would decide that their civic responsibility to disclose information about their close contacts is a greater priority than protecting the privacy of a few individuals. It would be worthwhile to explore how users manage this trade-off in a future study.
5.2. Culture and trust as dimensions of privacy in COVID-19 data disclosure
Another possible key implication from this study is that users from different cultures respond differently to transparency and privacy trade-offs. Notably, interviewees in this study who had lived in Western countries appeared to express concern over the sharing of individual patients’ personal data more often than interviewees who lived in Eastern countries. The typology in Figure 8 seemed to support the idea of Eastern countries being more accepting of greater personal data disclosure for COVID-19, as most of the dashboards with detailed information on individual cases were for cities in Eastern countries. At the same time, as mentioned in Section 4.4, the cities that disclose a substantial amount of personal data have relatively denser populations, thus reducing the privacy and security risks posed to COVID-19 patients by revealing their buildings of residence. Moreover, the cities (i.e., Hong Kong, Singapore, and Tokyo) all adopted varying approaches to the disclosure of personal data, each with different levels of risk to privacy. Based on these results, governments do, and should continue to, adjust their approaches to data governance based on their social and cultural contexts.
Governments could also learn from other dashboard developers to explore alternative ways to manage and present COVID-19 case data. For example, the Tokyo Metropolitan Government dashboard has equally detailed information on COVID-19 cases compared to Hong Kong’s dashboards, disclosing the age, sex, and occupation of individual COVID-19 patients as well as where they reside. However, the Tokyo dashboard circumvents the issue of data privacy by categorizing the residential data of each individual case as “Tokyo” and “outside Tokyo”, while also sharing the aggregate number of cases by prefecture. Conversely, the Tokyo dashboard could adopt the mapping feature of the Hong Kong dashboards to display its COVID-19 case data geographically, which could be easier to understand than a table summary of cases. Since policy learning played a significant role in the proliferation of COVID-19 dashboards, it could likely be used to improve the functions and outcomes of these dashboards as well.
5.3. Hong Kong’s choice to address trade-offs between transparency and privacy
Finally, the case of Hong Kong’s COVID-19 dashboards could offer insights as to how governments could balance data privacy concerns with data sharing and transparency. As mentioned in the introduction, Hong Kong is facing an unfavorable socio-political climate with low levels of public trust that are hampering anti-epidemic efforts. At a time when using citizens’ data is necessary for handling a crisis, the Hong Kong government must be careful so that the data in question could be collected and shared without triggering concerns over data privacy and misuse. At the same time, data transparency regarding COVID-19 cases is crucial; otherwise, if citizens have the impression that the Hong Kong government is concealing data from the public, it could further sow public distrust.
Based on the results of this study as well as observations of the CHP’s COVID-19 press conferences, the CHP’s high degree of transparency and their willingness to provide data upon request create a general perception that their data are accurate and unbiased. Since users of dashboards do not know the full process as to how the CHP collects and presents COVID-19 data, they could never directly measure the accuracy of the data. Instead, citizens must depend on the information they are given by the CHP to reach a decision as to whether they should trust the data provided by the CHP. The CHP’s willingness to share open COVID-19 data on the government website and in response to journalists’ questions at press conferences appears to play a significant role in building credibility and trust, even if it could be at the expense of COVID-19 patients’ data privacy.
Furthermore, data transparency from the CHP is not only preferable for building trust but expected from Hong Kong citizens. The survey and interview results both suggested that there are many Hong Kong citizens demanding specific details regarding confirmed COVID-19 cases, such as the type of case, the locations and residence of the patients, and their demographic profiles. The increasing comprehensiveness of the data on the official COVID-19 dashboard could be a crucial means to meet citizens’ demand, which would foster more public trust. The results imply that increasing transparency, despite potential risks to privacy, could at least build trust in the government agency supplying crucial data at a time of crisis and low overall trust in the government. This is especially the case when the norms surrounding data disclosure are co-created by citizens and the government agency.
Even so, it is important to remember that the design of data policies should be highly context-dependent, and the demands and concerns of citizens are one invaluable element to consider. In the case of Hong Kong, far more citizens demanded COVID-19 data than those who demanded privacy protections for COVID-19 patients. However, this may not be the case universally. The public acceptability of data policies depends on a variety of factors, ranging from technical to cultural. Therefore, it would be valuable to study how stakeholders respond to similar data policies in other jurisdictions.
6. Conclusion
This study has demonstrated the following citizen responses to COVID-19 dashboards and case data in Hong Kong. Firstly, some if not most Hong Kong citizens are intellectually and physically proactive such that they actively demand case data and adjust their daily activities based on the data. Secondly, the data governance norm that has arisen from this proactivity is a high degree of data transparency from the CHP regarding individual COVID-19 cases, which has fostered a perceived sense of data accuracy as well as a high level of trust in the presented data. This is remarkable considering the city’s tense political climate and low overall level of public trust in government.
On a broader level, this study suggests that approaches to data disclosure for crises such as COVID-19 are and should be context-dependent, encompassing factors ranging from cultural concerns surrounding data privacy to citizens’ demands for relevant data. To achieve this, governments should engage with citizens and incorporate their feedback and concerns into the designs of their data tools. This can be done by embedding mechanisms for public feedback into data platforms, or by cooperating with and learning from the experiences of developers in other sectors to create more salient, credible, and legitimate policy tools. The engagement process should be ongoing so that data tools in the present and future could adapt and reflect changes in norms and stakeholder needs.
We recommend pursuing further research on the use of public health data and its policy implications. The approach from this paper could be applied to see how citizens respond to COVID-19 dashboard data in other jurisdictions. Also, this paper only discusses how jurisdictions could make decisions regarding COVID-19 dashboards and case reporting within their own borders. It will then be necessary to answer questions concerning how public health data, including COVID-19 case data, should be transferred across jurisdictions. Finally, research should be conducted on how COVID-19 case data and other data should be handled after the COVID-19 crisis lest there be long-lasting and unwanted impacts on data privacy and security.
Acknowledgments
Thank you to Professor Xun Wu and Professor Donald Low for their feedback on the wording of the survey. Thank you to Professor Matus for providing valuable feedback on the content of this paper. Thank you to Qualtrics support staff for helping us with the logistics of distributing our survey to a representative sample population. Thank you to the anonymous reviewers for this special issue for providing valuable criticism on our early draft. Lastly, thank you to the survey and interview participants, including representatives from the Centre for Health Protection, the Smart City Consortium, the vote4.hk team, and thebaselab, for their input.
Funding Statement
Masaru Yarime has received funding from the Murata Science Foundation. The funder had no role in the study design, data collection and analysis, decision to publish, or preparation of the manuscript.
Competing Interests
The authors declare no competing interests exist.
Author Contributions
Conceptualization: M.Y. and V.L.; Methodology: V.L.; Data curation: V.L.; Data visualization: V.L.; Writing original draft: V.L.; Project administration: M.Y.; Supervision: M.Y.; Writing—review & editing: M.Y. and V.L.; Funding: M.Y.; Resources: M.Y.; Software: M.Y. Both authors approved the final submitted draft.
Data Availability Statement
Due to the sensitive nature of the raw data, we have decided not to disclose the data to protect the participants.
Ethical Standards
The research meets all ethical guidelines, including adherence to the legal requirements of the study country.
Supplementary Materials
To view supplementary material for this article, please visit http://dx.doi.org/10.1017/dap.2021.27.


 Open access
Comments
No Comments have been published for this article.