

Introduction
When satellite technology became widely available, many animals studied revealed surprising behaviour and showed up in unexpected places. Likewise, modern genome studies on kinship relations show that the spreading of genes cannot easily be explained by visual observation. This raises the question whether erstwhile interpretations of animal movements and social organization stand the test of time. Dispersal (the movement of individuals away from their place of birth) is an influential life-history trait that alters the spatial distribution of species, individuals and, if followed by reproduction, alleles. Knowledge of dispersal behaviour, in terms of frequency, distance and direction, is essential for understanding population dynamics, structure and genetics, but can one-time deductions on social structure still be trusted? Likewise, can satellite-derived observations be trusted? Indeed, satellite-based remote sensing (RS) interpretations of vegetation and vegetation change over time are notorious for their dependency on underlying (often poorly known) algorithms. While RS specialists are mostly aware of the pitfalls, ecologists are not and merrily draw conclusions where RS specialists caution care. Since the beginning of modern ecology in the 1960s, African buffalo have been subject to observational studies, but the technologies that have been developed since the 1990s seem to question older interpretations. In this section, we examine the idea that buffalo may be migratory in some places. Older literature also showed this, but the deployment of GPS collars appears to reveal even more migratory behaviour.
The same GPS-collaring data may also lead to a different interpretation of the social organization of buffalo than previously posited. In that case, genetic data (see Part I) also appear to underpin the notion that buffalo may be less of a herding species, in which females live their lives in cohesive societies that undergo fission–fusion processes, than earlier interpretations indicated, but show more fluidity and less natal philopatry. It is of great importance to validate the GPS-based data. From other extensive data analyses on these types of data, we know that data cleaning is essential before one interprets GPS data, and we thus recommend that analyses of these types of data have a clear description of how raw data were transposed into the data used for the analyses. Compared to past literature, much more attention has been given in recent papers to the justification of the statistical methods used. Reliance on modern technology should lead to a similar openness about how data are acquired. Data handling may affect the trustworthiness of conclusions, as was demonstrated so aptly in climatology when the Antarctic ozone hole was erased from the data.
In the same vein, not enough is yet known about the effects on buffalo physiology, brain processes and behavioural (ab-)normality of chasing, darting and immobilizing African buffalo. The chapters presented are unique in the sense that we bring together for the first time ecologists, students of behaviour, animal handlers, veterinarians and physiologists in the hope that they all can learn from one another. We, as editors, thus hope that the disciplinary knowledge from these different specialities percolate into a fuller understanding of the technologies that (field) scientists use, so that they can draw well-informed conclusions on African buffalo.
This is also shown in the chapter on population dynamics. It is not easy to make a good life table of a species if there are no hard and fast rules to establish age estimates of individuals. Nor is it easy to apply mathematical models if one does not fully grasp the underlying assumptions. And if these assumptions do not incorporate the reality of the African savannas, with their recurrent droughts and permanent non-equilibrium states, then completely erroneous estimates of safe harvesting rates, not to mention estimates of ‘maximum sustainable offtakes’, could easily be made. Indeed, the latter concepts hail from environments where equilibrium dynamics govern systems and populations show a stable population structure; for African buffalo, that would appear to be another universe.
Diving deeper into evolutionary time, this section also provides a podium to discuss how to deal with the considerable morphological variation displayed by African buffalo. Through the simple mechanism of isolation by distance (see Part I), one might expect variation from a species with such an enormous geographical range, but neither the editors nor any of the authors advocate for the resurrection of ‘micro-species’ as were exuberantly discerned in the 1930s and again even more recently. If for conservation reasons (and not for postage stamp collecting) different forms need to be identified, then the smallest number of ‘subspecies’ that can be discerned on ecological and genetic grounds appears to be three (the northern savanna buffalo, the forest buffalo and the Cape buffalo). Ecologically speaking, they live under quite different natural selection pressures. These can be translated into different conservation challenges. It is too early, however, to translate these into us being able to precisely formulate differences in management challenges for the three different forms. Apart from the economic, financial and game handling challenges (Part IV), the lack of knowledge on African buffalo physiology (including thermal stress and precise food requirements) and its three ‘subspecies’ continues to prevent management based on science. As demonstrated by the chapters in this section, knowledge on the ecology of this fascinating species continues to widen. We certainly have made progress since M. Taute published his work in 1913 and F. Vaughan-Kirby in 1917, but when one century of research can be summarized in less than 100 pages, we think there is still much to learn.
Introduction
Spatial distribution and movement patterns of wild ungulates are strongly dependent on the spatial and temporal heterogeneity of biotic and abiotic resources (Bailey et al., Reference Bailey, Gross and Laca1996; Fryxell et al., Reference Fryxell, Wilmshurst and Sinclair2004). In most African ecosystems, feeding, drinking and resting places are subject to high seasonal variability and can be spatially segregated at certain times of the year. In this context, animals adopt space-use, movement and activity strategies that allow them to minimize detrimental effects of the main limiting factors to reach, at different scales, suitable trade-offs between several constraints and needs that must be addressed simultaneously (Godvik et al., Reference Godvik, Loe and Vik2009; Massé and Côté, Reference Massé and Côté2009).
Ungulates, like the vast majority of higher vertebrates, do not move erratically through the environment, but restrict their movements to sites much smaller in size than their locomotion capabilities allow, and which they mostly exploit over a long period. Based on this, Burt (Reference Burt1943) conceptualized the concept of home range as ‘the area traversed by the individual in its normal activities of food gathering, mating, and caring for young’. The home range is thus the spatial result of the movements and behaviours that an individual (or a social group) expresses at different spatiotemporal scales to survive and reproduce, in other words to maximize its (their) selective value. The home range is a central concept in ecology because it materializes a link between the movement of an animal and the resources necessary for its survival and reproduction.
In this chapter, we present the current state of knowledge on the space-use and feeding ecology of the African buffalo. This chapter also introduces some behavioural traits required for the comprehensiveness of this chapter, and which are further developed in other chapters. Most of what we know today about the behavioural ecology of savanna buffalo comes from studies focused on the Cape buffalo. In contrast, the ecology of the West and Central African savanna buffalo remains thus far poorly investigated. For this reason, and because several behavioural traits are similar within savanna buffalo subspecies, we present all savanna subspecies in one section, while the forest buffalo is the subject of a separate section.
Habitat
African buffalo live in a wide range of habitats, from open grasslands to rainforests, including all intermediate vegetation types: scrublands, woodlands and deciduous forests. African buffalo persist in semi-arid environments, as long as surface water is available within 20–40 km, year round (Cornélis et al., Reference Cornélis, Melletti, Korte, Melletti and Burton2014).
Biomass or production of savanna ecosystems, such as buffalo populations, is positively correlated with mean annual rainfall and the soil quality (Coe et al., Reference Coe, Cumming and Phillipson1976; Sinclair, Reference Sinclair1977; Grange and Duncan, Reference Grange and Duncan2006; Winnie et al., Reference Winnie, Cross and Getz2008). In similar water regime conditions, the nutrient content of vegetation and primary production are much lower on poor than on rich soils (Breman and De Wit, Reference Breman and De Wit1983; Le Houérou, Reference Le Houérou2008). The low biomass of wild ungulates in savanna ecosystems of West Africa (compared to those of volcanic areas in East Africa) mainly results from poorer soil conditions (Bell, Reference Bell, Huntley and Walker1982; East, Reference East1984; Fritz, Reference Fritz1997).
Savanna Buffalo
Savanna buffalo are mainly found in habitats with a high herbaceous biomass. In eastern and southern Africa, suitable grasses for Cape buffalo are found in several types of woodland, such as mopane (Colophospermum mopane), miombo (Brachystegia spp.), acacia (Acacia spp.) and Baikiaea spp. In West and Central Africa, savanna buffalo live in a variety of habitats ranging from typical Sahelian shrub savannas (Combretum spp., Terminalia spp, Acacia spp.) to Sudanian woodlands (e.g. Isoberlinia doka, Daniellia oliveri, Burkea africana).
Forest Buffalo
Forest buffalo are forest-dwellers, inhabiting rainforests with grassy glades, watercourse areas and mosaics of equatorial forests and savannas. This subspecies is absent (or present at very low densities) in continuous forests (Blake, Reference Blake2002; Melletti, Penteriani and Boitani, Reference Melletti, Penteriani and Boitani2007; Melletti, Reference Melletti2008).
Suitable habitats for forest buffalo are mosaics of forest with equatorial savannas or clearings, which consist of grassy vegetation and shrubs (Reitsma, Reference Reitsma1988; Blake, Reference Blake2002). Blake (Reference Blake2002) at Noubale–Ndoki National Park (NP) found high buffalo abundance close to open grassy areas with low abundance in the closed canopy forest, suggesting it is unsuitable for forest buffalo. A significant relationship between buffalo and natural forest clearings was also reported at Dzanga–Ndoki NP, where clearings were the centre of buffalo home ranges. In addition, no signs of buffalo presence were recorded over 500 m from clearings (Melletti, Penteriani and Boitani, Reference Melletti, Penteriani and Boitani2007; Melletti Reference Melletti2008). In Cameroon, buffalo rarely penetrated into the forest more than 300 m from logging roads, which were the main feeding sites for buffalo (Bekhuis et al., Reference Bekhuis, Jong and Prins2008).
Behaviour
Savanna Buffalo
African savanna buffalo are gregarious animals living in herds, and core members include adult females, subadults, juveniles and calves. Young females are known to maintain post-weaning bonds with their mother until the birth of their first calf, and probably longer. In contrast, young males gradually become independent, and are likely to form subadult male groups within the mixed herd. At the age of about 4–5 years (occasionally earlier), the males temporarily leave the herd to form bachelor groups of 2–20 individuals (sometimes more). The elder males (from about 10 years) sometimes permanently leave the herd, but this behaviour is not systematic (Sinclair, Reference Sinclair1977; Prins, Reference Prins and Beekman1996). Adult males competing for females leave the herd once their body condition decreases. Bachelor groups spend more time foraging and recover physical condition by foraging on patches of habitat too small and sometimes too risky for the herd, such as dense riparian woodland (Prins, Reference Prins and Beekman1996; Turner et al., Reference Turner, Jolles and Owen-Smith2005; see Chapter 6 for more details).
Savanna buffalo herd size varies across their distribution from as few as 20 to as many as 2000 individuals in the floodplains of eastern and southern Africa (Sinclair, Reference Sinclair1977; Prins, Reference Prins1989, Reference Prins and Beekman1996). In West Africa (WAP Regional Park), the mean herd size was about 45 individuals when excluding bachelor males, and the largest herds were estimated to contain about 150 individuals (Cornélis et al., Reference Cornélis, Benhamou and Janeau2011). Similar figures were reported for Central African savanna buffalo, except in floodplain areas such as Zakouma NP (Chad), where herds up to 800 individuals were observed (D. Cornélis, personal observation).
Forest Buffalo
Forest buffalo form small and stable herds of 3–25 individuals (Melletti, Penteriani, Mirabile and Boitani, Reference Melletti, Penteriani, Mirabile and Boitani2007; Korte, Reference Korte2008b; Melletti, Reference Melletti2008). Herds generally comprise several adult females with their young and one or two bulls (Dalimier, Reference Dalimier1955; Blake, Reference Blake2002; Melletti, Penteriani and Boitani, Reference Melletti, Penteriani and Boitani2007). In Lopé National Park, Gabon, the mean group size for the 18 herds was 12 ± 2 (range of means = 3–24; Korte, Reference Korte2008a). Larger herds were shown to contain a higher proportion of open habitat within their home range.
Although observations of solitary individuals (males and females) were reported, there is no evidence of the occurrence of sexual segregation in herds. Males apparently access profitable resources all year long and do not leave the mixed herds to form bachelor groups.
Home Range and Movements
The African buffalo is generally considered a sedentary species. In buffalo, home range (HR) size and movements (either seasonal or daily) are related to the spatiotemporal distribution of key resources. As pointed out previously, space use tends to be largely constrained by access to water in most study locations.
Savanna Buffalo Subspecies
Savanna buffalo herds exhibit HRs that generally range between 50 and 350 km2 (see Table 6.1 in Chapter 6). The larger HRs are generally observed in areas where resources are spatially segregated, which forces herds to undertake seasonal movements (see below). In contrast, males living in bachelor groups use smaller patches of habitat and form smaller HRs (0.5 and 4 km2; Grimsdell, Reference Grimsdell1969; Sinclair, Reference Sinclair1977; Taylor, Reference Taylor1985; Naidoo et al., Reference Naidoo, Du Preez and Stuart-Hill2012a).
In some systems, the HR size of mixed herds increases during the rainy season and decreases during the dry season (Naidoo et al., Reference Naidoo, Preez and Stuart-Hill2012b; Roug et al., Reference Roug, Muse and Clifford2020). During the rainy season, forage and water are abundant across the landscape and herds can move freely to find productive areas, whereas water availability often limits movement during the dry season, constraining buffalo to areas close to permanent water sources. In other systems that either have abundant natural surface water or extensive man-made water networks, buffalo HR sizes will increase during the dry season as they search for optimal foraging grounds (Ryan et al., Reference Ryan2006).
Some buffalo populations migrate between seasonal HRs (Cornélis et al., Reference Cornélis, Benhamou and Janeau2011; Bennitt et al., Reference Bennitt, Bonyongo and Harris2016; Sianga et al., Reference Sianga, Fynn and Bonyongo2017), although the exact migration pattern is not always consistent across years (Roug et al., Reference Roug, Muse and Clifford2020). Some buffalo populations were shown to undertake partial migration, meaning that within a group (or subpopulation), some will be migrant and others resident (Cornélis et al., Reference Cornélis, Benhamou and Janeau2011). Some groups exhibiting intermediate or partially migratory behaviour were qualified as ‘expanders’ (Naidoo et al., Reference Naidoo, Preez and Stuart-Hill2012b).
Naidoo et al. (Reference Naidoo, Du Preez and Stuart-Hill2014) report several seasonal movements of buffalo from the Kavango–Zambezi Transfrontier Conservation Area (KAZA TFCA) that are the longest documented distances for this species. A female collared on the Kwando River floodplains in Namibia during the dry season moved 87 km west along the Caprivi Strip before returning to her dry season range, a round trip journey of >170 km. The following wet season, she again moved ~87 km south into Botswana, before returning to the same dry season range for a different >170 km journey.
The most frequent pattern of buffalo seasonal movements is the use of extensive upland woodland and savanna systems during the wet season, which support more abundant high-quality grasses. Once grasses and waterholes in wooded savannas have dried out, buffalo move to lowland habitats, such as extensive wetlands, riparian areas and lake shore grasslands where sufficient soil moisture for plant growth and green forage persists into the dry season (Vesey-FitzGerald, Reference Vesey-FitzGerald1960; Taylor, Reference Taylor1985; Prins, Reference Prins and Beekman1996; Cornélis et al., Reference Cornélis, Benhamou and Janeau2011; Sianga et al., Reference Sianga, Fynn and Bonyongo2017). During drought years, buffalo resort to eating more productive and less digestible forage in the form of tall robust grasses and sedges and even reeds. They will resort to browsing in the absence of sufficient grass (Jarman and Jarman, Reference Jarman and Jarman1973; Stark, Reference Stark1986).
For example, in Ruaha National Park (Tanzania), Cape buffalo showed strong association with habitats near dry season water sources, whereas they were distributed widely across the park during the wet season (Roug et al., Reference Roug, Muse and Clifford2020). As cool drier seasons advance, herds may move progressively towards localized concentrations of remaining suitable grazing resources and water supplies, with increasing herd size.
In W Regional Park (Burkina Faso, Benin, Niger), the movements of seven West African savanna buffalo breeding herds were monitored using GPS collars (Cornélis et al., Reference Cornélis, Benhamou and Janeau2011). In the dry season, herds were shown to range close (within 5.3 ± 2.0 km, mean ± SD) to segments of permanent rivers. At the onset of the monsoon rains, all herds but one (which had year-round access to suitable resources along the Niger River) performed a larger (35 ± 10 km) south-west movement in response to a large-scale directional gradient of primary production. Furthermore, the establishment of wet season HRs appears conditioned by a threshold (~10 per cent) in the availability of perennial grasses, underlining the key role played by this resource for buffalo.
This was also observed for wet season ranges of buffalo in northern Botswana, where buffalo favoured areas >15 km from permanent water that have the highest cover of high-quality perennial grasses (Sianga et al., Reference Sianga, Fynn and Bonyongo2017). This is likely because leafy perennial grasses facilitate maximum intake for a large-bodied herbivore that relies on a tongue-sweep strategy to increase bite size.
Several recent studies based on GPS tracking have highlighted the occurrence of one-way movements over long distances, akin to dispersion. In the KAZA TFCA, two GPS-tracked females (among 30 females and five males tracked) undertook a long-range (~200 km) dispersal from the Kwando and Kavango Rivers in Namibia towards the Okavango Delta (Naidoo et al., Reference Naidoo, Du Preez and Stuart-Hill2014). In the Great Limpopo TFCA, a total of 66 GPS collars were deployed during 2008–2013 on females (47 adults, 19 subadults; Caron et al., Reference Caron, Cornélis and Foggin2016). Among this sample, three subadults were reported to leave the HR of their herd and disperse over 90 km.
Perhaps the most remarkable long-range movements came from female adult animals tagged in Mahango National Park, Namibia that exited via a break in the park fence in 2011. Numerous sightings of these animals suggest they moved as a group from north-eastern Botswana into Khaudum National Park. From there, the animals split into two groups, with one group observed in Angola near the Kavango River, around 250 km from where they had been ear-tagged. Another ear-tagged animal was eventually shot in an agricultural area in the Otjozondjupa Region in central Namibia. This location was a staggering 500 km from where she was tagged, far outside what is considered current buffalo range in Namibia (Martin, Reference Martin2002).
Although the occurrence of large-amplitude dispersions is probably inherent to the spatial behaviour of some buffalo, it cannot be excluded at this stage of knowledge that some of these movements result from disorientation due to the anaesthesia required to fit the GPS collars.
Forest Buffalo Subspecies
HR data are limited for forest buffalo because there are few sites where direct observation is possible due to the forest habitat and the animal’s elusive nature (Blake, Reference Blake2002; Melletti, Penteriani, Mirabile and Boitani, Reference Melletti, Penteriani, Mirabile and Boitani2007; Korte, Reference Korte2008b). Melletti, Penteriani, Mirabile and Boitani (Reference Melletti, Penteriani and Boitani2007) report an HR of 8 km2 for a herd of 24 buffalo at Danzga-Ndoki NP (Central African Republic). Based on seven radio-collared adult female forest buffalo at Lopé National Park, Gabon, over a two-year period (2002–2004), HRs of female forest buffalo averaged 4.6 km2 with little HR range overlap (Korte, Reference Korte2008b). Space use within HRs varies with season, with a preference for marshes during the wet season (September through February) and for forest in the dry season (March through August).
Forest buffalo HRs are thus much smaller than those of the savanna subspecies. It is likely that this pattern, common to all studies, results from the spatial arrangement of suitable resources in dense tropical forest, but also to less pronounced seasonality of the environment.
Activity Patterns
African buffalo display a large array of activity modes, including feeding, resting/ruminating, relocating between foraging areas, vigilance, wallowing and drinking. The relative proportions of these activity modes are mainly driven by spatiotemporal changes in the quality and availability of resources, interspecific competition, weather conditions and predation pressure (Sinclair, Reference Sinclair1977; Prins, Reference Prins and Beekman1996; Ryan and Jordaan, Reference Ryan, Knechtel and Getz2005; Owen-Smith et al., Reference Owen-Smith, Fryxell and Merrill2010).
Savanna Buffalo Subspecies
Daily Movements
Previous investigations on the daily movement rates of buffalo herds (based on short-term sampling, radiotelemetry or path retracement) reported contrasted results. Taylor (Reference Taylor and Walker1989) reported mean distances moved over a 24-hour period of <4 km compared to >6 km elsewhere (Sinclair, Reference Sinclair1977; Conybeare, Reference Conybaere1980). These authors reported that proximity of both food and water influence movements, and that bachelor males tend to move much less than herds. In South Africa (Kruger NP), buffalo herds were estimated to move 3.5 km per day during the dry season and 3.1 km during the wet season (Ryan and Jordaan, Reference Ryan, Knechtel and Getz2005). In contrast, in Cameroon (Benoué NP), Stark (Reference Stark1986) estimated a buffalo herd to travel on average 7.2 km per day during the rainy season and 5.6 km during the dry season.
More recently, Cornélis et al. (Reference Cornélis, Benhamou and Janeau2011) showed that GPS-tracked adult female savanna buffalo (n = 7) in West Africa (W Regional Park) travelled on average 6.5 ± 0.5 km (mean ± SD) per day at an annual scale. Analyses showed no significant differences between herds. In contrast, analyses at a subannual scale globally emphasized interesting trends in movement speed. Daily speed peaked around the dry–wet season transition (8.4 ± 0.5 km), either during the late dry season phases or during the early wet season phases. Minimum daily values (4.8 ± 0.4 km) were observed in most herds during the phases corresponding to the late wet season or just after. The daily movement speed thus followed in all herds a decreasing pattern between dry–wet and wet–dry season transitions.
Similar patterns were reported in Ruaha NP, where daily movements of GPS-tracked herds averaged 4.6 km with the longest distances (mean 6.9 km) travelled during November at the end of the dry season and beginning of the wet season. The shortest daily distances (mean 3.6 km) travelled occurred in the wet season in April–June (Roug et al., Reference Roug, Muse and Clifford2020).
Grazing and Ruminating
Ruminant ungulates such as buffalo spend a large proportion of their time feeding, and must additionally allocate time to ruminating, which results in an overall total time (feeding + ruminating) of 70–80 per cent (Beekman and Prins, Reference Beekman and Prins1989; Prins, Reference Prins and Beekman1996). In savanna buffalo, most studies report feeding time accounting for 35–45 per cent of the 24-hour activity budget (Grimsdell and Field, Reference Grimsdell and Field1976; Sinclair, Reference Sinclair1977; Mloszewski, Reference Mloszewski1983; Stark, Reference Stark1986; Prins, Reference Prins and Beekman1996; Winterbach and Bothma, Reference Winterbach and Bothma1998; Ryan and Jordaan, Reference Ryan, Knechtel and Getz2005; Bennitt, Reference Bennitt2012).
Grazing most often takes place in the early morning and late afternoon, and during the first half of the night, suggesting that buffalo cease feeding during the hottest part of the day and during the coolest part of the night for thermoregulation purposes. Note that an exception to this feeding pattern was observed at Lake Manyara NP (Tanzania), with the main grazing bout occurring between 10:00 and 14:00 hours (Prins, Reference Prins and Beekman1996). In most studies, buffalo herds appear to spend an equal or greater proportion of time feeding at night than during the day (Sinclair, Reference Sinclair1977; Taylor, Reference Taylor1985; Prins and Lason, Reference Prins, Sinclair, Knight, Kingdon and Hoffmann1989; Ryan and Jordaan, Reference Ryan, Knechtel and Getz2005). At a seasonal scale, most authors reported a trend towards more time spent feeding in the dry than the wet season in response to lower vegetation quality and quantity and decreased intake rates. Other modes of activity such as resting, rumination and vigilance are not mutually exclusive, thus making it hard to individualize ratios and to compare across studies.
Most studies reported average rumination times of around 30–35 per cent of the 24-hour activity budget (Sinclair, Reference Sinclair1977; Prins, Reference Prins and Beekman1996; Winterbach and Bothma, Reference Winterbach and Bothma1998; Ryan and Jordaan, Reference Ryan, Knechtel and Getz2005). Seasonal trends in rumination time are the subject of debate; Sinclair (Reference Sinclair1977) reported that buffalo spend more time ruminating during the dry season, whereas Beekman and Prins (Reference Beekman and Prins1989) found the opposite.
Thermoregulation
Buffalo generally cease feeding during the hottest part of the day and during the coolest part of the night for thermoregulation purposes. During the hottest hours of the day, mixed herds generally seek shade (Sinclair, Reference Sinclair1977). Contrary to females and young, males generally wallow during the hottest time of the day for periods lasting up to three hours. This practice is more effective in temperature regulation than the use of shade (Sinclair, Reference Sinclair1977).
In West Africa (WAP Regional Park), the daily activity patterns of buffalo herds were explored using biorhythm indices derived from GPS location data and activity sensors (Cornélis et al., Reference Cornélis, Benhamou and Janeau2011). At a daily scale, herds were equally active during night and day, and were mostly crepuscular, with two main active periods per day (dawn and dusk). Buffalo rested during the hottest hours of the day, and the duration of the resting bout was particularly marked during the hot dry season (Figure 5.1; Cornélis et al., Reference Cornélis, Melletti, Korte, Melletti and Burton2014).
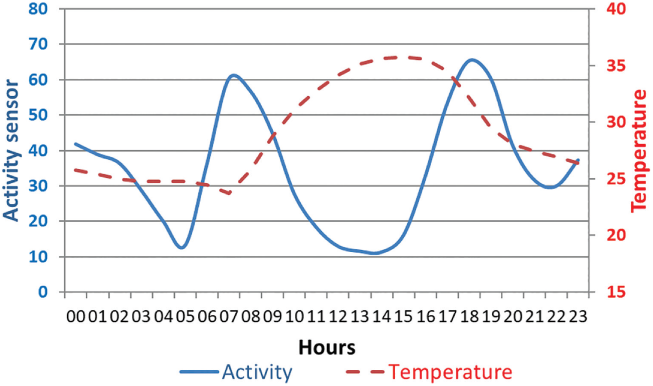
Figure 5.1 Average daily activity of a buffalo cow tracked in the WAP transfrontier conservation area (Burkina Faso, Benin, Niger) from March 2007 to February 2008 (using temperature and activity sensors embedded in the GPS collar). The first peak of activity started at dawn and the second finished after dusk, both lasting on average about 3–4 hours.
Water Resources and Drinking Activity
In many savanna regions of Africa, pronounced seasonal variability in rainfall results in wildlife being restricted to floodplains and other habitats adjacent to permanent surface water in the dry season. Nearly 100 per cent of the biomass density of large water-dependent grazing herbivores has been found within a 15 km radius from surface water (Western, Reference Western1975). Nevertheless, while rarely quantified, ephemeral water sources far from permanent surface water also allow wildlife to exploit forage and other resources further afield, influencing their distribution, abundance and movement (Naidoo et al., Reference Naidoo, Brennan and Shapiro2020; Rumiano et al., Reference Rumiano, Gaucherel and Degenne2021).
African buffalo are water-dependent: they can sweat profusely (Taylor, Reference Taylor1970), the water content of their faeces is high (about 80 per cent: Prins, Reference Prins and Beekman1996) and their body water turnover rate is high (King, Reference King1979). They have to drink at least every two days, taking about 45 litres daily, and they are not able to survive on the moisture content of their food (Prins, Reference Prins and Beekman1996).
Previous studies on drinking reported contrasted hourly patterns. In Hwange NP (Zimbabwe), equipped with pumped artificial surface water supplies, Weir and Davidson (Reference Weir and Davidson1965) found during the dry season that buffalo drank in the late afternoon (16:30–20:00) with a shorter peak early in the morning (08:30–10:30). In Kruger NP (South Africa), Ryan and Jordaan (Reference Ryan, Knechtel and Getz2005) found two main periods of diurnal drinking (the early morning and mid-morning) and their observations suggest more time devoted to drinking during the day than at night. In contrast, Winterbach and Bothma (Reference Winterbach and Bothma1998) found in Willem Pretorius game reserve (South Africa) that buffalo drank in the early afternoon. Grimsdell and Field (Reference Grimsdell and Field1976) also found that herds in Rwenzori NP (Uganda) drank in the mid-morning. In one study, buffalo were shown to modulate hourly drinking patterns according to the risk of predation by preferentially avoiding waterholes during high-risk hours of the day (dawn and dusk), when lions were likely to be in their vicinity (Valeix et al., Reference Valeix, Fritz and Loveridge2009).
A detailed analysis of drinking behaviour was reported by Taylor (Reference Taylor and Walker1989) in Matusadona NP (Zimbabwe), where Lake Kariba provides permanent water supplies for buffalo, in addition to seasonal rivers and pans that hold water in pools. During the hot dry season, herds drank once during the daytime, either around midday or between 16:00 and 19:00. The average drinking time took 20 minutes. In the wet season buffalo herds were a greater distance away from permanent water (mean 2.8 km) than during the dry season, when the mean distance from permanent water was 1.3 km. The converse held for seasonal water supplies. Buffalo herds were closer to these (1.5 km) in the wet season but further away in the dry season (2.4 km). This is to be expected because buffalo disperse during the wet season when abundant food and water resources are widespread, but concentrate on the lakeshore during the dry season where the only readily available food and water resources are present (Taylor, Reference Taylor and Walker1989).
For bachelor males, over 50 per cent of drinking bouts occurred between 10:00 and 14:00 with a peak from 11:00 to 12:00. Males drank throughout the day from before 06:00 until 20:00 and in the early morning hours at 02:00–03:00 (Taylor, Reference Taylor and Walker1989). During the wet season an individual may drink 2–3 times from the lake’s edge, but usually once in the morning and once in the afternoon. During the cooler months, drinking during the day usually occurred only once, either late morning or at midday. As the hot season progressed, the number of drinking bouts increased to two or three in the morning and afternoon. Drinking bouts for individual males were, on average, of 1–3 minutes’ duration.
Overall, however, in the literature reviewed, there appears to be no clear seasonal trends in drinking frequency among savanna buffalo.
Forest Buffalo Subspecies
Much less is known about the movement and activity of forest buffalo compared to savanna populations. In Dzanga–Ndoki NP (Central African Republic), a study of a single buffalo herd showed that daily distances travelled by buffalo were generally very short (i.e. 500–1500 m) and were mainly restrained to clearings and surrounding areas (Melletti, Reference Melletti2008). The maximum distance travelled during a 24-hour tracking period was about 4000 m. Like savanna buffalo, forest buffalo wallow in the late afternoon; however, they spend more time in wallows during the dry season (Melletti, Penteriani, Mirabile and Boitani, Reference Melletti, Penteriani, Mirabile and Boitani2007; Korte, Reference Korte2008a).
Feeding Ecology
Buffalo are ruminants, essentially feeding on grass and roughage. This species is capable of subsisting on pastures too coarse and too tall for most other herbivores (Bothma, Reference Bothma and du Bothma2002), and as a ‘bulk grazer’ they ingest around 2.2 per cent of their body mass daily. This represents on average 6.5 kg for a forest buffalo of 300 kg, 11 kg for a West or Central African buffalo of 500 kg and 15 kg for a Cape buffalo of 700 kg.
Buffalo are very efficient grazers (their adapted dentition and a mobile tongue allowing the ingestion of high quantities of grass in a short amount of time). Optimal feeding conditions for buffalo prevail when the grass forms swards and leaf heights reach and exceed 10 cm, as in flood plains or in forest glades (Prins, Reference Prins and Beekman1996). However, buffalo cannot cut pastures as short as other species. The African buffalo thus occupies an important niche, opening up habitats that are preferred by short-grass grazers (Prins, Reference Prins and Beekman1996; Estes, Reference Estes1991). Their primary competitors are cattle Bos taurus, African elephant Loxodonta africana, plains zebra Equus quagga and wildebeest Connochaetes taurinus (Sinclair, Reference Sinclair1977; de Boer and Prins, Reference de Boer and Prins1990; Plumptre and Harris, Reference Plumptre and Harris1995; Prins, Reference Prins and Beekman1996).
Savanna (Cape, West and Central African) Buffalo
In savanna buffalo, optimal dietary conditions occur during the rainy season, while the end of the long dry season is a period of food scarcity (both in quantity and quality; Prins and Sinclair, Reference Prins2013). Detailed diet studies conducted in eastern and southern Africa indicated that buffalo are resource limited and constrained by a minimum dietary protein concentration of 7–8 per cent to make fermentation in the rumen possible (Sinclair, Reference Sinclair1977; Prins, Reference Prins and Beekman1996). In such a situation, buffalo thus face a trade-off of quality and quantity in obtaining an appropriate protein-to-fibre ratio in their diet (Redfern et al., Reference Redfern, Ryan and Getz2006; Ryan et al., Reference Ryan and Jordaan2012). During the dry season, savanna buffalo are generally forced to become more selective, and to partially switch their diet to browse (see below). Despite this, buffalo were reported to live at or below nitrogen requirements for prolonged periods, accounting for visibly losing body condition (Prins, Reference Prins1989; Ryan, Reference Ryan, Cross and Winnie2006; Ryan et al., Reference Ryan and Jordaan2012). In natural ungulate communities, the regulation of populations is driven by two processes: a control by available food resources (‘bottom-up regulation’) on the one hand, and a control by predation (‘top down’ regulation) on the other (Hunter and Price, Reference Hunter and Price1992). In the case of savanna buffalo, most authors agree that resources play a dominant role in the regulation of populations (Sinclair et al,. Reference Sinclair, Mduma and Brashares2003; Hopcraft et al., Reference Hopcraft, Olff and Sinclair2010).
There is moderate consensus in feeding studies on Cape buffalo about the preferred grass species. Usually species that are avoided contain low nutritious quality or the presence of aromatic oils (Prins, Reference Prins and Beekman1996). During the dry season, usual food resources are of poor quality, due to lignifications and high standing biomass. During this period, floodplain species (e.g. Leersia hexandra) and riverine forest species (e.g. Setaria sphacelata) become important. In areas with upwelling groundwater, species such as Cyperus laevigatus may also form a mainstay in the dry season (Prins and Sinclair, Reference Prins2013). Buffalo prefer grasses such as Cynodon dactylon, but may also eat broad-leaved grasses, such as Panicum maximum. Sinclair, in the Serengeti, reported that buffalo preferred soft, nutritious grass such as Digitaria macroblephora. Although there is little information on seasonal changes on diet, Sinclair (Reference Sinclair1977) analysed stomach contents and showed that Cape buffalo select more grass leaf at the end of the rainy season. Finally, Taylor (Reference Taylor1985) found that grasslands dominated by Panicum repens were the best habitat on the shores of Lake Kariba (Matusadona NP, Zimbabwe). In Cape buffalo, the diet of the different age/sex classes does not appear to differ and dry matter food intake ranges between 1.2 per cent and 3.5 per cent of body mass, similarly to other ruminants, but subject to food quality (Sinclair, Reference Sinclair1977; Prins and Beekman, Reference Prins and Lason1989).
Few studies investigated the feeding ecology of West and Central African buffalo. In West Africa (WAP Regional Park), habitat selection analysis emphasized the importance of perennial grasses (e.g. Andropogon gayanus; Cornélis et al., Reference Cornélis, Benhamou and Janeau2011). In this study, a gradient in primary production appeared to determine large-scale movements of herds at the onset of the wet season, but its action clearly was modulated by the proportion of perennials available. Buffalo herds were shown to establish early wet season HRs at locations where this proportion reached a 9 per cent threshold. At Benoué NP (Cameroon), Stark (Reference Stark1986) similarly reported a very high proportion of grasses in the diet, particularly Andropogon gayanus, which represented 51 per cent of the volume ingested in the dry season, versus 40 per cent in the wet season. At Zakouma NP (Chad), Gillet (Reference Gillet1969) noted a preference for Setaria anceps (particularly new shoots after fire) and Andropogon gayanus, but also Vetiveria nigritana. In the dry season, the unburned straws of Echinochloa obtusiflora appeared to be preferred.
Savanna buffalo are primarily grazers, but partially switch to browse when grasses become tall and lignified (Field, Reference Field1972; Leuthold, Reference Leuthold1972; Sinclair, Reference Sinclair1977; Mloszewski, Reference Mloszewski1983; Hashim, Reference Hashim1987; Prins, Reference Prins and Beekman1996). Shrub and tree leaves have been shown to contain higher protein (nitrogen) content than dry grasses during the dry season (Kone et al., Reference Kone, Richard and Guerin1990; Prins, Reference Prins and Beekman1996). As mentioned above, the contribution of nitrogen from browse facilitates the fermentation of fibrous grass in the rumen, which they eat in high quantities during the dry season. According to Estes (Reference Estes1991), the browse can represent up to 5 per cent of the total diet, but higher figures were reported in several sites (e.g. 26 per cent in dry season in Cameroon; Taylor, Reference Taylor1985). A wide range of species of shrubs and trees are consumed throughout African savanna, including Grewia spp., Heeria spp., Colophospermum mopane, Combretum spp., Capparis spp. and Piliostigma spp. (Pienaar, Reference Pienaar1969; Jarman, Reference Jarman1971; De Graaf et al., Reference De Graaf, Schultz and van der Waet1973; Taylor and Walker, Reference Taylor and Walker1978; Ryan, Reference Ryan, Cross and Winnie2006). In drier habitats in the Eastern Cape, buffalo appear to be adapted to eat woody species because grassy vegetation is scarce. In this particular habitat, during the dry season, up to 33 per cent of their diet comprises species such as Acacia sp., Plumbago sp. and Grewia sp.
In some areas buffalo can maintain or create ‘grazing lawns’ if the feeding interval is short enough (Prins, Reference Prins and Beekman1996). Evidence of this ‘returning’ behaviour has also been described for buffalo in Kruger NP and Klaserie Private Nature Reserve in South Africa (Bar-David et al., Reference Bar-David, Bar-David and Cross2009). They may also create favourable lawns in conjunction with other large herbivores such as elephants at Lake Rukwa, Tanzania (Vesey-FitzGerald, Reference Vesey-FitzGerald1960) and Benoué NP in central Cameroon (H. H. T. Prins, personal observation).
Geophagy has been reported at several sites, where clay or substrates rich in iron may explain this preference. On Mount Kenya, geophagy is reported in the bamboo belt (2100–3000 m), where clay soils are rich in iron and aluminium (Grimshaw et al., Reference Grimshaw, Cordeiro and Foley1995). This rare activity is carried out mainly by solitary individuals on Mount Kenya (Mahaney, Reference Mahaney1987). In Lent Valley in Kilimanjaro, buffalo enter into caves rich in sodium bicarbonate and chew off the soda deposits.
Forest Buffalo
Few data exist on the feeding ecology of forest buffalo because direct observations are rarely feasible in rainforest habitats. Blake (Reference Blake2002) in Noubale–Ndoki NP and Melletti (Reference Melletti2008) in Dzanga–Ndoki NP observed buffalo feeding mainly on Poaceae and Cyperaceae within clearings, in particular on Rhyncospora corymbosa, Kyllinga sp. and Cyperus sp. Blake (Reference Blake2002) also recorded several species of Marantaceae, including Marantochloa purpurea, M. cordifolia, M. filipes and Halopegia azurea. In addition, species of the Commelinaceae family such as Commelina diffusa and Palisota brachythyrsa and a species of algae (Spirogyra sp.) were recorded. Melletti (Reference Melletti2008) also found indirect signs of feeding activity on Commelina sp and Palisota sp. in the understory of Gilbertodendrum dewevrei mono-dominant forest.
Bekhuis et al. (Reference Bekhuis, Jong and Prins2008) used micro-histological faecal analysis in a two-month study to determine the diet of forest buffalo at Campo-Ma’an NP in southern Cameroon. They found that the most important part of the diet was composed of graminoids (43 per cent, with Leptochloa caerulescens representing 15 per cent of the total diet), non-graminoid monocots (21 per cent, mainly Commelinaceae such as Palisota spp.), dicotyledoneous plants (33 per cent, mainly leaves) and cryptogamous plants (3 per cent). The composition of the diet suggests that the buffalo fed mainly along logging roads and river banks (Bekhuis et al., Reference Bekhuis, Jong and Prins2008). Using a similar method at Lopé NP (Gabon), Lustenhouwer (Reference Lustenhouwer2008) and van der Hoek et al. (Reference van der Hoek, Lustenhouwer, Jeffery and van Hooft2013) found that the majority of plants consumed by forest buffalo were monocotyledons, primarily grasses (Poaceae) and sedges (Cyperaceae), with a low portion of dicotyledonous plants in the diet. In the same study area, van der Hoek et al. (Reference van der Hoek, Lustenhouwer, Jeffery and van Hooft2013) emphasized the importance of savanna habitat, noting that controlled burning is a key tool for maintaining open areas.
Thus far, no evidence of the existence of grazing lawns was found in the different studies focused on the feeding ecology of forest buffalo, even in areas of high density such as Lopé NP (L. Korte and M. Melletti, personal observations).
Conclusion
The African buffalo is endowed with an amazing adaptability, which probably explains why this species is one of the most successful large African mammals in terms of geographical distribution, abundance and biomass. On an evolutionary scale, African buffalo have adapted their phenotype across their distribution range, which covers almost all natural ecosystems south of the Sahara. For example, the mass ratio between the large Cape buffalo and the small forest buffalo is about 2.7 to 1. With the exception of the elephant, few species have an equivalent mass range across their distribution area. The African buffalo has also managed to adapt its behaviour to the different ecosystems in which it lives. For example, in dense tropical forests where food resources are scarce and aggregated, the African buffalo forms small herds of 5–20 animals. In contrast, in the rich pastures of the savanna floodplains, the African buffalo can gather in herds of up to 2000 animals.
The space-use behaviour of buffalo herds also differs strongly according to the spatial arrangement of resources. In areas where buffalo access profitable resources all year long, the herds settle in home ranges of a few square kilometres. In contrast, in areas where resources are spatially segregated, buffalo occupy home ranges of several hundreds of square kilometres. In some regions, buffalo undertake seasonal movements of several dozen kilometres. Such migrations may be only partial within a population, meaning that it is not undertaken by all herds.
At a seasonal and daily scale, buffalo are also able to modulate their social behaviour within the herd according to the availability of resources. The herd splits into subgroups and reforms within the contours of a long-lasting (multiannual) home range, according to mechanisms that remain largely unexplored (Chapter 6). Finally, within their seasonal home range, we also saw that buffalo can regulate their diet and activity patterns according to the quality and quantity of food resources, as well as according to abiotic factors such as temperature.
Thus, despite reported regional declines in buffalo population numbers due, inter alia, to climate change, habitat fragmentation, livestock development and diseases, the species may be flexible enough to adapt to the wide range of challenges it faces and will face in the coming decades.
Introduction
The ecology of the African buffalo (Syncerus caffer) has been the focus of extensive research studies over the past 50 years (Grimsdell, Reference Grimsdell1969; Sinclair, Reference Sinclair1977; Taylor, Reference Taylor1985; Prins, Reference Prins1996), including some more observational ones (e.g. Mloszewski, Reference Mloszewski1983). The species’ grouping patterns have historically been described as follows: mixed or breeding herds constitute the main social units, consisting of adult females, weaned and subadult individuals of both sexes (subadults are between 3 and 5 years of age) and a small proportion of adult males; bachelor groups gather males (two or more) 4 years of age and above; they gravitate around mixed herds, joining them mainly for mating and leaving them to escape intraspecies and gender competition and to improve their resource offtake efficiency until the next mating opportunity (Prins, Reference Prins1996; Turner et al., Reference Turner, Jolles and Owen-Smith2005). Bachelor groups tend to have a transient composition, with individuals associating for periods ranging between a few hours and several months. Bachelor groups can interact with several mixed herds ensuring gene flow at the inter-herd level (Van Hoof et al., Reference Van Hoof, Groen and Prins2003; Halley and Mari, Reference Halley and Mari2004; Turner et al., Reference Turner, Jolles and Owen-Smith2005). The mixed/breeding herd is classically defined by its home range, which has little interannual variation, and on which it interacts with bachelor groups, and a static and stable group size often affected by temporary and seasonal fusion–fission patterns (Prins, Reference Prins1989a; Cross et al., Reference Cross, Lloyd-Smith and Bowers2004; Tambling et al., Reference Tambling, Druce and Hayward2012). However, some aspects of this planet- and satellite-like framework have recently been challenged by observational studies.
In addition, the lack of a clear set of definitions regarding the entities composing buffalo assemblages prevent a clear and comparative approach. For example, two mixed herds can be described as either fusing or as one ‘herd’ being joined by another ‘group’ or ‘subgroup’, and the new entity is sometimes called a ‘large or mega herd’. The complexity associated with reliably and accurately identifying individual buffalo within large groups and regularly estimating the number of individuals associated with a focal animal (e.g. followed by telemetry) explains the difficulty with understanding group/individual dynamics within mixed herds. In this chapter, we will present a revised conceptual framework for buffalo social systems based on recent knowledge and interpretation. This conceptual framework will present the facts and hypotheses and highlight the gaps in knowledge to map the way forward in our understanding of African buffalo social dynamics.
Mixed Herds of African Buffalo
Mixed or breeding herd of African buffalo are the common terms used for a group of buffalo with a core social unit consisting of adult females. We will start by reviewing recent data from telemetry studies to shed light on what is known and unknown about these mixed herds.
A Mixed Herd is Composed of Adult Females Sharing a Home Range
In Gonarezhou National Park (GNP), Zimbabwe in 2008–2009, nine adult female Syncerus caffer caffer were equipped with GPS collars in four presumably different groups spotted from a helicopter (1, 2, 3 and 3 individuals in each group, respectively). Animals of these age and sex categories are expected to be most strongly bound to mixed herds (Sinclair, Reference Sinclair1977; Prins, Reference Prins1996; Fortin et al., Reference Fortin, Fortin and Beyer2009; but see Cross et al., Reference Cross, Lloyd-Smith and Bowers2004, Reference Cross, Lloyd-Smith, Johnson and Getz2005). The GPS acquired hourly locations over 405 days. The annual home range (HR) was computed (up to the 0.95 isopleth) for each collared individual using a movement-based kernel density estimation method (Benhamou and Cornélis, Reference Benhamou and Cornélis2010). HR overlap between individuals was estimated using Bhattacharyya’s affinity index (Benhamou et al., Reference Benhamou, Valeix and Chamaillé-Jammes2014). When displayed together (Figure 6.1), the HR of the nine females captured in four groups cluster easily in two HRs, which define the HRs of two mixed herds. Individual HRs strongly overlap within each mixed herd (74.4–80 per cent; and 59.3–68.6 per cent).

Figure 6.1 In yellow–reddish gradient, nine individual adult females African buffalo annual home range (HR) captured in Gonarezhou NP, Zimbabwe in 2008; central larger map, HR of the two mixed herds after superposition of individual HR.
Observations from GNP were included in a larger study based on 47 adult female buffalo from three national parks (NPs) in Zimbabwe and South Africa, which confirmed that adult female buffalo belonging to the same mixed herds shared at least 60 per cent of their HR. However, when observing adult female dyad dynamics (i.e. collared adult females two by two) within each mixed herd, the proportion of time spent together (simultaneous locations within 1000 m) in relation to HR overlap remained highly variable between dyads (Figure 6.2; Wielgus et al., Reference Wielgus, Cornélis and de Garine-Wichatitsky2020). In GNP and Kruger NP (KNP), females sharing between 60 per cent and 80 per cent of their HR spent, respectively, between 10–40 per cent and 10–70 per cent of their time together in each park. Cross et al. (Reference Cross, Lloyd-Smith and Bowers2004, Reference Cross, Lloyd-Smith, Johnson and Getz2005) found similar patterns of fusion–fission dynamics within mixed herds.

Figure 6.2 Relationship between the time spent in the same subgroup and HR overlap among pairs of Syncerus caffer caffer; n = 47 adult female buffalo from Gonarezhou, Kruger and Hwange NPs (Zimbabwe, South Africa); points represent the observed values for each dyad per year and per season. Solid lines represent the predictions from the model, and grey dashed lines represent 95 per cent confidence intervals. Horizontal blue dashed line indicates the cut-off value of 10 per cent of time spent in the same subgroup.
In the Okavango Delta (OD), Botswana, hourly GPS data were collected from 15 buffalo cows between 2007 and 2010. Based on HR overlap, two mixed herds were identified, one resident and the other migratory (Bennitt et al., Reference Bennitt, Bonyongo, Harris and Barrett2018). Analysis using the methods of Wielgus et al. (Reference Wielgus, Cornélis and de Garine-Wichatitsky2020) showed that buffalo dyads with approximately 30–90 per cent HR overlap spent between 3 per cent and 80 per cent of their time within 1000 m of each other. These data fit well with the definition of a mixed herd being composed of individuals sharing the same HR (Sinclair, Reference Sinclair1977).
Mixed Herds’ Home Range Overlap is Generally Small
The African buffalo is usually considered a non-territorial species, but studies investigating space sharing between neighbouring mixed herds have reported contrasting results. At Lake Manyara NP, Tanzania (Prins, Reference Prins1996), in Chobe NP, Botswana (Halley et al., Reference Halley, Vandewalle, Mari and Taolo2002), at Klaserie Private Nature Reserve, South Africa (Ryan et al., Reference Ryan, Knechtel and Getz2006) and in Niassa National Reserve, Mozambique (Prins, personal communication), herds tended to occupy distinct and exclusive HRs with little overlap. In contrast, in Rwenzori NP, Uganda (Grimsdell, Reference Grimsdell1969) and Sengwa Wildlife Research Area, Zimbabwe (Conybeare, Reference Conybeare1980), a large spatial overlap has been reported between HRs of neighbouring mixed herds (but these may have been offshoots of mixed herds). Seasonal changes in the use of space between neighbouring mixed herds and their temporal dynamics, however, are less understood.
Recently, the use of GPS technology on adult females has provided more accurate measures of the temporal dynamics between neighbouring herds. In a West African buffalo population living in W Regional Park, Niger, two neighbouring herds had very little direct contact within a 500-m spatial window, and for less than an hour despite the quite large overlap (21 per cent) of their HRs (Cornélis et al., Reference Cornélis, Benhamou and Janeau2011). In KNP and GNP, HR overlaps between individuals belonging to different mixed herds were very small, ranging from 3 per cent to 8 per cent (Figure 6.1). These results are in agreement with observations in Manyara NP, Tanzania (Prins, Reference Prins1996). A recent study based on long-term GPS-tracking of adult females in KNP and the OD has confirmed strong spatial segregation of HRs of neighbouring Cape buffalo herds, and short-term behavioural avoidance (Wielgus et al., Reference Wielgus, Caron and Bennitt2021). Cape buffalo formed relatively distinct herds occupying unique and separated HRs, with minimal overlap and very few direct contacts. Interestingly, and for the first time, this study highlighted that herds tended to avoid areas used by another herd in the previous two days during both the dry and wet seasons. Indirect contacts (i.e. use by two collared individuals of the same area at different times) between the neighbouring herds occurring within one month were more frequent than direct contacts.
Exchanges of Individuals between Mixed Herds Do Exist
Despite the temporal avoidance and the low spatial overlap between the HR of neighbouring mixed herds, dispersal events connecting mixed herds have been observed. From direct observations, Cross et al. (Reference Cross, Lloyd-Smith and Bowers2004) reported contacts and exchanges between neighbouring mixed herds within a two-year period. Caron et al. (Reference Caron, Cornélis and Foggin2016) reported three occurrences of dispersal by juvenile female buffalo out of 19 juvenile cows tagged or fitted with a GPS collar in KNP and GNP (Figure 6.3). These observations are corroborated by reports by game farmers and managers of juvenile females being spotted in small groups around wildlife farms or along veterinary fences in Zimbabwe (Caron, personal observation). Naidoo et al. (Reference Naidoo, Du Preez and Stuart-Hill2014) also reported long-range movement of female buffalo (age unknown) in Namibia and Botswana, some without apparent return to their former HR. In Ruaha NP in Tanzania and in Chobe NP and the OD in Botswana, herd switching was also observed (Halley et al., Reference Halley, Vandewalle, Mari and Taolo2002; Bennitt et al., Reference Bennitt, Bonyongo, Harris and Barrett2018; Roug et al., Reference Roug, Muse and Clifford2020). In southern KNP, the annual dispersal rates in two herds by adult females were 14 per cent and 19 per cent, respectively, and younger adult cows were more likely to disperse (Spaan et al., Reference Spaan, Epps, Ezenwa and Jolles2019). These results indicate that adult and juvenile females do change herds, with juvenile cows engaging in this behaviour more frequently. An outbreeding behaviour prior to first reproduction could explain this difference. However, the composition (other individuals of the same or different age or sex, if any) of the group accompanying the tracked females in these studies is unknown. In addition, it is not known in this study if these female dispersal events are also mirrored by male dispersal events.

Figure 6.3 Study area encompassing part of Mozambique, South Africa and Zimbabwe. The inset map shows the location of the Great Limpopo Transfrontier Conservation Area within southern Africa. Brown areas represent the home ranges of five satellite collar–equipped adult female African buffalo, representative of the five herds followed for the study in Kruger National Park (NP; n = 3) and Gonarezhou NP (n = 2). Because of overlap among the herds, boundaries for the five herds cannot be seen. Data for the other adult female buffalo in the study are not represented. The home range of Kruger NP herds spans the Limpopo River between South Africa and Zimbabwe. Long-distance movements of three subadult female buffalo are shown. Arrows indicate the direction of movements for two buffalo; sites of capture and resighting are shown for the third buffalo. A complete description of the movements of these three buffalo is provided in the expanded figure legend online (wwwnc.cdc.gov/EID/article/22/2/14-0864-F1.htm).
Social Dynamics within Mixed Herds Are More Fluid Than Expected
Based on the studies in GNP, KNP and Hwange NP (HNP), adult female dyads within a mixed herd were shown to be sometimes loosely associated, and that dyad association patterns varied between sites (Figure 6.3). For example, a majority of loose dyad associations were found in GNP and KNP (with 15–50 per cent of time spent together within a mixed herd) and the OD (most dyads with >30 per cent HR overlap spent <30 per cent of the time together) versus more lasting dyad association in HNP (with the majority of dyads spending 40–65 per cent of time together).
These results challenge previous works that proposed a more cohesive definition of mixed herds (Grimsdell, Reference Grimsdell1969; Sinclair, Reference Sinclair1977; Prins, Reference Prins1996). The fact that intraherd associations for adult cows seem to be looser than expected in Figure 6.2 indicates either that the social dynamics within the mixed herds studied in southern Africa differed from those of the mixed herds studied in eastern Africa, or that these previous studies, which did not use precise individual tracking, could not detect such dyad dynamics. Another interpretation could be that in more recent times, the disturbances created by humans at the periphery or in protected areas (most buffalo mixed herds followed in Figure 6.3 live on the periphery of protected areas) have impacted the social dynamics of mixed herds compared to earlier studies implemented in the heart of more intact protected areas.
Gaps in Knowledge and Hypotheses about Mixed Herds
If a mixed herd is not the cohesive social unit within which individuals spend most of their time together, it could hypothetically be the case within a smaller social unit, which we will define as a core group and within which individuals would spend most of their time together (Korte, Reference Korte2009; Table 6.1).
Table 6.1 Information about studied African buffalo populations across their range; classes are (1) habitat where water is not a limiting factor; (2) woodland/forest habitat; (3) habitat with water as a limiting factor during the dry season. Site gives area name and country. Habitat heterogeneity provides the proportion of grassland in the home range. Water provides the average annual rainfall and the availability of water during the dry season. HR = home range (minimum and maximum recorded) including acronym of the methodology used to measure the HR.
| Site | Country | Subspecies | Study years | Dominant habitat | Water during dry season (average rainfall in mm) | Home range min, max/method | Mixed herd size | Largest observed association | Long-distance movement | Herd switching | Type of social units | Class | Source |
|---|---|---|---|---|---|---|---|---|---|---|---|---|---|
| Matusadona NP | Zimbabwe | S. c. caffer | 1973–1983 | Open grassland | Lake Karimba (400–800 mm) | 60–110 km² (MCPFootnote *) | >500 | NA | NA | Mixed herd | 1 | Taylor, Reference Taylor1985 | |
| Hwange NP | Zimbabwe | S. c. caffer | 2010–2015 | Woodland and bushland savannas | Pumped waterholes (600 mm) | 27–161 km² (seasonal; BBMMFootnote ** 90%) | 50–250 (at capture) | 800+ | 115 km (adult female) | NA | Mixed herd | 3 | Miguel et al., Reference de Garine-Wichatitsky, Miguel and Mukamuri2013, Reference Miguel, Grosbois and Fritz2017; Valls-Fox et al., Reference Valls-Fox, Chamaillé-Jammes and de Garine-Wichatitsky2018; Wielgus et al., Reference Wielgus, Cornélis and de Garine-Wichatitsky2020, Reference Wielgus, Caron and Bennitt2021 |
| Gonarezhou–North Kruger NP | Zimbabwe South Africa | S. c. caffer | 2008–2015 | Open grassland, woodlands | River pools (600 mm) | 8–82 km² (seasonal; BBMM 90%) | 20–250 | 250 | 96 km (juvenile females) | Yes | Mixed herd | 3 | Miguel et al., Reference de Garine-Wichatitsky, Miguel and Mukamuri2013; Caron et al., Reference Caron, Cornélis and Foggin2016; Wielgus et al., Reference Wielgus, Cornélis and de Garine-Wichatitsky2020, Reference Wielgus, Caron and Bennitt2021 |
| Kruger NP | South Africa | S. c. caffer | 2002–2013 | Open grassland, woodlands | River pools (600–1000 mm) | 40–70 km² (95% LoCoHFootnote ***) 100–460 km² (100% UD) | Mean between 250 and 550 Median dry season = 45 (range: 1–1200) Median wet season = 4.5 (range = 1–250) | 1200 | 110 km (dispersal, young adult females) | NA | Mixed herd | 3 | Hughes et al., Reference Hughes, Fosgate and Budke2017; Winnie et al., Reference Winnie, Cross and Getz2008; Spaan et al., Reference Spaan, Epps, Ezenwa and Jolles2019 |
| Klaserie Private Nature Reserve | South Africa | S. c. caffer | 1995–2000 | Open grassland, woodlands | Pumped waterholes/river pools (486 mm) | 103–266 km² (MCP) 197–342 km² (FKE 95%Footnote #) 83–251 km² (LoCoH) | 180–225 | 400 | NA | NA | Mixed herd | 3 | Ryan et al., Reference Ryan, Knechtel and Getz2006 |
| Caprivi strip | Namibia Botswana | S. c. caffer | 2007–2010 | Open grassland, woodlands | Perennial rivers (650 mm) | 5.5–564 km2 (r-LoCoH) | NA | NA | 100–200 km (females) | Yes | Mixed herd | 1? | Naidoo et al., Reference Naidoo, Du Preez and Stuart-Hill2012a, Reference Naidoo, Du Preez and Stuart-Hill2012b, Reference Naidoo, Du Preez and Stuart-Hill2014 |
| Okavango Delta | Botswana | S. c. caffer | 2007–2010 | Open grassland | Okavango Delta (450 mm) | 100–280 km2 (seasonal; r-LoCoH) | 100–200 | 2000+ | 50 km (migration) | Yes | Mixed herd | 1 | Bennitt et al., Reference Bennitt, Bonyongo and Harris2016, Reference Bennitt, Bonyongo, Harris and Barrett2018 |
| Serengeti Greater Ecosystem | Tanzania Kenya | S. c. caffer | 1966–1973 | Open grassland | Few perennial rivers (500–1000 mm) | 222 km2 (MCP) | 50–400 | 1750 | NA | NA | Mixed herd | 3? | Sinclair, Reference Sinclair1977 |
| Ruaha NP | Tanzania | S. c. caffer | 2014–2016 | Miombo/Commiphora–Combretum woodland/acacia savanna | Perennial rivers (500–800 mm) | 73–601 km2 (seasonal, 95% BBMM) | 100–1000 | NA | Migratory, expander | Yes | Mixed herd | 3 | Roug et al., Reference Roug, Muse and Clifford2020 |
| Manyara NP | Tanzania | S. c. caffer | 1981–1985 | Open grassland | Manyara Lake (620 mm) | NA | 12–980 | 980 | 40–50 km (adult bulls) | No | Mixed herd Bachelor group | 1 | Prins, Reference Prins1996 |
| W NP | Niger | S. c. equinocalis | 2007–2008 | Combretum shrub savanna/Sudanian vegetation | River pools (685–850 mm) | 168–503 km2 (MCP) | 16–76 | 150 | 30–50 km (migration) | NA | Mixed herd | 3 | Cornélis et al., Reference Cornélis, Benhamou and Janeau2011 |
| Lope NP | Gabon | S. c. nanus | 2002–2004 | Tropical forest | Perennial water sources | 2.41–10.56 km2 (MCP) 2.30–7.64 km2 (LoCoH) | 12 ± 2 | 44 | NA | Yes | Mixed herd | 2 | Korte, Reference Korte2008 |
| Ndanza-Ndoki | Central African Republic | S. c. nanus | 2002–2004 | Tropical forest | Perennial water sources (1365 mm) | 8 km2 (MCP-type) | 16–24 | NA | NA | NA | Mixed herd | 2 | Melleti et al., 2007 |
* Minimum Convex Polygon;
** Brownian Bridge Models;
*** Local nearest-neighbour convex-hull construction;
# Fixed Kernel Estimator 95%;
## Kernel-based utilization distribution.
Adult females, calves and juveniles of both sexes and possibly adult males can potentially belong to this core group (Grueter et al., Reference Grueter, Qi, Li and Li2017). The existence of these core groups (or ‘basic herds’ or ‘subgroups’) has already been suggested (Sinclair, Reference Sinclair1977; Mloszewski, Reference Mloszewski1983). Several storylines could explain why individual buffalo would spend most of their time together. First, core herds could be based on kinship, containing mothers and several generations of their offspring, with young females staying with their mothers until the birth of their first calf and perhaps longer, and juvenile males leaving this association earlier (Sinclair, Reference Sinclair1977; Mloszewski, Reference Mloszewski1983; Prins, Reference Prins1996). Second, individuals having the same metabolic requirements could spend time together. However, this second storyline would imply that core groups are not stable over time as individual metabolic requirements can vary (e.g. with reproductive status). Third, some behaviours could benefit clusters of individuals that would spend more time together; such behaviours could concern anti-predation or anti-parasite, competition avoidance and information sharing on food resources, among others. These storylines are not mutually exclusive and various authors have described mixed herds as a composition of family groups, juvenile groups (male or female) and single males.
Field observations provide indications about the size of core groups based on the smallest units observed. In the savannas of GNP, Zimbabwe, groups of 20–40 buffalo were regularly seen during a study between 2007 and 2012 (Caron, personal observation). In tropical forests of Lope NP in Gabon, Korte (Reference Korte2008) observed a mean group size of 12 (range 3–24) Syncerus caffer nanus individuals per group. In the Guinean–Congolian Forest of Central African Republic, Melletti et al. (Reference Melletti, Penteriani, Mirabile and Boitani2007) studied over two years a herd of the same S. c. nanus subspecies comprising 16 individuals (one adult male, nine adult females, five juveniles and one calf) that only increased to 24 individuals through reproduction within the herd. Most buffalo groups observed in the OD contained 50–200 individuals (54 per cent of groups; Bennitt et al., Reference Bennitt, Bonyongo and Harris2016). The core group’s size (and composition) may vary between buffalo subspecies and geographical areas. Kinship could form the basis of mixed herds, with several core groups sharing the same HR but intermingling at times.
Against this kinship hypothesis is the observation that individuals collared in the same group (i.e. individuals that were together at the time of darting and fitting GPS collars) at the beginning of a study engage in highly heterogeneous fusion–fission dynamics (Prins, Reference Prins1989a). Wielgus et al. (Reference Wielgus, Cornélis and de Garine-Wichatitsky2020) analysed the associations of 4–6 individual buffalo collared in the same groups in GNP, HNP and KNP and found almost no stability in dyad observations. In addition, genetic characterization of individuals (both males and females) captured in the same herds in GNP and KNP revealed low levels of genetic relatedness, which were similar to relatedness values between individuals from different herds. This suggests that herds may contain many unrelated buffalo (Wielgus et al., personal communication). The combination of genetic and GPS data has also shown that the strength of female–female associations studied within three herds was not strongly influenced by their genetic relatedness. However, these observations should be considered cautiously, as few individuals from the same herd were both simultaneously monitored and genotyped (n = 3, 4 and 6 individuals in each herd). Sinclair (Reference Sinclair1977) observed mixed herd size variation around focal marked individuals through direct observation and aerial photographs. Herd size varied throughout the year and between HR areas, ranging from 90 to 428 individuals (Sinclair, Reference Sinclair1977). In the same study, two cases were reported of buffalo being darted and then joining a herd different from their original one. They were chased by the hosting herd and remained at the periphery of the herd (and one was quickly killed by a lion). In contrast, Grimsdell (Reference Grimsdell1969) found a relative stability of mixed herd size and composition in Queen Elizabeth NP, Uganda during a one-year study.
A better understanding of what constitutes a mixed herd therefore requires understanding of its inner dynamics and the existence or not of core groups. Currently available data indicate that buffalo herds experience very frequent fusion–fission dynamics, which seem to contradict the core group existence, with the exception of the very close association between mothers and calves. This fluidity also seems to exist at a higher order: numerous observations of groups of 1000–2000 individual buffalo suggest that distinct mixed herds could undergo fusion (Sinclair, Reference Sinclair1977; Chardonnet, personal communication; Table 6.1). While there are few continuous observation data available on these mega herds, it seems that their existence is temporary and responds to environmental drivers (Table 6.1). Given the little overlap observed between adjacent herds (less than 8 per cent of the HR), the gathering of several mixed herds raises the question of the HR of these temporary mega herds. It could span over more than one mixed herd’s HR or concentrate at very specific times on highly concentrated resources (see subsequent sections).
Knowledge of bachelor groups, the specific male-based social unit, has not significantly improved in recent years, mainly due to the reduced longevity of telemetry devices fitted on male buffalo (i.e. collars usually fail within a few weeks after deployment, probably due to the specific aggressive behaviour and strength of adult males; Taolo, Reference Taolo2003). Bachelor group size ranges from a couple of individuals up to 51, with 20 already being an unusual observation (Sinclair, Reference Sinclair1977; Prins, Reference Prins1989a; Hughes et al., Reference Hughes, Fosgate and Budke2017). Larger bachelor groups might form as a response to high levels of predation pressure from lions that prefer buffalo prey. They represent social associations based partially on similar metabolic requirements, that is to build on strength to face better odds of reproduction when joining mixed herds (i.e. re-entrant consecutive polygyny; Prins, Reference Prins1989b). Sinclair indicated that in the Serengeti they could represent 5.7 per cent and 15 per cent of the adult male and total populations, respectively (Sinclair, Reference Sinclair1977), proportions that increased during the dry season.
On the Difficulty of Understanding Social Dynamics in Buffalo
The ability of the African buffalo to cope with contrasting environmental conditions throughout most sub-Saharan ecosystems by modulating a large array of biological traits (weight, herd and HR sizes, etc.) highlights a high degree of behavioural plasticity. This plasticity, which allows the buffalo to enjoy a very wide distribution range in Africa (>200 mm rainfall), is a factor that challenges the understanding of the social dynamics of this species (Prins, Reference Prins1996). In this context, one main challenge is the ability to sample social movements and interactions at different scales and over time, between and within ecosystems, between and within adjacent social units, and finally within cohesive social units.
More recent research presented here has benefited from the use of GPS collaring technology, which provides almost continuous, accurate information on the location of each collared animal. However, it does not provide information about the group size or individual composition around the focal individual equipped with a GPS collar. Therefore, a dyad identified by telemetry does not indicate whether focal individuals associate in dyads within a defined social group (e.g. a core group). A limit to this technology is that the impact on the behaviour of individuals chased and darted from a helicopter to deploy collars has not been extensively measured and could trigger short-and longer-term behavioural responses that could blur the social dynamics studied (e.g. effect on mortality; Oosthuizen et al., Reference Oosthuizen, Cross and Bowers2009).
In addition, there is a large number of indices to quantify the overlap between HRs (e.g. Fieberg and Kochanny, Reference Fieberg and Kochanny2005), which can also be delimited in many ways, for example using minimum convex polygon (MCP) and utilization distribution (UD) methods. Recently, alternative methods that more explicitly consider the temporal component of movement data have been proposed, including the Brownian bridges methods (Benhamou and Cornélis, Reference Benhamou and Cornélis2010). The variability of methods can restrain understanding of social dynamics at the species level because comparisons between studies using distinct methods or applications are limited. For example, we used data from the telemetry studies described above (Bennitt et al., Reference Bennitt, Bonyongo, Harris and Barrett2018; Wielgus et al., Reference Wielgus, Cornélis and de Garine-Wichatitsky2020) to compare four empirical HR estimation methods: MCP, a fixed kernel utilization density method (KUD with least squares cross-validation, LSCV), a local convex-hull construction method (r-LoCoH) and Brownian random bridge model method (BRBMM) for 99, 90 and 50 per cent isopleths. These methods demonstrated the potentially different size estimates of the HR that we can obtain using the same data sets. In general, annual HRs obtained using BRBMM and KUD were substantially smaller than those estimated from MCP (e.g. 3.2 and 2.5 times greater than BRBMM and KUD, respectively, for the 90 per cent isopleth) and LoCoH (e.g. 2.2 and 1.7 times greater than BRBMM and KUD, respectively, for the 90 per cent isopleth), irrespective of the isopleth used to define the bounds. For these same data, the degree of overlap between seasonal HRs calculated with Bhattacharyya’s affinity index was greater than when calculated with the Utilization Distribution Overlap Index (UDOI). A similar comparison was conducted by Ryan et al. (Reference Ryan, Knechtel and Getz2006), with the MCP method giving a larger range size than the LoCoH method. In the future, standardizing variables should be used to facilitate comparisons between populations and improve our understanding of buffalo herd definition.
Additionally, GPS collars can provide key information about proximity between buffalo dyads, which can be interpreted in the context of social associations, enabling the identification of fusion–fission events (Bennitt et al., Reference Bennitt, Bonyongo, Harris and Barrett2018; Wielgus et al., Reference Wielgus, Cornélis and de Garine-Wichatitsky2020). However, these studies rely on an external definition of a proximity and temporal threshold determining whether buffalo dyads are ‘together’ or ‘apart’, and variation in this threshold can alter interpretation. Definitions of fusion–fission events should therefore be informed by buffalo detection capabilities rather than those of observers, which could lead to new interpretations of buffalo social systems. Knowledge is still missing to determine at what distance buffalo still perceive themselves as being together or not (e.g. what is the threshold beyond which an individual will react to a flight behaviour by the mixed herd?).
Determining the evolution of group size around a focal individual is also a crucial parameter to explore fusion–fission dynamics. Regular direct observation can in principle estimate this parameter if the focal individual is easily identifiable (e.g. with a color tag or collar; Grimsdell, Reference Grimsdell1969; Prins, Reference Prins1996). However, recent studies tend to focus on telemetry technology to remotely follow buffalo movements. This technology falls short of identifying group size and individuals moving or not in association with the collared individuals. Therefore, group size estimations around focal individuals will require direct observation studies or approaches combining telemetry and unmanned aerial vehicles, for example capturing regularly the group size around the collared individuals after locating it. The advent of proximity sensors should be a powerful tool for understanding social dynamics in African buffalo. These sensors record when two collared animals are close to each other according to the specified spatial threshold, and their lower cost compared to GPS technology makes it possible to monitor simultaneously a larger number of individuals, which is especially relevant for this species (Prange et al., Reference Prange, Jordan, Hunter and Gehrt2006; Hamede et al., Reference Hamede, Bashford, McCallum and Jones2009; Walrath et al., Reference Walrath, Van Deelen and VerCauteren2011). Additionally, when synchronized with GPS data (collected on some animals), the use of proximity sensors can help better identify the location of fusion and fission events, and therefore, the external drivers of fusion–fission dynamics.
Fluidity in Group Dynamics and Its Drivers – Conceptual Framework
Given the female-based social units described in the previous sections, and using the highly dynamic fusion–fission patterns of adult females observed with telemetry, Figure 6.4 presents a revised framework including the level of fluidity in social dynamics. In recent studies, the number of fusion–fission events between dyads of cows (dyads were considered together if at 1 km or less at the same time log) belonging to the same herd ranged on average between 4.04 and 5.73 per month during the dry season and 8.22 and 10.30 per month during the wet season in GNP, HNP and KNP (Wielgus et al., Reference Wielgus, Cornélis and de Garine-Wichatitsky2020); and in the OD, the mean number of fusion events per dyad ranged between 2.7 and 5.5 during the different seasons of 2008 and 2009 (dyads were considered together if at 300 m or less at the same time log; Bennitt et al., Reference Bennitt, Bonyongo, Harris and Barrett2018). These data would indicate fusion–fission dynamics corresponding to the right-end panel of Figure 6.4.

Figure 6.4 Framework of social units and dynamics of African buffalo. The three female-based social units (i.e. core, mixed and mega herds) are presented in a fluid diagram. We hypothesize that there is a fluidity between these social units in the same buffalo grouping, depending on drivers discussed in this chapter.
These dynamics both respond to a set of external factors, reviewed in the next section, and result from individual decision making (Cross et al., Reference Cross, Lloyd-Smith, Johnson and Getz2005). A dominance of fusion events will cause the formation of larger groups, whereas frequent fission events will lead to smaller groups. Prins (Reference Prins1996) observed in Manyara NP, Tanzania, that larger herds tended to split more often than smaller herds. Individual decisions may be triggered by resource competition within mixed herds, predation risk (e.g. the larger the group in open habitat, the lesser the predation risk per individual), kinship bonding (e.g. related to the core group concept), activity synchronizing and access to collective knowledge to deal with habitat heterogeneity and access to vital resources. Investigating the position of individuals within the herd, Prins (Reference Prins1996) hypothesized about the use of fission by rear individuals to ‘overcome social inequality’ of not accessing good resources compared to animals at the front. Apart from this, knowledge of how buffalo decide whether to stay in an association or not remains scarce.
External Drivers of Fusion–Fission Dynamics
Resource Distribution and Habitat Heterogeneity
Resource availability is closely related to variation in social organization in social ungulates (Jedrzejewski et al., Reference Jedrzejewski, Spaedtke and Kamler2006; Isvaran, Reference Isvaran2007; Fortin et al., Reference Fortin, Fortin and Beyer2009). When forage and water are relatively scarce and/or distributed in small, distant patches, animals are expected to form smaller groups and aggregate in areas or during times where or when resources are abundant. Interestingly, studies investigating temporal variation in group size in African buffalo described seasonal changes in group size that hint at the role of resource condition as a driver of fusion–fission dynamics (e.g. Sinclair, Reference Sinclair1977; Melletti et al., Reference Melletti, Penteriani, Mirabile and Boitani2007; Hughes et al., Reference Hughes, Fosgate and Budke2017). However, they reported contrasting results depending on the geographical areas and the subspecies. For instance, while S. c. caffer groups from Klaserie Private Nature Reserve (South Africa; Ryan et al., Reference Ryan, Knechtel and Getz2006) and Serengeti NP (Serengeti; Sinclair, Reference Sinclair1977) occurred in larger herds during the wet season, the opposite was reported in S. c. caffer groups from Chobe NP (Botswana; Halley et al., Reference Halley, Vandewalle, Mari and Taolo2002) as well as in S. c. nanus herds living in Dzanga–Ndoki NP (Central African Republic; Melletti et al., Reference Melletti, Penteriani, Mirabile and Boitani2007). Conversely, Korte (Reference Korte2008) reported that S. c. nanus herds were relatively stable between seasons at Lopé NP (Gabon). Irrespective of the group size, the monitoring of adult females in KNP, GNP and HNP revealed seasonal differences in the underlying patterns of fusion–fission events within herds, with higher fusion–fission dynamics during the wet season, while fusion–fission dynamics in the OD did not vary seasonally (Bennitt et al., Reference Bennitt, Bonyongo, Harris and Barrett2018; Wielgus et al., Reference Wielgus, Cornélis and de Garine-Wichatitsky2020). This suggests that environmental heterogeneity affects buffalo group dynamics, but in different ways depending on the geographical areas.
In social ungulates, larger and tighter groups are more common in open habitats where visibility is higher than in closed habitats. Large group sizes facilitate social cohesion, improve protection against predators and parasites (e.g. ticks, flies) and possibly provide access to more abundant forage for grazing (Jarman, Reference Jarman1974; Isvaran, Reference Isvaran2007; Pays et al., Reference Pays, Benhamou, Helder and Gerard2007; Sueur et al., Reference Sueur, King and Conradt2011). A tendency for buffalo to occur in larger groups in open habitats, such as grassland, as well as in more homogeneous areas has been noticed in Hluhluwe–iMfolozi Game Reserve during both dry and wet seasons (Dora, Reference Dora2004). Therefore, one hypothesis is that as the habitat opens and turns into more (larger patches of) grasslands, fusion–fission dynamics will tend to create larger herds, up to mega herds, compared to woodland habitats hosting smaller mixed herds (Figure 6.4). This hypothesis is also supported by field observations in Matusadona NP, Zimbabwe (Taylor, Reference Taylor1985), Serengeti NP, Tanzania (Sinclair, Reference Sinclair1977) and forest buffalo in Gabon (Korte, Reference Korte2008). Mloszewski (Reference Mloszewski1983) proposed three types of herds depending on the habitat: open grassland habitat that allows the largest herds with water available throughout (e.g. OD or Matusadona NP); well-watered woodland habitat hosting smaller herds (e.g. forest buffalo in tropical forests); and drier habitats where the need to regularly commute between water and pasture encourages smaller herds and the greatest degree of herd discipline (e.g. GNP, HNP or KNP; Table 6.1). GPS monitoring of adult females revealed that habitat openness had a minor effect on the patterns of associations among individuals and the location of fusion–fission events. Similarly, in the same study, although the scarcity of water during the dry season in such habitats might be expected to affect the social dynamics of buffalo, a significant, but weak, effect of distance to water on the patterns of associations and the location of fusion–fission events between adult females was observed (Wielgus et al., Reference Wielgus, Cornélis and de Garine-Wichatitsky2020).
Bachelor groups often concentrate around small patches of good-quality grazing, too small for larger herds to exploit (Taylor, Reference Taylor1985; Prins, Reference Prins1996).
Predation and Parasitism
The ‘ecology of fear’ has detailed the behavioural and ecological trait changes of numerous prey species and their consequences in response to predators in temperate and tropical ecosystems (Buck et al., Reference Buck, Weinstein and Young2018). For instance, Tambling et al. (Reference Tambling, Druce and Hayward2012) documented the changes in the behaviour of S. c. caffer following the reintroduction of lions (Panthera leo) into the Addo Elephant National Park, South Africa. Buffalo responded by increasing group sizes and switching habitat preferences towards more open grasslands during lions’ hunting hours, which countered the initial high levels of predation on juvenile buffalo experienced just after the reintroduction of the predator.
Although parasites (broadly including micro- and macroparasites) can also cause hosts to adopt defensive strategies that reduce infection risks, the ‘ecology of disgust’ has not yet provided strong empirical and theoretical evidence of the causes and consequences of such anti-parasite behaviours (Buck et al., Reference Buck, Weinstein and Young2018). The ‘encounter-dilution’ effect provides protection when the probability of detection of a group does not increase in proportion to an increase in group size provided that the parasites (or predator) do not offset the encounter effect by attacking more members of the group (Mooring and Hart, Reference Mooring and Hart1992). This mechanism could provide larger groups of buffalo with some added protection against parasites that actively seek their hosts, such as biting flies (e.g. tabanids, Glossina spp). The ‘selfish herd’ effect provides protection from predators to animals that are in the centre of a group (Hamilton, Reference Hamilton1971), which also protects against biting parasites (Mooring and Hart, Reference Mooring and Hart1992). Ungulate hosts have evolved adaptive strategies to minimize their exposure to parasites (Gunn and Irvine, Reference Gunn and Irvine2003; Fritzsche and Allan, Reference Fritzsche and Allan2012), and the adoption of such grouping and foraging strategies could provide some protection to buffalo herds against free-living stages of significant ectoparasites, such as ticks in southern African savanna ecosystems (de Garine-Wichatitsky et al., Reference de Garine-Wichatitsky, De Meeus, Guegan and Renaud1999; de Garine-Wichatitsky, Reference de Garine-Wichatitsky2000).
In conclusion, analysing the causes and consequences of predation and parasitism on African buffalo grouping strategies is not trivial. Despite relatively abundant literature documenting the effects of parasites on buffalo populations, including detailed surveys of the complex interactions between parasites (Jolles et al., Reference Jolles, Ezenwa and Etienne2008; Ezenwa et al., Reference Ezenwa, Jolles, Beechler, Wilson, Fenton and Tompkins2019; Chapter 11), there is a need for further empirical data specifically documenting group size variations of buffalo herds and their epidemiological consequences. Furthermore, it is likely that some consequences of buffalo herding strategies may differ fundamentally between predation and parasitism, with contrasted consequences depending on the mode of transmission of parasites (density- versus frequency-dependent transmission; Heesterbeek and Roberts, Reference Heesterbeek and Roberts1995).
Anthropological Drivers
Although few buffalo populations remain unaffected by human activities, little is known about the impact of human activities and infrastructures on fusion–fission dynamics in African buffalo. Naidoo et al. (Reference Naidoo, Du Preez and Stuart-Hill2012a, Reference Naidoo, Du Preez and Stuart-Hill2012b) explored the influence of infrastructure such as (wildlife management or veterinary) fences, roads, fires, cultivated areas and homesteads on the dispersal and home range of African buffalo in the Caprivi strip in Bostwana/Namibia, and noted that they all influenced buffalo movements and HRs as no through zones (e.g. fence, roads) or no-go zones (e.g. villages or recently burnt areas). In Zimbabwe, in HNP, KNP and GNP studies, African buffalo were seldom seen outside of protected areas (Miguel et al., Reference Miguel, Grosbois and Fritz2017; Valls-Fox et al., Reference Valls-Fox, Chamaillé-Jammes and de Garine-Wichatitsky2018). In Figure 6.1, the right-hand side boundary for both herds is a railway line doubled with a dirt road crossing through the GNP; no adult female buffalo ever crossed that line even after coming very close to it (Caron, personal observation). Buffalo regularly cross over the poorly maintained veterinary fence around the OD, most likely seeking productive forage, and several individual male buffalo were seen in Maun in 2021. In Kasane town, Botswana, buffalo just ignore the tarmac main road (Chardonnet, personal communication).
Besides the impact of humans on buffalo movements and HRs, little is known about the impact of cattle encounters on fusion–fission dynamics in buffalo mixed herds. Over most of their current distribution in sub-Saharan Africa, the ranges of buffalo and cattle populations extensively overlap, and they often share forage and grazing resources (Chapter 10). However, at a fine scale, there are few field observations of free-ranging buffalo mingling with cattle on the same grazing grounds, drinking together from the same waterholes, or any other activity implying close direct contact between individuals from the two species. On the contrary, most field evidence indicates that buffalo tend to avoid areas occupied by cattle herds. For instance, a spoor survey conducted to monitor the movements of wildlife and livestock across the damaged FMD fence of southern GNP found that cattle and buffalo used different sections of the damaged fence (Chigwenhese et al., Reference Chigwenhese, Murwira and Zengeya2016), while Hibert et al. (Reference Hibert, Calenge and Fritz2010) demonstrated a similar trend, with a clear separation of buffalo from cattle tended even at large scales in the WNP in West Africa. At a finer scale, Valls-Fox et al. (Reference Valls-Fox, Chamaillé-Jammes and de Garine-Wichatitsky2018) were able to further quantify the movement patterns of sympatric free-roaming buffalo and herded cattle using GPS empirical data combined with spatial modelling, according to seasonal changes of surface water availability in an interface area of HNP. As expected, both cattle and buffalo preferred open grassland habitats found close to water, but buffalo avoidance of cattle varied seasonally. During the rainy season, buffalo avoided cattle completely at the HR scale, whereas during the dry season, when cattle ranged further into the protected area in search of forage, buffalo and cattle spatial overlap increased as water dependence took precedence over avoidance (Valls-Fox et al., Reference Valls-Fox, Chamaillé-Jammes and de Garine-Wichatitsky2018). The same study observed a more nocturnal use by buffalo of shared pastures between both species, at a time when cattle are penned in ‘kraals’ close to their owner’s homestead. Although it is still unclear whether buffalo avoid cattle, or possibly their herders, dogs or other associates, and what cues they use to detect and minimize contacts, this could open perspectives for the management of wildlife–livestock interfaces (Sitters et al., Reference Sitters, Heitkönig, Holmgren and Ojwang’2009; Caron et al., Reference Caron, Angel Barasona, Miguel, Vicente, Vercauteren and Gortázar2021). Valls-Fox et al. (Reference Valls-Fox, Chamaillé-Jammes and de Garine-Wichatitsky2018) suggested that long-term planning of both artificial water provisioning and traditional cattle-herding practices could help maintain spatial segregation and thus mitigate conservation conflicts such as pathogen transmission, crop-raiding and livestock depredation. Finally, if, when encounters occur, they result in fusion–fission events as observed when one encounters buffalo groups, one would expect that the size of buffalo groups closer to park boundaries would be smaller than those further from boundaries.
Conclusion
Since Prins (Reference Prins1996), the understanding of the dynamics of mixed herds of buffalo has evolved, mainly due to breakthroughs in telemetry technology. Associations of buffalo are now considered more fluid than the initial idea of a stable mixed herd fixed in a home range. Individual buffalo belonging to a mixed herd participate in extensive fusion–fission events and can spend less than 30 per cent of their time together. In addition, dyads are not stable over time and patterns of individuals’ association within mixed herds are not clear. A mixed herd is therefore better defined by a fixed home range shared by individuals, and mixed herd switching by young or adult females has been observed on several occasions (Table 6.1). Individuals within mixed herds may associate based on kinship or shared metabolic requirements, and attempts to test these hypotheses have been inconclusive so far. These two non-exclusive hypotheses should attract more attention in future studies. These interpretations are mainly based on studies in southern Africa and their replication in other regions where the species occur would be welcome.
The dynamics of fusion–fission events within mixed herds are largely driven by habitat heterogeneity and the quality and quantity of grazing and surface water (Winnie et al., Reference Winnie, Cross and Getz2008). The size of grazing patches and water points determine the size of mixed herds that can crop them, and their distribution across space trigger fusion–fission dynamics. Additional drivers such as predation, parasitism or fires also influence mixed herd dynamics. However, most African buffalo populations today are exposed to some degree of human activity (traditional and trophy hunting, cattle grazing, roads, fences and fire to name a few). Human activities have been shown to impact buffalo movements, home ranges and daily activities (Naidoo et al., Reference Naidoo, Du Preez and Stuart-Hill2012a; Valls-Fox et al., Reference Valls-Fox, Chamaillé-Jammes and de Garine-Wichatitsky2018). The fluidity of the buffalo social system as updated in this chapter may help the species to adapt to changing environments and expanding buffalo/cattle/human interfaces (Figure 6.5). However, given the potential impact of climate change on water availability in Africa (James and Washington, Reference James and Washington2013), the drier conditions that will be experienced in semi-arid ecosystems in the coming decades may alter external drivers (e.g. intensity of buffalo/cattle/human interfaces) and herd dynamics (less), home range (larger) and group size (smaller) (Naidoo et al., Reference Naidoo, Du Preez and Stuart-Hill2012a; Roug et al., Reference Roug, Muse and Clifford2020; Wielgus et al., Reference Wielgus, Cornélis and de Garine-Wichatitsky2020).

Figure 6.5 Herd of Cape African buffalo observed from a helicopter, central Botswana.
Some large buffalo populations also remain unstudied. For example, 21,000 buffalo are estimated in Maromeu National Reserve in Mozambique and 12,000 in Zakouma National Park (Chapter 4). Forest buffalo are largely understudied despite their importance to confirm or not the existence of a core group for the species. Studies on these populations could shed light on the ‘natural’ ecology of buffalo populations in different contexts, as some remain relatively free of human impact.
In 1977, Sinclair concluded: ‘we need more data on the degree to which animals move between herds and whether there are characteristic gene frequencies for each herd’. These needs are still valid today, and one could add ‘how animals move within herds’. Future studies will benefit from more advances in telemetry, using cheaper devices (e.g. ear tags, proximity tags), new technologies (e.g. drones to regularly estimate group size around focal/collared individuals), new information sources (e.g. sound recorders) and non-invasive genetic studies to enhance our knowledge of buffalo social dynamics. These future studies should not forget that longitudinal observational studies based on fieldwork by researchers will always bring additional information that new technologies promoting remote access to data tend to occult.
Introduction
Population dynamics is concerned with changes in a population over time. Understanding these dynamics facilitates the early detection of growing or declining trends in a population. If necessary, appropriate control or protection strategies can then be introduced timeously to deal with undesirable trends (Mertens, Reference Mertens1985; Jolles, Reference Jolles2007). This is needed both for the conservation of African buffalo (Syncerus caffer) and for designing optimal strategies for their harvesting (e.g. hunting) or even ranching (Chapters 13 and 16).
Several studies (e.g. Sinclair, Reference Sinclair1977; Mertens, Reference Mertens1985) collected data in the field and subsequently processed these data to produce life tables of buffalo populations. For humans, actuaries use life tables to determine the expected life expectancy of an individual, and hence perhaps the appropriate life insurance premium for that individual to pay. Due to practical difficulties in collecting data, life tables for buffalo are generally less accurate than those for humans. More importantly, in wildlife management the purpose of life tables is different. Forecasting is essential for good management and life table data can be used in a model to project a population into the future. Even for this purpose, however, the utility of such a model is limited. Population dynamics of buffalo populations are frequently event-driven. For example, droughts, disease and poaching may invalidate any forecast based on life tables. Moreover, wildlife managers require scenario-based rough estimates rather than precise population projections into the future. Roughly what proportion of a herd will die if a severe drought occurs next year? Hence, should any intervention be considered? Indeed, for a herd of 500 buffalo, the answer to this last question is not likely to differ whether there is an expected loss of 105 or 125 animals.
Investigating the dynamics of a population usually involves the use of mathematical models. There is a diverse array of such models. Therefore, before commencing any formulation or use of a model it is important to be very clear about its purpose. What are the questions for which one seeks answers? What understanding of system behaviour is sought? Only once the aims and the purpose of the model are clear can the appropriate type of model be chosen.
In this chapter, we first discuss various exogenous factors that disrupt population trajectories. We focus particularly on drought and disease. This is followed by a discussion on the constraints that these factors play in the types and goals of models that can provide any useful insight. Finally, we show the importance of age structure in determining population dynamics. We will illustrate how aggregated population data might in fact mislead observers.
Factors Affecting Population Dynamics
Droughts
The rinderpest outbreak in Africa in the 1890s reached southern Africa around 1896, peaked in 1897–1898 and severely impacted artiodactyl populations in Africa. Stevenson-Hamilton (Reference Stevenson-Hamilton1929) reported that the disease ‘…reduced the already much depleted buffalo herds to about a dozen individuals’ in what is now Kruger National Park (KNP). Impressive conservation efforts during the early twentieth century and the recovery of rangelands following the large-scale, disease-related grazer die-off contributed to the recovery of game populations. However, African buffalo remain susceptible to drought (Sinclair, Reference Sinclair1977; Smuts, Reference Smuts1982; Walker et al., Reference Walker, Emslie, Owen-Smith and Scholes1987; Prins, Reference Prins1996; Peel and Smit, Reference Peel and Smit2020; Smit et al., Reference Smit, Peel and Ferreira2020). As the doyen of South African nature conservation, James Stevenson-Hamilton observed, ‘During the severe drought at the end of 1935, when the rains failed completely, and the Lower Sabie area was quite bare of grass, the buffaloes suffered terribly’ (Stevenson-Hamilton, Reference Stevenson-Hamilton1947, p. 85). This pattern of sensitivity to drought is further illustrated by, among others, Walker et al. (Reference Walker, Emslie, Owen-Smith and Scholes1987) describing the impact of the severe 1981–1984 drought, exacerbated by water provision, that affected most of southern Africa, causing extensive grass mortality and grazer mortality in particular. Peel and Smit (Reference Peel and Smit2020) describe declines in the buffalo population of between 77 per cent in an area that was minimally managed and declines of 29 per cent and 35 per cent, respectively, in areas where management removals were carried out before the 2014/15–2016/17 drought developed fully. Furthermore, regional buffalo population declines were highest in areas with a high density of artificially provided water points and associated low herbaceous biomass (Smit et al., Reference Smit, Peel and Ferreira2020).
Stevenson-Hamilton (Reference Stevenson-Hamilton1947, p. 85) further states, ‘Such few calves as were born did not survive…’. This is a very pertinent observation, yet more detailed observations appear to indicate that recently weaned juveniles are the first to die, followed by suckling calves, both groups being very susceptible to drought conditions (Prins and Peel, personal observations at numerous places during some droughts). During the 1969–1970 drought in KNP, Smuts (Reference Smuts1982) once observed five buffalo calves dying while the herd was moving between two water points some 9 km apart. Further, observations of calves wandering through the veld alone were common, as they could not keep up with the herds moving over large areas in search of food and water. The proportions of calf and juvenile groups in the buffalo population were extremely low after the 2014/15–2015/16 drought, and these statistics feature in our detailed discussion of individual protected areas.
We examined three protected area (PA) scenarios under varying environmental and management regimes in the same semi-arid savanna (Lehmann et al., Reference Lehmann, Archibald, Hoffmann and Bond2011; Luvhuno et al., Reference Luvhuno, Biggs, Stevens and Esler2018) in the Lowveld of South Africa as described by Stevenson-Hamilton (Reference Stevenson-Hamilton1947). The three PAs represent an environmental gradient with decreasing long-term mean annual rainfall from south to north (PA 1: 631 mm, PA 2: 552 mm and PA 3: 430 mm). While focusing on what we consider the ‘long’ 2014/15 and 2015/16 droughts, it is important to describe the conditions prior to the onset of the drought. For all three PAs, the two-year pre-drought mean varied from wet (PA 1 and PA 2) to very wet (PA 3). The rainfall received as a percentage of the long-term mean annual rainfall in year one of the drought varied between 54 per cent for the wetter south to around 77 per cent for the ‘drier’ central and northern areas. The second year of the drought showed the same pattern for the PAs, with the ‘wetter’ southern PA 1 receiving 38 per cent, the central fenced PA 2 57 per cent and the drier northern PA 3 65 per cent of the mean annual rainfall, respectively. The post-drought rainfall was at the mean annual rainfall for PA 1 and marginally below the mean for PA 2 and PA 3. Rainfall correlates well with the grass standing crop (GSC) – the two-year pre-drought mean for the GSC ranged from 123 per cent for PA 1, 159 per cent for PA 2 and 152 per cent for PA 3. The entry point to the drought in terms of grass availability was thus very favourable (Figure 7.1a–f). Year 1 of the drought was characterized by marked declines in the GSC, ranging from 70, 67 to 72 per cent of the long-term mean for PAs 1–3, respectively. The second drought year precipitated an almost complete failure of the grassland crop with the mean GSC ranging from 7, 6 to 9 per cent for PAs 1–3, respectively. Recovery of the GSC post-drought again tracked a return to improved rainfall conditions (Figure 7.1a–f). Similar precipitous declines in standing crop (and subsequent yearling mortality) were observed in Tarangire National Park (Tanzania) in 1992 when minimal perennial grass cover was left, and in KNP in 1993 and again in 2004 with similar effects (Prins, personal observation). The periodicity of the droughts in the southern African climatic system is well illustrated in Malherbe et al. (Reference Malherbe, Smit, Wessels and Beukes2020), where it appears to be associated with the Southern Atlantic Oscillation (see also Gandiwa et al., Reference Gandiwa, Heitkönig, Eilers and Prins2016 and Poshiwa et al., Reference Poshiwa, Groeneveld and Heitkönig2013). Droughts in East Africa do not show clear periodicity (Prins and Loth, Reference Prins and Loth1988) because rainfall there is driven much more by monsoonal effects over the Indian Ocean.

Figure 7.1(a–f) Buffalo population data and rangeland conditions pre-, during and post-drought on three protected areas in the Lowveld of South Africa.
We evaluated how buffalo numbers changed after a drought event in the three PAs located in the Lowveld of South Africa and located along a south–north gradient. In our study, we considered buffalo numbers and the susceptible calf groups (up to 2 years old). Buffalo numbers were calculated as a percentage of the pre-drought number (Figure 7.1a, c and e) and for calves as a percentage of the population as a whole (Figure 7.1b, d and f).
In PA 1 (Figure 7.1a – wetter, and open to KNP), the population maintained itself in the first year of the drought, followed by a marked decline in the second year, but the population remained healthy. It was only during the winter of the second year of drought with the collapse of the grass layer that the numbers declined spectacularly. The latter was a result of a combination of movement out of the heavily stocked PA 1 into the adjacent KNP (less artificial water point provision and lower animal densities), and drought-related mortality through starvation and predation due to the animals’ weakened condition. The proportion of calves present in the population was maintained during the first year of the drought (favourable drought entry conditions), declined markedly in the second year and plummeted in the first post-drought year, a function of the die-off in the winter of year two and reflected in recovery year two post-drought as the rangelands recovered (Figure 7.1b). The recovery of the ‘rested’ rangeland in these wetter southern areas was illustrated by the return to pre-drought calf proportions in the second post-drought year. The overall reduced population size after the drought indicates that the older age classes also lost individuals, likely caused by increased predation and starvation.
In PA 2 (Figure 7.1c – intermediate rainfall and fenced), 98 buffalo (11 per cent of the population) were removed on recommendation between 2014 and 2015 with an additional 28 animals removed in 2016 (11 per cent of a much-reduced population). While these removals were commendable, they did not prevent marked declines in year one of the drought and steep declines in the following two years resulting in levels of around 20 per cent of pre-drought numbers up to three years post-drought. We consider that this situation was due to the heavy prevailing stocking rates at the start of the drought and rapid declines in the grass layer at the onset of the drought due to the fenced situation, resulting in drought-related mortality through predation on weakened animals and starvation. The proportion of calves present in the population was maintained in the first year of the drought (favourable drought entry conditions), declined steeply in the second year of drought and year one post-drought (to 0 per cent) with minimal recovery in year two post-drought and improvement in only year three post-drought but to levels still below pre-drought (Figure 7.1d). The population continued to recover slowly due to numbers below the exponential phase of the growth curve in this fenced PA. Without supplementation from outside sources, the rangeland would have rested in this wetter, albeit fenced central area. We would expect the population to recover, the rate dependent on the prevailing rainfall conditions and associated range condition that in turn affects how quickly the growth curve reaches exponential.
In PA 3 (Figure 7.1e, drier open to KNP) there was a decline in the number of buffalo in the first year of the drought followed by an increase in the second year of drought. This is anomalous as the grass layer was already severely limiting and probably the result of buffalo moving through the area at the time of the count from the surrounding drier waterless areas where conditions were more severe. The steep decline in the buffalo population was therefore only recorded in the first-year post-drought and continued in the second-year post-drought due to a continued decline in the grass layer combined with movement out of the PA (see e.g. Hilbers et al., Reference Hilbers, van Langevelde and Prins2015), predation due to the animals being in a weakened condition and starvation. This pattern was only reversed in the third-year post-drought. Although the buffalo population ‘increased’ in year two of the drought, the proportion of calves was very low, supporting the argument that the animals present in this PA were in all likelihood moving through the area in search of water and grazing. The proportion of calves present in the population was maintained in the first year of the drought (favourable drought entry conditions), declined steeply in the second year of drought and continued to decline markedly for the three years post-drought (3, 2.6 and 0 per cent; Figure 7.1f). We contend that the slower recovery of the population is a function of the slower recovery in the calf component and even greater susceptibility to drought in these drier, less-resilient areas.
Disease
Buffalo are remarkably resistant to indigenous diseases, but can be negatively affected by anthrax (Bacillus anthracis; e.g. Hugh-Jones and De Vos, Reference Hugh-Jones and De Vos2002; Clegg et al., Reference Clegg, Turnbull, Foggin and Lindeque2007). They are not known to succumb easily to different forms of trypanosomes transmitted by tsetse flies (see Garcia et al., Reference Garcia, Rodrigues and Rodrigues2018). These parasitic forms, some of which may cause sleeping sickness in humans, are destroyed by phagocytes (Young et al., Reference Young, Kanhai and Stagg1975), but other forms of trypanotolerance may occur (e.g. Murray et al., Reference Murray, Trail, Davis and Black1984). They are also resistant to other diseases like corridor disease caused by Theileria p. parva and East Coast fever caused by T. p. lawrenci. East Coast fever was introduced into South Africa in 1902 by infected cattle imported from East Africa to restock depleted cattle numbers after the rinderpest epidemic of 1896 (Lawrence, Reference Lawrence1979). The subsequent epidemic lead to an estimated 5.5 million cattle deaths (Potgieter et al., Reference Potgieter, Stoltsz, Blouin and Roos1988) but no buffalo epidemic was reported. Buffalo are also resistant to Anaplasma forms (Sisson, Reference Sisson2017). For an overview of other diseases, see Chapters 9 and 12. Some exotic diseases, however, were disastrous and buffalo had no immunity or resistance. Rinderpest was the most notorious, with a death toll exceeding 90 per cent (Prins, Reference Prins1996, p. 122 and references therein). The disease has been eradicated. Other exotic diseases, however, did not affect buffalo too badly. A case in point is bovine tuberculosis (bTB). We thus think that diseases exert a rather constant pressure in contrast to droughts that are punctuated events with frequently severe consequences for young buffalo in particular.
Implications for Modelling
Clearly, there are many factors that may cause major losses in population numbers. Furthermore, it is rare to find two consecutive decades within which such a loss does not occur. Consequently, a population in the wild will mostly, if not always, be in some transitional stage. Thus, transient dynamics will dominate rather than any form of density-dependent growth or equilibrium, and concepts of carrying capacity become irrelevant. In such situations, any analysis involving aggregation of age groups may lead to incorrect conclusions. Population trajectories are affected by how age structures are distributed. Two populations that have the same total number of head at some point in time might exhibit very different dynamic behaviour for several years thereafter due to the populations having different age structures. Distinguishing a population by age groups is therefore important both from a data and a modelling perspective, and the more precise, the better. In the following sections, we will explore these issues further.
Modelling
We constructed a model to gain insight into the relationship between aggregated population data, such as that available from a field survey, and the age structure of a population. We looked at the implications for forecasting population trends as well as for drawing conclusions about possible density effects. To have a clear, uncluttered focus on this, we considered a population for which the following assumptions hold for the solution period:
No migration
No losses due to disease, predation, culling, poaching or other exogenous factors
No constraining limits related to space and grazing resources within the time
A population large enough so that we can ignore stochastic changes in vital rates.
We also assumed that there would be enough males in a population to service the females. In this case, the population dynamics are determined by the females.
Leslie Model
Let x(t) denote the vector whose ith element, xi(t), is the female population in age group i at time t. We can project the population in each age group forward one year by the following equation:
 (7.1)
(7.1)The matrix A is known as a Leslie matrix (Caswell, Reference Caswell2001). With subscripts denoting the age groups, a Leslie matrix comprises the following:
The first row of A contains the specific fecundity rates
The ith row of A contains the survival rate si – 1 in column i – 1
All other elements of the matrix A are zero.
Thus:
 (7.2)
(7.2)Stationary Age-Structure
From mathematical theory (Caswell, Reference Caswell2001), we know that applying equation (7.1) repeatedly for t = 1, 2, 3, … will eventually lead to a stationary age structure. By this, we mean that the population in each age group as a proportion of the total population remains constant even as the total population might grow or decline. These proportions (i.e., the age structure) can be obtained by calculating the eigenvector of matrix A corresponding to its largest eigenvalue, λ. Furthermore, the value of λ yields information about the annual growth rate of the population. If λ = 1, the population will remain constant, whereas a value of λ greater than or less than one indicates that the population is growing or declining, respectively.
Ricker Model
A population subject to density-dependent growth is frequently modelled using the Ricker model:
 (7.3)
(7.3)where p is the population, r is the intrinsic annual growth rate and K is the maximum stocking rate, often referred to as the carrying capacity. For unbounded populations, K is infinitely large. In this case, the relationship between λ and r is given by:
 (7.4)
(7.4)This quantity will be referred to simply as the growth rate for the remainder of this chapter.
Data
Data from three different studies were used in the analyses that follow: namely, Serengeti National Park (Sinclair, Reference Sinclair1977), Hluhluwe–iMfolozi Park (Jolles, Reference Jolles2007) and Virunga National Park (Mertens, Reference Mertens1985). These data are shown in Figure 7.2 (precise values are given in the Appendix, Table A7.1). Small adjustments have been made to the age groups in Jolles (Reference Jolles2007) to facilitate comparison.

Figure 7.2 Specific fecundity (a) and survival rates (b) for buffalo as given in three different studies: Serengeti (Sinclair, Reference Sinclair1977), Hluhluwe–iMfolozi (Jolles, Reference Jolles2007) and Virunga (Mertens, Reference Mertens1985). The age group refers to the age of the animals in a cohort.
Analysis
There are three parts to this section. First, we explore the population dynamics using the Serengeti data and make some observations. In the second and third parts, we examine some of the conclusions drawn in the studies of Jolles (Reference Jolles2007) and Mertens (Reference Mertens1985), respectively.
Serengeti
The data in Sinclair (Reference Sinclair1977) were a result of several years of work in the Serengeti during the 1960s. It is the most cited work on the fecundity and survival rates of the African buffalo.
Substituting the Serengeti fecundity and survival rates into the matrix (7.2), we find the largest eigenvalue λ and the corresponding eigenvector. The eigenvector corresponds to the stationary age distribution, which we will use as starting values for simulating the population dynamics. The eigenvalue λ = 1.054 implies a growth rate of 5.4 per cent for this stationary age distribution. However, as discussed, populations are subject to frequent disruptions. After such a disruption, how long will it take before the population returns to this stationary age distribution? We consider two plausible scenarios to explore this question.
Serengeti Scenario 1 – A Short Drought
Starting with a stationary age distribution, a population is subject to a short, acute drought of 6 months. This results in the deaths of a major proportion of the recently weaned calves. Specifically, in our model, 75 per cent of the second and third age classes die immediately after the start of year 2.
To simplify the visual representation of the results we aggregate the 19 age groups as follows: calves (group 1), juveniles (groups 2–4), subadults (group 5) and adults (groups 6–19). A division of adults into ‘young’ cows (groups 6–10) and ‘old’ cows is used for some results. This division corresponds to specific fecundity rates as given by Sinclair and shown in Figure 7.2.
It can be observed in Figure 7.3a that more than a decade after the drought event, the population has not yet returned to its previous growth rate. In Figure 7.3b, we note that the age structure of the population is also unsettled. A consequence of this is that the number of calves produced per cow fluctuates as shown in Figure 7.4a. Why should this be, given that the specific fecundity rate for each year-age group is constant?
Dividing the ‘adult’ group into ‘young’ (groups 6–10) and ‘old’ (groups 11–19), we observe in Figure 7.4b that the proportion of cows in each group fluctuates over the solution period. As the ‘young’ and ‘old’ cows have different specific fecundity rates of 0.41 and 0.33, respectively, changes in the proportions of each group cause a change in the average number of calves produced per adult cow.

(a) Growth rate

(b) age structure.
Figure 7.3 The effect of a short, acute drought on the dynamics of a population initially in a stable age distribution.

(a) Fluctuations in the rate of calf production by a herd of buffalo cows.

(b) Changes in the proportion of high fecundity ‘young’ cows to ‘old’ cows.
Serengeti Scenario 2 – A Long Drought
Starting with a stationary age distribution, a population is subjected to a severe drought lasting 2 years. This results in high mortality for recently weaned calves. Specifically, we impose in the model a die-off of 75 per cent of females in groups 2 and 3 in year 2. This is followed in year 3 by a complete die-off of all calves and juveniles, that is all animals in groups 1–4, and 50 per cent of cows staying barren.
In some respects, Figures 7.5 and 7.6 show exaggerated versions of the effects already noted in scenario 1, but there is more to learn from these results.

Figure 7.5 Fluctuations in (a) population and growth rate and (b) age structure.

(a) Number of calves produced per adult cow each year.

(b) Composition of the adult female population.
Suppose a field study commences in year 4 and is concluded in year 10. Further, suppose that no other data were available other than that obtained over the six-year study period. Observing the population trajectory (Figure 7.5a) over this period, it is easy to conclude (wrongly) that population growth is density-dependent. In fact, a Ricker model with K = 95 and r = 0.61 gives an almost perfect fit to these data. The declining number of calves produced per cow over this period (Figure 7.6a) would tend to confirm a conclusion that the population is subject to density-dependent growth. And yet there is no density effect built into the model that generated these results as can be seen from the population trajectory beyond year 11. The transient dynamics of a disturbed population can easily mislead.
Discussion of the Serengeti Cases
Even a short disturbance (6-month drought) affects the population dynamics for more than a decade.
A study of 6 years may produce trajectories that lead to misconceptions about the longer-term prospects of a population.
With no density constraints on a population, transient changes in the age structure may lead to a population trajectory mimicking density-dependent growth over a period lasting a few years.
Specific fecundity rates cannot be accurately determined using aggregated adult age groups for populations in transition.
Hluhluwe–iMfolozi
Demographic data from 826 buffalo in 12 herds in the Hluhluwe–iMfolozi Park, captured in 2001–2002, were used by Jolles (Reference Jolles2007) to parameterize an age-structured population model. The stationary age distribution predicted by the model is, according to Jolles, ‘very similar to the age distribution observed in the captured population sample’. Jolles goes on to use some of her results to provide evidence of density-dependent population growth. We analyse whether these conclusions stand up to further scrutiny.
The first problem we come across is in the age-structured population data given in Jolles (Reference Jolles2007) and shown in Table 7.1. Let us assume that the given number of subadults (= 42) is correct. The survival rate for the juvenile group is given as 0.85. Thus, to get 42 subadults we would need to have 42/0.85 = 49.4 juveniles in the age range from 3.5 to 4.5 years. Similarly, the population in the age range from 5.5 to 6.5 years would be 42 × 0.85 = 35.7 and the next year class would be 35.7 × 0.97 = 34.6. We can continue in this way and determine the numbers in all age groups. Then aggregating these into broader groups, we get the ‘Revised’ values given in Table 7.1. As can be seen, these numbers differ significantly from the values reported by Jolles.
Table 7.1 Age structure for African buffalo in Hluhluwe-iMfolozi Park, South Africa as reported by Jolles (Reference Jolles2007). The revised estimates for the number of buffalo in the different age classes (N) were obtained by assuming the subadult number of 42 (the number published) is correct and then using the survival data provided in the same article for each year-age group to generate the numbers in the ‘Revised’ column as described in the previous paragraph.
| Age (years) | Jolles (N) | Revised (N) |
|---|---|---|
| Calves (<1) | 136 | 109 |
| Juveniles (1 = 4.5) | 366 | 256 |
| Subadults (>4.5–5.5) | 42 | 42 |
| Mature (>5.5) | 247 | 408 |
Is it possible to understand the discrepancy in the two sets of values in Table 7.1 using the simple model presented earlier by equations 7.1 and 7.2? The first step to take is to substitute the fecundity and survival rates determined by Jolles, given in Figure 7.2, into the Leslie matrix (equation 7.2).
The largest eigenvalue of the Leslie matrix in this case indicates a growth rate of 3.4 per cent per annum. This is less than the average 6.8 per cent recorded over the period from 1957 to 2004. The associated stationary age structure is given in Table 7.2 where it is compared with the field data. This difference suggests that a stationary age distribution had not been attained at the time the field data were recorded. This is not surprising given droughts and removals over this period.
Table 7.2 The stationary age structure for Hluhluwe–iMfolozi Park, South Africa as calculated on the basis of the Leslie model compared with field data reported by Jolles (Reference Jolles2007). Values shown (rounded to the nearest integer) are percentages of the total population.
| Age (years) | Leslie model (%) | Data (Jolles) (%) |
|---|---|---|
| Calves (<1) | 17 | 17 |
| Juveniles (1 = 4.5) | 30 | 46 |
| Subadults (>4.5–5.5) | 7 | 5 |
| Mature (>5.5) | 47 | 31 |
Let us now impose on this system the same drought described in Serengeti – scenario 2 to investigate the population dynamics. For this, we used equation 7.1 with the same Leslie matrix comprising the fecundity and survival rates. We assume an initial population of 100 head and determine the age distribution from the eigenvector of the Leslie matrix. Some results are shown in Figure 7.7.

(a) Fluctuations in the population and its growth rate.

(b) The relative proportion of ‘adult’ cows (6–16 years old) to ‘senescent’ cows (17+ years).
We observe in Figure 7.7a that during years 4–11 the population displays a trajectory that might easily be interpreted as density-dependent growth. Applying a Ricker model with K = 117 and r = 0.45 gives an almost perfect fit to the population trajectory over this 7-year period, and yet the population trajectory has been generated by a model that has no density-dependence as is apparent in later years. How can we explain this?
The changes in growth rate observed in Figure 7.7a are purely a result of changes in the age structure. It can be seen in Figure 7.7b that the proportion of ‘adult’ cows (6–16 years old) is depressed between the years 5 and 17. Recall from Figure 7.2 that ‘adult’ cows in Hluhluwe have a specific fecundity rate of 0.37 compared with only 0.3 for ‘senescent’ cows. Therefore, the number of calves produced by a population, and thus the growth rate of the whole population, will be affected by the ratio of ‘adult’ cows to ‘senescent’ cows.
Finally, it should be noted in Figure 7.7b that the population has not settled into a stationary age structure nearly two decades after the drought.
Discussion of the Hluhluwe–iMfolozi Case
If we have accurate fecundity and survival rates, we can easily test whether a population has attained a stationary age structure. The number in any age group multiplied by the survival rate should give the number in the next age group. This will be true for all age groups if we have a stationary age structure.
It takes nearly two decades after a severe year drought before the population settles into a stationary age structure.
Due to the frequency of droughts a population is likely to always be in a transient state.
For populations in a transient state, determining vital rates from aggregated data can be misleading. Furthermore, even a field study with a 7-year duration might yield data that lead to an incorrect conclusion of density-dependent growth.
Virunga
In an analysis of buffalo in Virunga National Park in the Democratic Republic of the Congo (then Zaire), Mertens concluded in 1985 that the structure of the population had remained approximately stable over the past 25 years. Let us investigate this further. We apply to the matrix A, given in equation 7.1, the lifetable data constructed by Mertens (Figure 7.2), which differs to some extent from that of Sinclair (Reference Sinclair1977).
As described previously, the stationary age structure can be obtained by calculating the eigenvector of matrix A corresponding to its largest eigenvalue, λ. Furthermore, the value of λ can be used in equation 7.4 to calculate the growth rate of the population.
For the data given in Figure 7.2, we obtain the value of the largest eigenvalue λ = 0.974. This implies that the population will experience a continuing decline once it has settled into a stationary age structure. Although Mertens provides vital rates for 17 age groups, his population counts and age structure are given in only three groups: ‘young’ (0–1 years), ‘immatures’ (1–4 years) and ‘adults’ (4+ years). Clustering age groups from the eigenvector to enable a direct comparison with Mertens’ data, we get Table 7.3.
Table 7.3 Comparison of the stationary age structure of African buffalo in Virunga National Park, Democratic Republic of Congo obtained by our model with the field data of Mertens (Reference Mertens1985).
| Age groups (year) | Model (%) | Mertens (%) |
|---|---|---|
| <1 (Young) | 14.5 | 8.7 |
| =1–4 (Immatures) | 22.2 | 15.9 |
| >4–17 (Adults) | 63.3 | 75.4 |
The two age structures in Table 7.3 differ. To explore this, we first note that the age structure reported by Mertens shows that the proportion of each group differs by less than 3 per cent from two previous findings at Virunga National Park in 1960 and 1978–1979. Therefore, we set initial population values close to those of Mertens and used the Virunga vital rates given in Figure 7.2. We then applied equation 7.1 repeatedly to project the population forward in time. The simulations were performed for 30 years, but it is clear from the results that the age groups stabilized after about 25 years as shown in Figure 7.8.

Figure 7.8 Changing age structure over 30 years. Compared with the initial structure at t = 1, both juveniles and subadults ended up representing higher percentages of the population, while adults are lower.
In reporting his data, Mertens allowed for the possibility that his fecundity data were a bit too low and that Sinclair’s values might be more accurate. We thus replaced Virunga fecundity data in Figure 7.2 with those for Serengeti to determine whether this reduces the difference between the model output and the field data. In fact, this replacement increased the discrepancy further, as shown in Table 7.4 (Model 1 as compared to the output based on Merten’s data). Using Serengeti data for both fecundity and survival also did not improve matters (Model 2 in Table 7.4).
Table 7.4 Comparison of the stationary age structure determined from population counts in Virunga National Park, the Democratic Republic of Congo by Mertens (Reference Mertens1985) and that obtained using a Leslie matrix model. Model 1 used Mertens’ survival data but with Sinclair’s (Reference Sinclair1977) fecundity data. Model 2 used Sinclair’s data on fecundity as well as on survival.
| Age group (year) | Mertens (%) | Model 1 (%) | Model 2 (%) |
|---|---|---|---|
| <1 (Young) | 8.7 | 19 | 18 |
| =1–4 (Immatures) | 15.9 | 26.3 | 29 |
| >4–17 (Adults) | 75.4 | 54.7 | 53 |
Discussion of the Virunga Case
Starting with the age structure recorded, it takes nearly two decades before the population settles. It then settles into an age structure that differs from that recorded by Mertens.
Given this inconsistency and the frequent disturbances to buffalo populations, it seems unlikely that the age structure of the Virunga population was stable over 25 years as claimed. We conclude this, even though the broad population structure recorded by Mertens was similar to that recorded 25 years earlier.
Conclusion
We have noted that factors such as disease, predation, poaching and droughts all have severe effects on buffalo populations, but that droughts (because they occur punctuated in time) have the most intriguing consequences. These events happen frequently. Three major droughts, for example, have occurred in less than four decades in the Greater Kruger National Park (Malherbe et al., Reference Malherbe, Smit, Wessels and Beukes2020; Smit et al., Reference Smit, Peel and Ferreira2020) and severe droughts were also reported by Stevenson-Hamilton (Reference Stevenson-Hamilton1947) decades previously. Such droughts may increase in frequency with climate change in some parts of the range of the African buffalo, but perhaps not in others. With such disruptions, populations are always in a state of transition (and in a form of non-equilibrium dynamics: see for example Ellis and Swift, Reference Ellis and Swift1988; Desta and Coppock, Reference Desta and Coppock2002; Vetter, Reference Vetter2005). Their age structures are thus always changing. Even without further disruptions, it might take more than a couple of decades before a population settles into a stationary age structure.
In this chapter, we have shown the importance of detailed age structure modelling in determining population trajectories. Time series analysis of aggregated populations may lead to significantly incorrect conclusions. This includes, for example, misleading ‘evidence’ for density-dependence for a case where, in fact, there was no such effect at all.
A concern highlighted by this analysis is that in the field it is often difficult to distinguish the exact ages of individuals. This might also have implications for calculating vital rates. Suppose fecundity starts declining from age 15 and we cannot distinguish between 14- and 16-year-olds. Then simply counting calves and adults will not give a specific fecundity rate that will hold for a different mix of 14- and 16-year-olds.
We also have shown that vital rates determine an age structure. If the survival rate, say 0.9, in a particular age group with 100 individuals is known, then the next older age group should comprise 90 individuals a year later. If the population is in equilibrium and hence the age structure is stationary, the older group will contain 90 individuals now. Thus, if numbers in the older group differ from 90 then we know that the population is still in a state of transition.
In conclusion, we contend that understanding the population dynamics of buffalo requires detailed knowledge of the age structure. Furthermore, any data on vital rates should record the extent to which age groups have been aggregated. Any studies on population dynamics using these data should explore the full range of disaggregation possible that is consistent with the aggregated data. Only then can firm statements be made about the population dynamics. Indeed, while it is easy to do some arm-waving about ‘climate change’ and stating that ‘there will be more droughts in Africa’, it is much more difficult to replace comfortable thinking about ‘carrying capacity’ by the realization that animal populations in many parts of Africa are in a state of non-equilibrium dynamics, and that a drought some years ago is still playing havoc with the population dynamics. Nonetheless, choosing the wrong (mathematical) model for predicting future numbers, setting offtake numbers (e.g. for hunting quota) or even temporary destocking strategies may have severe repercussions for the sustainability of a harvesting operation, for example, or for calculating gene flow in a population.
Introduction
Every first-year text book in ecology informs students that every species has its own niche. This is sometimes taken further with the assertion that every species also has its own function (whatever that means). In this chapter, we ask what the ‘niche’ is of the African buffalo Syncerus caffer. However, ‘the African buffalo’ is not a homogeneous species because there is much morphological variation within the species. This variation is to some extent geographically restrained, and hence scientists have distinguished ‘subspecies’. Due to the recent proliferation of ‘recognized’ subspecies and species, the reader should be aware that the recognizing and naming of taxa, which used to be safely in the hands of systematicists and taxonomists, has become politicized (see O’Brien and Mayr, Reference O’Brien and Mayr1991; Gippoliti and Amori, Reference Gippoliti and Amori2007). Under U.S. legislation, there may be a need to recognize and name taxa because any named taxon that may deserve protection can get it, but unnamed taxa cannot. Indeed, the U.S. Endangered Species Act considers any subspecies of fish or wildlife or any distinct population segment as an entity available for protection (Schwartz and Boness, Reference Schwartz and Boness2017). To our knowledge, this does not apply to legislation in African buffalo range states, and so there is no conservation need for distinguishing many or few subspecies of African buffalo.
In the scientific literature, there are currently five recognized forms or subspecies of African buffalo, namely, matthewsii, aequinoctialis, brachyceros, caffer and nanus (Prins and Sinclair, Reference Prins, Sinclair, Kingdon and Hoffmann2013). Confusingly, the Safari Club International trophies system (SCI) also recognizes five subspecies, but they are not the same (see below). Ecologically speaking, we know next to nothing about matthewsii; this subspecies occurs in mountainous areas to the north of Lake Kivu as far as the Virunga Mountains. Whether it is justified to separate it from caffer is unclear (Prins and Sinclair, Reference Prins, Sinclair, Kingdon and Hoffmann2013); there is no scientific literature available to state whether this form has special ecological requirements, except if we consider the buffalo of Virunga National Park (a.k.a. Albert NP) in the Democratic Republic of the Congo (DRC) and of Parc National des Volcans in Rwanda as matthewsii too. In that case, the ecological literature does not provide clues to see it as functionally different from caffer (see e.g. Mertens, Reference Mertens1985; Mugangu et al., Reference Mugangu, Hunter and Gilbert1995; Plumptre, Reference Plumptre1995; Treves et al., Reference Treves, Plumptre, Hunter and Ziwa2009).
Another blank spot in our knowledge on buffalo ecology concerns aequinoctialis. This subspecies occurs north of the Congo rainforest between the Chari River in the west and the Nile in the east. Phenotypically it looks very much like caffer, but on the basis of mitochondrial DNA clustering it resembles nanus/brachyceros (Smitz et al., Reference Smitz, Berthouly and Cornélis2013). One study on the diet of this subspecies has been published (Hashim, Reference Hendey1987) and does not give reason to think it is different from the diet of caffer.
Further to the west, from Senegal to the Chari River in southwest Chad, to the north of the Guinea rainforest, roams the third form, namely brachyceros (the West African bush cow). Again, we do not know much about this subspecies ecologically speaking save for the information provided in the PhD thesis of Cornélis (Reference Comeault and Matute2011). This subspecies may grade into the aequinoctialis form east of Lake Chad, noting that the buffalo is nearly extinct within the Lake Chad Basin with the exception of some incursions from elsewhere (Chardonnet and Lamarque, Reference Chardonnet, Lamarque and De Zborowski1996); genetically speaking, it intergrades with nanus (the forest buffalo) of both the Guinea rainforest and the Congo rainforest. Of this latter subspecies we have reasonable knowledge. The SCI system does not recognize matthewsii and splits the West African bush cow into two subspecies, namely, S. c. brachyceros and S. c. planiceros.
And finally there is caffer (the Cape buffalo), of which much is known. Its karyotype suggests that it is the most recently derived form. It is the only subspecies with a fusion between chromosomes 5 and 20 (2n = 52), and it lacks the polymorphism for a 1;13 fusion, as observed in Syncerus caffer nanus (2n = 54–56; Wurster and Benirschke, Reference Wurster and Benirschke1968; Anon., 2004; Pagacova et al., Reference Pagacova, Cernohorska and Kubickova2011). Hybrids between nanus and aequinoctialis have been produced in zoos (Gray, Reference Gray1972; Anon., 2004), as well as between nanus and caffer (Cribiu and Popescu, Reference Cribiu and Popescu1980).
There are gradual changeovers but also sharp boundaries between the different forms. By and large, three types can be recognized based on body mass, namely, the small S. c. nanus (adults 265–320 kg), the intermediate S. c. brachyceros plus S. c. aequinoctialis (adults 300–600 kg) and the massive S. c. caffer (adult cows up to 500 kg, adult bulls from 650 kg to 900 kg; Cornélis et al., Reference Cornélis2014).
The unclear allocation of individuals to these five forms (matthewsii, aequinoctialis, brachyceros, caffer and nanus) is well illustrated by comparing Smithers (Reference Smithers1983 – who only recognizes ‘caffer’ and ‘nanus’), the Rowland Ward trophies system (Smith, Reference Smith1986 – with a northern savanna buffalo, a southern one and the forest buffalo; basically the same as Grubb, Reference Grubb1972), Ansell’s (Reference Ansell, Meester and Setzer1972) system (which does not recognize ‘matthewsii’) and finally the exuberance celebrated by Groves and Grubb (Reference Groves and Grubb2011), who elevated every form to its own species, thus revelling in the same super species-splitting that was witnessed 100 years ago (Prins, Reference Prins1996). Would these different forms then have different niches?
Now, what is a ‘niche’? Confusingly, there are three niche concepts in ecology, to wit, the Grinellian niche concept, the Eltonian one and the Hutchinsonian one (see Prins and Gordon, Reference Prins, Gordon, Prins and Gordon2014, p. 7ff.). The Grinellian niche concept reflects the habitat in which an organism lives, the Eltonian one stresses the functional attributes of the species and its position in a food web, while the Hutchinsonian niche is defined by the resources and environmental requirements of an individual of a species to live and reproduce. In this chapter, we lean towards the Hutchinsonian niche concept, but we use the ‘niche’ concept loosely.
It thus would be reasonable to believe that if there are different subspecies of the African buffalo because they are morphologically distinct, then they have different ‘niches’. An alternative explanation could be that environmental history ‘accidentally’ led to vicariance, thus resulting in phenotypically different forms that were isolated long enough to be genetically sufficiently distinct to justify ‘subspecies status’, but they (still) have the same ‘niche’. Yet the null hypothesis should not be forgotten, namely, that the (normally) morphological characters that systematicists use to distinguish species or subspecies have no functional meaning (Gould and Lewontin, Reference Gould and Lewontin1979).
An Ultrashort Recapitulation of the Evolutionary History of These Forms
The most direct ancestor of S. caffer was S. acoelotus; Geraads et al. (Reference Geraads, Blondel and Mackaye2009) state that it was as large as the modern S. caffer. S. acoelotus was a Plio-Pleistocene species in Africa that disappears from the fossil record about 600,000 years ago (see Kullmer et al., Reference Kumar, Devadasan and Surya1999: Late Pliocene; Bunn et al., Reference Bunn, Mabulla and Domínguez-Rodrigo2010; cf. Bibi et al., Reference Bibi, Rowan and Reed2017: Early Pleistocene; O’Regan et al., Reference O’Regan, Bishop and Lamb2005: Middle Pleistocene; Chaix et al., Reference Chakraborty, Ramakrishnan and Panor2000: Middle Pleistocene). This may coincide with the expansion of the present-day species between 1,000,000 and 500,000 years ago as deducted by genetics (Chen et al., Reference Chen, Qiu and Jiang2019; de Jager et al., Reference Jager, Glanzmann and Möller2021). S. acoelotus may have led to a second Syncerus species too, namely S. antiquus. This latter species went extinct only about 2000 years ago, and may have been a more drylands-adapted species (see Chapter 2). The other species, namely, S. caffer, is extant. In the Lake Turkana basin, the last record of S. acoelotus was about 1.6 Myr ago, and the first S. caffer about 1.2 Myr ago (Bobe and Behrensmeyer, Reference Bobe and Behrensmeyer2004). The genetics and palaeontology of S. caffer shows that it apparently could expand its range to southern Africa when S. antiquus went extinct. S. antiquus also was able to cross the Sahara Desert, most likely in periods when the desert was much greener, and may even have entered the Middle East (for details see Chapter 2). The first occurrence of S. c. caffer is from Melkbos, South Africa, from the Upper Pleistocene (Hendey, Reference Hitchcock, Prins, Grootenhuis and Dolan1969; see Groves, Reference Groves1992). However, there is the possibility that Syncerus caffer and S. acoelotus were both derived from an earlier genus, namely Ugandax (see Chapter 2).
Genetics shows that ‘subspeciation’ may have arisen as long as about one million years ago (de Jager et al., Reference Jager, Glanzmann and Möller2021) or as recently as 200 kyr (Smitz et al., Reference Smitz, Berthouly and Cornélis2013; de Jager et al., Reference Jager, Glanzmann and Möller2021), but does not provide evidence (yet) whether S. c. nanus is more ancestral than the other Syncerus forms (pace Van Hooft et al., Reference Hsieh, Veeramah and Lachance2002; Smitz et al., Reference Smitz, Berthouly and Cornélis2013, even though they suggest that nanus is the derived form). The observations that the older S. acoelotus had the same size as the present S. caffer, and that the older forms that looked like S. caffer are known from the Lake Turkana Basin (Bobe and Behrensmeyer, Reference Bobe and Behrensmeyer2004) nearly overlapping with the present-day range of S. c. aequinoctialis, thus allow for the scenario that the present-day buffalo with the simplest horns (S. c. aequinoctialis) is genetically closest to the ancestral form. On the basis of genetic analyses, this was already suggested by Smitz et al. (Reference Smitz, Berthouly and Cornélis2013), and prior to that by Groves (Reference Groves1992 – slightly confusingly, he put forward that this was spp. brachyceros, but he did not distinguish spp. aequinoctialis from spp. brachyceros). Groves (Reference Groves1992) puts this transition from S. acoelotus to S. c. aequinoctialis at 130 kyr. The observation that (pure?) nanus buffalo have one pair of chromosomes less than at least aequinoctialis and caffer (we could find no evidence for brachyceros) due to a recent fusion (Anon., 2004) also points towards the derived status of the forest buffalo.
In such a scenario, S. c. nanus could be the result of dwarfing (as has been observed on islands with the Asian buffalo and humans in the rainforest, e.g. pygmies). Additionally, it cannot be ruled out, we think, that S. c. brachyceros represents a hybrid of S. c. nanus and S. c. aequinoctialis (a pattern that is very well known from Asian bovines). Indeed, the genetic distances between these three subspecies are very small (Van Hooft et al., Reference Hsieh, Veeramah and Lachance2002; Smitz et al., Reference Smitz, Berthouly and Cornélis2013). However, there is no evidence for two separated lineages of dwarf buffalo and large buffalo that were separated for a very long time as has been put forward (for a discussion see Chapter 2).
On the basis of the above, different storylines can be constructed, namely: (1) there was a large buffalo species (‘acoelotus’) that evolved into ‘caffer’ and ‘antiquus’. Antiquus was a species adapted to dry conditions and could outcompete caffer under these conditions. When antiquus went extinct, caffer took over parts of its range but is nowadays limited by the isohyet of 350 mm. It could not cross the Sahara, and along the Nile it encountered the aurochs (Bos primigenius), which prevented caffer’s establishment to the north of Khartoum. Storyline (2) is different, with the original large buffalo acoelotus able to infiltrate the rainforest (perhaps at times when the forest was reduced to gallery forest only). There, secondary dwarfing took place. At times when the rainforest nearly disappeared (e.g. during the Last Glacial Maximum), the range of the buffalo was probably restricted to one or two refuges in present-day CAR, northern Congo and Uganda (Smitz et al., Reference Smitz, Berthouly and Cornélis2013). In such a small area, possibly no more than 1500 km across, hybridization could easily have taken place with aequinoctialis, thus leading to the form brachyceros. The further west one travels, the lesser is the expected imprint of aequinoctialis, thus leading to a possible cline. Alternatively, storyline (3) narrates that after S. caffer evolved into a form that looked like S. c. aequinoctialis, it developed into the large Cape buffalo (S. c. caffer), but also expanded into the Congo Basin where dwarfing took place, producing S. c. nanus. Storyline (4) is different. It narrates that there was a large buffalo species (‘acoelotus’) that evolved into ‘antiquus’. However, there was an even older species (so, not acoelotus), say, Ugandax (see Chapter 2) that evolved into Syncerus acoelotus and also into S. caffer, which was much smaller and looked like S. c. nanus. Note that this putative predecessor has not been unearthed. This S. c. nanus than lived in the ancestral rainforest, from which it radiated into the north to form S. c. brachyceros and S. c. aequinoctialis, and into the east to form S. c. caffer (which then expanded towards the Cape).
Storylines (1), (2) and (3) make the point that the forest buffalo are the product of dwarfing; storyline (4) emphasizes that the northern and eastern savanna buffalo became adapted to C4 grasses in their diet and had to adapt to a large new predator, namely the lion (Panthera leo), because its descendants moved into the savanna after they had evolved in the rainforest (see below on the different ‘niches’). On purpose we do not use the word ‘hypothesis’ but ‘storyline’ because too much is unknown. However, the ramifications are startling, because these storylines result in very different insights into the buffalo’s ‘adaptations’. Thornhill’s is nonetheless a stark reminder of the difficulties one faces in deriving notions about adaptation from present-day niche occupation:
A Darwinian adaptation is an organism’s feature that was functionally designed by the process of evolution by selection acting in nature in the past. Functional design rules out explanations of drift, incidental effect, phylogenetic legacy and mutation. Elucidation of the functional design of an adaptation entails an implicit reconstruction of the selection that made the adaptation. Darwinian adaptations and other individual traits may be currently adaptive, maladaptive or neutral.
The Environmental Envelopes of African Buffalo
For the present discussion, we discern three environmental envelopes (an important part of the Hutchinsonian niche) for the three major forms of the buffalo, namely, the forest buffalo (nanus), the northern savanna buffalo (brachyceros and aequinoctialis) and the Cape buffalo (caffer) (Table 8.1). Judging from distribution maps of the different forms of buffalo, we generally know at which altitudes they occur or once occurred. Altitude is the main determinant of ambient temperature. For the forest buffalo, we assume that they generally occur below 500 m altitude. However, there may be forest buffalo on the slopes of Mt Cameroon (an isolated volcano of 4000 m altitude) and they do or did occur on Mt Nimba (a 1750-m high mountain on the border between Ivory Coast and the Republic of Guinea; the area is now overrun by refugees) and perhaps in the Masisi Region (eastern DRC; dominated by civil war and resource extraction; P. Chardonnet, personal communication). The northern savanna buffalo also is a lowland form, but it occurs up to 1000 m above sea level in, for instance, the Bouba Njida area (northern Cameroon; P. Chardonnet, personal communication). Yet, this is below the C3-grass zone (see Van der Zon, Reference Van der Zon1992).
Table 8.1 Approximate climate envelopes of the three main forms of African buffalo; we have taken S. c. aequinoctialis and S. c. brachyceros together as ‘northern savanna buffalo’. The lethal zones (based on what we know of cattle) may be reached due to a combination of temperature and air humidity for the forest buffalo; for the northern savanna buffalo the lethal temperatures can be reached during heatwaves with dry air. Cape buffalo have been known to freeze to death, but we do not know of the heat index being excessed.
| Elevation range (m a.s.l.) | Minimum temperature and cold waves bracketed (°C) | Maximum temperature and heatwaves bracketed (°C) | Radiation heat flux | Rainfall regime (mm yr-1) | Air humidity | Wind/moving air | |
|---|---|---|---|---|---|---|---|
| Forest buffalo | 0–700 | 18 | 32 (35) | Very low | 1000–9000 | 70–95 | Absent |
| Northern savanna buffalo | 100–1000 | (6) 30 | 42 (52) | Very high | 400–1000 | 15–70 | Present |
| Cape buffalo | 0–5000 | (-5) 10 | 38 (47) | Very high | 400–1000 | 50–80 | Present |
On the basis of the environmental envelope parameters of Table 8.1, we posit that forest buffalo run the real risk of getting overheated when the temperature is high and air humidity is very high (thus preventing evaporative heat loss; see Figure 8.1). Buffalo do not have much sweating or panting abilities. In the much more unvarying warm circumstances of a tropical lowland rainforest, wallowing offers much fewer cooling opportunities (because of the higher temperature of standing water but also because of the windless circumstances) than in a savanna where water bodies can cool at night, and more breeze occurs. The northern savanna buffalo can take shelter against high heat loading through direct sunshine by finding places with a breeze and/or shade. Yet these buffalo, we posit, also run a high risk of dying from heat stress during heat waves (Figure 8.1).

Figure 8.1 Heat risk assessment for people. The figures inside the cells are the temperatures (oC) as experienced. Thousands of cattle have died from heat stroke in India and Australia. The combined effect of relative air humidity and temperature is slightly different for cattle and people, but as we do not know the exact relationship in buffalo, we use this for illustrative purposes.
Finally, the Cape buffalo runs the risk of being exposed to cold and frost. This is especially important in its southern range, but also high in the mountains of the volcanoes of East Africa.
From this, it follows that it is likely that there is selection pressure for buffalo (and humans, elephants and hippos) to be as small as possible in the tropical lowland rainforest, but in the savanna it would be advantageous to be large (see Table 8.6). The reasons are that in a tropical lowland rainforest where evaporative heat loss is often impossible, heat loss must be achieved through radiation. A large body surface to mass ratio (typical for small animals) is then advantageous; heat can barely dissipate at night because there can be no radiation towards the sky (and thus outer space) due to dense foliage and clouds. In a savanna, however, evaporative loss is possible and body heat can dissipate at night, while a large body mass prevents rapid overheating. Indeed, in areas where there is no hunting, buffalo can be seen resting and grazing during the middle of the day in the full sun even when it is 32°C. Central African rainforest pygmies also separated only recently (i.e. about 70 kyr: Perry and Verdu, Reference Perry and Verdu2017; to 190 kyr: Hsieh et al., Reference Hubbard, Stooksbury, Hahn and Mader2016) from Bantu. Yet, the adaptive significance of small stature in humans in rainforests is far from clear (see e.g. Hsieh et al., Reference Hubbard, Stooksbury, Hahn and Mader2016; Bergey et al., Reference Bergey, Lopez and Harrison2018; Patin and Quintana-Murci, Reference Patin and Quintana-Murci2018). It is also unclear as to whether the African forest elephant (Loxodonta africana cyclotis a.k.a. L. cyclotis), genetically perhaps distinct from the African savanna elephant (L. a. africana, a.k.a. L. africana; but see Debruyne, Reference Debruyne2005), is a similar case of dwarfing. Grubb et al. (Reference Grubb, Groves, Dudley and Shoshani2000) consider the forest form to be more primitive than the savanna form, which, if correct, would mean that the dwarfing was not recent. There is, by the way, insufficient evidence for the existence of the pygmy elephant (‘L. pumilio’; Debruyne et al., Reference Debruyne, Van Holt, Barriel and Tassy2003), so it is unclear whether parallels may be drawn between the case of the African elephant and the emergence of the forest buffalo. The pygmy hippo (Choeropsis liberiensis) also is not a dwarfed form of the large Hippopotamus amphibius, but is a descendant of a much older, original form that is hardly related to the modern mega-sized hippo (Boisserie, Reference Boisserie2005). True dwarfed hippos did occur on Mediterranean islands (Petronio, Reference Petronio2014). The idea could be entertained that dwarfing of buffalo in the rainforest took place because of poorer quality food. Yet food quality in the rainforest of Cameroon, judging by its species composition (Bekhuis et al., Reference Bekhuis, de Jong and Prins2008) was about equal to or better than that of savanna buffalo (Prins, Reference Prins1996), and generally it is assumed that larger ruminants (because they have a slower throughput rate) can cope with poorer-quality food. In other words, it is not plausible that a dwarfing of African buffalo after broadening their niche into the tropical rainforest was a reaction to food quality.
It is unlikely that very high amounts of rainfall pose a problem to forest buffalo. They can swim well, and their large splayed hooves offer sufficient movement possibilities in very wet and muddy terrains. Yet we have observed them taking shelters in grottoes in Cameroonian rain forests (H. Prins, personal observation).
The Food of the African Buffalo Subspecies
For the diet of the different forms of the African buffalo, one must pay attention to differential occurrence across its range of C3 grasses versus C4 grasses because of their impact on digestibility and intake. Moreover, there appear to be differences in the inclusion of browse (including forbs) for the different buffalo forms. The main difference between the subspecies is that the northern savanna forms have a diet comprised of C4 grasses; they take also 10–15 per cent browse in the dry season (de Iongh et al., Reference Hashim2011; this is nearly completely in the form of the buds and fruits of Caesalpineacea in Benoué NP, Cameroon: Erik Klop, personal communication). Indeed, the range of S. c. brachyceros is typically below 500 m altitude, and that of S. c. aequinoctialis between 200 and 800 m a.s.l. The Cape buffalo also takes about 10 per cent browse (mainly in the dry season: Prins, Reference Prins1996) while in the non-montane areas below 2000 m altitude, the grasses they forage on are also of the C4 type. However, above 3000 m and in wetlands, the grasses are of the C3 type in East Africa (Tieszen et al., Reference Tieszen, Senyimba, Imbamba and Troughton1979); further south this shift occurs at about 2800 m (Morris et al., Reference Morris, Taintoi and Boleme1993). An estimated 10 per cent of the original range of S. c. caffer is higher than 3000 m a.s.l., and about 30 per cent above 2500 m, so a substantial proportion of the diet of buffalo before the expansion of human agriculture may have been comprised of C3 grass (see altitude maps in SEDAC n.d.). Note that the map of the ratio of C3 over C4 plants in Africa proposed by Shanahan et al. (Reference Shanahan, Hughen and McKay2016) cannot be used for this comparison because it includes trees and shrubs (most of which use the C3 photosynthetic pathway). The rainforest grass species that comprise the diet of the forest buffalo are mainly the C3 type (Bocksberger et al., Reference Bocksberger, Schnitzler and Chatelain2016). The digestibility of C3 grasses is much higher than that of C4 grasses. In other words, diets of the different subspecies are subtly different (Table 8.2).
Table 8.2 The different subspecies of buffalo basically have different diets. The different photosynthesis pathways of C3 and C4 grasses have major repercussions for digestibility of the food and intake rates (see text). A sizeable proportion of the original distribution area of the Cape buffalo was above 3000 m altitude before agriculture displaced them.
| Percentage browse | Type of grass | |
|---|---|---|
| Forest buffalo | ~30% (Bekhuis et al., Reference Bekhuis, de Jong and Prins2008) | C3 photosynthetic pathway |
| Northern savanna buffalo | ~10% (de Iongh et al., Reference Hashim2011) | C4 photosynthetic pathway |
| Cape buffalo | ~10% (Prins, Reference Prins1996) | Below 2000 m altitude: C4 photosynthetic pathway Above 3000 m altitude: C3 photosynthetic pathway |
In East and South Africa, probably all terrain higher than 1500 m but lower than 3500 m has been taken over by agriculture since the start of the Iron Age up until the present. These are so-called Tropical Highlands (see for a map: IFPRI, Reference Iongh, de Jong and van Goethem2015). On the basis of this, we posit that before the current fragmentation of the range of the African buffalo due to human expansion, some populations of the subspecies caffer could easily have moved up to areas with C3 grasses during the dry season, while other populations could have used that type of grass year-round. These buffalo must thus have been buffered against the negative effects of a pronounced dry season. The northern savanna buffalo (aequinoctialis but especially brachyceros), on the other hand, would have suffered much more from droughts and the dry season in general. Indeed, a migration centred on rivers would have been a good ‘evolutionary answer’ to that challenge (as was found by Cornélis, Reference Comeault and Matute2011, for S. c. brachyceros). Proper migratory behaviour of S. c. caffer has not been reported, although there is a hint of it from the early 1960s in northern Tanzania’s Lake Manyara region, where a migration may have been centred on the Tarangire River (Prins, Reference Prins1996). Short-distance migrations of S. c. caffer have also been reported from woodlands at a relative short distance from the Okavango Delta and from the Linyanti Swamps, both in Botswana (see Chapter 5 for details). It is not known to the present authors whether buffalo forage on C3 grasses in these riverine systems or swamps. Altitudinal seasonal migration (still) occurred between the Rift Valley bottom lands and adjacent high-altitude areas (volcanoes and Ngorongoro Crater highlands) of northern Tanzania in the 1970s and 1980s (P. Chardonnet, personal observations and personal communication). These higher areas abound(ed) in C3 grasses (see Clayton, Reference Clayton1970; Clayton et al., Reference Clayton, Phillips and Renvoize1974).
The intake of C3 grasses has two very important advantages over C4 grasses: first, the digestibility of C3 grasses is considerably higher, and second, intake is determined to a large extent by rumen fill, which appears to be mainly determined by NDF (neutral detergent fibre). C4 grasses are more fibrous than C3 grasses (see e.g. García et al., Reference García, Islam, Clark and Martin2014 for a review). The throughput rate also is much lower if the fibre content (as in C4 grasses) is higher (Blaxter, Reference Blaxter1962, p. 196). In other words, everything being equal, it is easier for S. c. caffer and S. c. nanus to acquire energy for lactation and growth than for S. c. brachyceros or S. c. aequinoctialis. However, for nanus there may be a disadvantage to forage of highly digestible grass because the heat of digestion could be higher than if foraging on food that is slower to digest (see Blaxter, Reference Blaxter1962).
The Competitors of the African Buffalo Subspecies
Because the different forms of African buffalo live in such different environments (habitats), the animal species they (potentially) share resources with are very different. A little is known already about the habitat requirements of the enormous array of African herbivores, but a striking pattern is that the habitat requirements of these many species coupled with historical processes (and chance) has led to a spatially very variable distribution of these species (see Prins and Olff, Reference Prins, Olff, Newbery, Prins and Brown1998). The African buffalo has (together with the leopard Panthera pardus and the African elephant) the widest of all distributions of African large mammals, thus overlapping with a very variable suite of other herbivores. This insight leads to the conclusion that possible competition with most species can hardly have shaped the evolutionary pathway of African buffalo because the population of African buffalo is characterized by relatively small genetic distances, particularly within subspecies (Smitz et al., Reference Smitz, Berthouly and Cornélis2013), and has been vast for hundreds of thousands of years (Chen et al., Reference Chen, Qiu and Jiang2019; de Jager et al., Reference Jager, Glanzmann and Möller2021). In Table 8.3 we present a non-exhaustive overview of the ‘constant’ (i.e. occurring everywhere) potential competitors for the three African buffalo forms, and the ‘variable’ ones (i.e. large herbivorous species that do not occur everywhere in the range of a particular subspecies).
Table 8.3 African buffalo are large grazers with a variable admixture of browse (from woody species and from herbs) in their diet. Some herbivore mammalian species share resources with them, which we tabulated only for those species heavier than 50 kg and with some grass in their diet. Of these, the ‘constant competitors’ co-occur with African buffalo (or did so in the recent 5000 years or so) nearly everywhere (species names in bold). Other potentially competing species, which we termed the ‘variable competitors’, co-occur with buffalo only here and there. In this table we split the ‘northern savanna buffalo’ in to S. c. aequinoctialis and S. c. brachyceros. N = number of species that may show overlap in resource use with a particular form of buffalo. Species are arranged alphabetically.
| Adult mass 50–100 kg | Adult mass 100–200 kg | Adult mass 200–400 kg | Adult mass >400 kg | N | |
|---|---|---|---|---|---|
| Forest buffalo (250–300 kg) | Bushbuck Sitatunga | Bongo Okapi | African elephant Hippopotamus | 6 | |
| Northern savanna buffalo: brachyceros (300–600 kg) | Bushbuck Kob Sitatunga | Hartebeest Topi (korrigum) Roan antelope Waterbuck | Bongo Giant eland | African elephant Hippopotamus | 11 |
| Northern savanna buffalo: aequinoctialis (400–700 kg) | Bushbuck Kob Nile lechwe Sitatunga | Greater kudu Hartebeest Roan antelope Topi (Tiang) Waterbuck | Bongo Giant eland | African elephant Hippopotamus Northern white rhino | 14 |
| Cape buffalo (500–800 kg) | Blesbok Bohor reedbuck Bushbuck Grant’s gazelle Gerenuk Hirola Impala Mountain nyala Nile lechwe Nyala Puku Sitatunga Southern lechwe Lesser kudu Southern reedbuck | Black wildebeest Bontebok greater kudu Hartebeest Roan antelope Sable antelope Topi Waterbuck | Blue wildebeest Common eland Grant’s zebra Mountain zebra Plains zebra | African elephant Hippopotamus Southern white rhino | 32 |
While we posit that the ‘variable competitors’ on a species level do not exert particular selective pressure, as an ensemble they could do so because in no habitat is a particular ‘subspecies’ of buffalo free from these variable competitors. Their omnipresent competitor is the African elephant in its two forms (Loxodonta [a.] africana and L. [a.] cyclotis). Adults are always much heavier (respectively, 3000–6000 kg and 2700 kg) and have much more browse in their diet. So this may suggest that buffalo would encounter a negative selection pressure against increasing in size. Their main ‘constant’ competitor may be or has been the hippo (Hippopotamus amphibius). They are true grazers and twice as heavy as buffalo, thus preventing buffalo from getting heavier (see Olff et al., Reference Olff, Ritchie and Prins2002). All of their other competitors are smaller or do not compete over most of the range of the populations of the three forms (Table 8.3). Outside of the rainforest, their most important potential competitor would be the two species of eland. The giant eland is a browser over nearly the entire year, while the common eland is a browser during the dry season when food is scarce. From this we conclude that the other herbivores would exert stabilizing selection on the body mass of the different forms of African buffalo (see also Prins and Olff, Reference Prins, Olff, Newbery, Prins and Brown1998). They potentially have a very important facilitatory role for the species mentioned to the left of the column in which the different buffalo subspecies are located (cf. Prins and Olff, Reference Prins, Olff, Newbery, Prins and Brown1998; Olff et al., Reference Olff, Ritchie and Prins2002). This is especially the case for the Cape buffalo.
The Predators of the African Buffalo Subspecies
The three main types of African buffalo, namely the forest buffalo, the northern savanna buffalo and the Cape buffalo, live in very different worlds, or, better expressed, cohabited until very recently before the collapse of nature conservation in West Africa in very different worlds. The main difference is that adult forest buffalo are basically predator-free (except for man). Lions (Panthera leo) are absent from the tropical rainforest proper. The African golden cat (Caracalla aurata) with its maximum body mass of only 16 kg is no match, but a 90-kg leopard is. Leopard density may be approximately equal in rainforest and savanna environments (e.g. Jenny, Reference Jenny1996 for rainforest versus Balme et al., Reference Balme, Hunter and Slotow2007, for savanna), but spotted hyaena (Crocuta crocuta), a formidable predator in savannas, are absent from rainforests proper (see map in Varela et al., Reference Varela, Rodríguez and Lobo2009), as are wild dogs (a.k.a. painted dog, Lycaon pictus; Woodroffe et al., Reference Woodroffe, Ginsberg and Macdonald1997). The forest buffalo may encounter African dwarf crocodiles (Osteolaemus tetraspis), which are likely to be insignificant predators, like the West African slender-snouted crocodile (Mecistops cataphractus), the Central African one (M. leptorhynchus) or even the sacred crocodile (Crocodylus suchus).
The northern savanna buffalo had to deal with lions until this large predator basically went extinct, as the Cape buffalo still must do. Lions are large predators (adult females about 115 kg and adult males about 220 kg). Wild dogs are now next to extinct nearly anywhere in West and Central Africa (Woodroffe et al., Reference Woodroffe, Ginsberg and Macdonald1997). We do not think the sacred crocodile was much of a threat to the northern savanna buffalo, nor were African wild dogs before they went functionally extinct in West and Central Africa. The much larger Nile crocodile (C. niloticus) appears to be a predator for the Cape buffalo. Finally, the African python (Python sebae) may perhaps be an occasional threat to calves of all buffalo subspecies. Spotted hyena and African wild dogs prey on buffalo calves and juveniles in the northern, eastern and southern savannas, but are rarely a threat to adult buffalo (Table 8.4). The different jackal species are insignificant.
Table 8.4 The different subspecies of African buffalo share their habitat with different predators. We have taken S. c. aequinoctialis and S. c. brachyceros together as ‘northern savanna buffalo’. The subspecies with the biggest horns, namely, the Cape buffalo seems to live in the most dangerous environment.
| Predator of adults | Predator of calves | |
|---|---|---|
| Forest buffalo | None | Leopard, African python |
| Northern savanna buffalo | Lion | Leopard, spotted hyena, African wild dog, African python |
| Cape buffalo | Lion, Nile crocodile | Leopard, spotted hyena, African wild dog, African python |
From this it follows that there has been a selection pressure for becoming big in the savannas to escape predation from lions and perhaps Nile crocodiles. In the rainforest we believe that the predation pressure has not been high, and buffalo would only have run a risk of major predation if they had attained the size of duiker antelopes.
Are the Subspecies of the African Buffalo Functionally Different?
Currently, maximally five subspecies are considered to be relevant for a discussion on what the African buffalo ‘is’. These are Syncerus caffer caffer (the Cape buffalo), S. c. nanus (the forest buffalo), S. c. brachyceros (the West African bush cow), S. c. aequinoctialis (the Nile buffalo) and S. c. matthewsii (the mountain buffalo). The last one is morphologically not well distinguishable from the nominate subspecies, and functionally ecological research does not provide any clue as to why it would be different if we take the Virunga buffalo as matthewsii. If not, and the subspecies must be found closer to Lake Tanganyika, then it comprises a blank spot in our knowledge.
The forest buffalo S. c. nanus of the rainforests of Central Africa and West Africa are functionally very different from the nominate subspecies. Actually, they are morphologically and functionally so different that most ecologists would not reject species status. Genetics, however, shows how intrinsically they are related to the nominate subspecies (Van Hooft et al., Reference Hsieh, Veeramah and Lachance2002; Smitz et al., Reference Smitz, Berthouly and Cornélis2013). Their difference does not show up as much in their habitat use (see Korte, Reference Korte2008; Bekhuis et al., Reference Bekhuis, de Jong and Prins2008: they mainly use the small savannas in the forest, logging roads and open marshes) than in their relationship with other species of the assemblage, while their morphology adheres to a common pattern of ‘forest species’. They have a more reddish coat colour, conspicuous white ear fringes (like the riverine bush pig Potamochoerus porcus), small body size, smaller incisor width, more ‘streamlined’ and smaller horns, and live in much smaller group sizes.
The two forms of the northern savannas pose more problems because so little is known of the ecology of this species in these areas (but see Cornélis, Reference Comeault and Matute2011). Yet the role of the different forms is well illustrated in Table 8.5. Cape buffalo appear to be located in the richest web (they show the highest degree of ‘embeddedness’), while the forest buffalo is perhaps only loosely connected to the other species in the rainforest, possibly indicative that it only recently entered the forest.
Table 8.5 The relationship with other mammals of the African buffalo depends on the subspecies (we have taken S. c. brachyceros and S. c. aequinoctialis together in this table). Data on predatory species are from Table 8.4, data on species that can be facilitated or species that can be competitive are from Table 8.3. We use the term ‘embeddedness’ instead of ‘connectedness’ because the latter is local food-web–dependent while ours is based on major regions (i.e. West African Guinea and Sudan savanna, West and Central rainforest and the whole region from Ethiopia to the Cape).
| Predatory species of adults | Predatory species of calves | Large mammal species that can be competitive | Large mammal species that can be facilitated by buffalo foraging | Embeddedness | |
|---|---|---|---|---|---|
| Forest buffalo | 0 | 2 | 4 | 2 | 8 |
| Northern savanna buffalo | 1 | 4 | 4 | 4 | 13 |
| Cape buffalo | 2 | 4 | 8 | 7 | 21 |
The Different Subspecies of the African Buffalo in a Human Context
Humans evolved in Africa; the genus to which we belong is about three million years old (nicely summarized in Dunsworth, Reference Dunsworth2010). The genus Syncerus is likely younger (Chapter 2). If the ancestral species of Syncerus caffer was S. acoelotus, then there is no convincing evidence that it was hunted by humans (Bobe and Behrensmeyer, Reference Bobe and Behrensmeyer2004). Homo may have started controlling fire some 1.2 Myr ago (James et al., Reference James, Dennell and Gilbert1989), as long as the oldest record of S. caffer (see above).
The Homo–Syncerus relationship has thus been a long-standing one. In the pre-Modern, this interaction was comprised of one that benefited buffalo when fire modified the vegetation to their benefit, producing more palatable grass, perhaps less tsetse flies and less shrubbery or even forest. Buffalo suffered from humans when they became better at killing large game. Different ways of killing became available over time, for example throwing stones to stampede a herd over a cliff (which can only be done if cliffs are available, for example in the Drakensberg region or some places along the coast in Transkei for instance). We do not think that spears ever made much of an impact on the level of populations even though we are aware that some men single-handedly killed a buffalo bull with a spear (Mr ole-Konchella as young warrior of the Masai did long before he became the Director of Tanzania National Parks; H. Prins, personal communication). Running prey to ground with weapons is an unlikely strategy for killing buffalo (Bunn and Pickering, Reference Bunn and Pickering2010). Bow-and-arrow technology is perhaps 300 kyr old (Lombard and Haidle, Reference Lombard and Haidle2012). We are not aware of successful bow-and-arrow hunting with traditional bows, in contrast to European-style long-bows or modern crossbows. Using poisons on arrows, however, is a successful strategy, as was demonstrated by traditional Hadza-hunters near Lake Eyasi (H. Prins, personal observation; cf. O’Connell et al., Reference O’Connell, Hawkes and Jones1988). Bambote hunters of Zambia successfully kill buffalo with this technique (Terashima, Reference Terashima1980). Indeed, when a good market developed for ivory, Kamba started elephant hunting with poisoned arrows (Steinhart, Reference Steinhart2000). The oldest written description of buffalo refers to a similar hunting technique:
[In the Kingdom of Mali] there are undomesticated buffalo which are hunted like wild beasts, in the following fashion. They carry away little calves such as may be reared in their houses, and when they want to hunt the buffaloes they send out one of these calves to the place where the buffaloes are so that they may see it, make towards it, and become used to it because of the unity of the species which is a cause of association. When they have become used to it the hunters shoot them with poisoned arrows. Having cut out the poisoned place, that is, where the arrow has struck and round about it, they eat the flesh.
Netting is a viable strategy to capture game, for instance in a rainforest, but needs large groups of cooperating people (H. Prins, personal observation; Abruzzi, Reference Abruzzi1979) and the largest prey thus taken may be bushbuck Tragelaphus sylvaticus (Terashima, Reference Terashima1980; Sato, Reference Sato1983). Traditional spring traps can catch prey as heavy as bushbuck and yellow-backed duiker Cephalophus silvicultur (H. Prins, personal observation; Sato, Reference Sato1983). Pre-Modern hunting techniques were likely to be sustainable (Hitchcock, Reference Hooft, Groen and Prins2000).
We posit that it is really with the invention of steel wire (by Wilhelm Albert in 1834), the gin trap and the shotgun that buffalo started directly suffering from people. Leg traps made of steel wire attached to long lines of hundreds to thousands of metres of steel cable can play havoc with buffalo (for a description see Sinclair, Reference Sinatra and Lombardi1977, p. 25). In some hunting concessions, concessionaires removed tens of thousands of steel wire snares in northern Tanzania (Hurt and Ravn, 2000). The impact of using snares on a population can be severe (cf. Mduma ert al., Reference Mduma, Hilborn, Sinclair, Newbery, Prins and Brown1998). The old-fashioned shotgun basically eradicated buffalo from South Africa, and even just before the independence of Mozambique, the Portuguese shot some 50,000 buffalo for potential gain. Storehouse rooms filled with hooves and dried scrota skins were still a macabre reminder in 1993 (H. Prins, personal observation).
Through agriculture, humans started domineering the landscape. Instead of simply a supply of proteins and fat, buffalo started becoming a nuisance when they damaged crops. Because browse is unimportant in their diet (see above), they would hardly have been an issue to beans, peas or yams. However, even native species such as sorghum would not be very attractive to buffalo because many varieties are high in prussic acid and lignin. Millet, on the other hand, is a good fodder source. Agriculture and associated iron smelting only became important in West Africa around 500 bce, around 500 ce in the Great Lakes area, around 1000 ce in small mountainous pockets in East Africa, and even later in South Africa. In the rainforest zone, the savanna environment slowly but surely disappeared during the Holocene, and agriculture even disappeared (e.g. Tutin and White, Reference Tutin, White, Newbery, Prins and Brown1998). Slash-and-burn cultivation, so important in western Africa, enabled the expansion of the Guinea savanna and the Sudan savanna, allowing the expansion of buffalo habitat. In other words, African buffalo may have benefited from humans perhaps until the advent of Modern days. In contrast to East and southern Africa, the West African kingdoms all used cavalry since about 1000 ce, indicative of well-developed grasslands (Fisher, Reference Fisher1972; Ukpabi, Reference Ukpabi1974; Sayer, Reference Sayer1977), but how much buffalo hunting on horseback took place is not known even though they used stirrups. Plains Indians in North America were only able to have a devastating impact on American bison when they adopted horseback hunting.
The Cape buffalo, however, may have started suffering from humans more than the northern savanna buffalo (which benefited from forest conversion). The advent of pastoralism from the Sudan towards the Cape was a slow process (at a rate of about 5 km per generation; Prins, Reference Prins, Prins, Grootenhuis and Dolan2000), but as cattle and buffalo largely use the same resources, and as people are able to monopolize water sources, pastoralists can outcompete grazers like buffalo (Prins, Reference Prins1992; Prins and de Jong, Reference Prins, de Jong, Kiffner, Bond and Lee2022).
Speculation on Further Subspeciation of the African Buffalo
Table 8.6 summarizes of the selection forces on the different forms of buffalo that we envisage.
Table 8.6 Putative selection forces on body mass of the different forms of the African buffalo in the different habitats where they live.
| Heat management | Food management | Competitor management | Predator management | Overall selection | |
|---|---|---|---|---|---|
| Forest buffalo | Selection to become smaller | Selection to become smaller | Stabilizing selection | No selection | Become smaller |
| Northern savanna buffalo | Selection to become bigger | Selection to become bigger | Stabilizing selection | Selection to become bigger | Become bigger |
| Cape buffalo | Selection to become bigger | Selection to become bigger | Stabilizing selection | Selection to become bigger | Become bigger |
What would the consequences be of S. c. nanus becoming smaller? We would not be amazed that it might be able to cope better with climate warming, and become much smaller before encountering serious negative effects from bushbuck and sitatunga (T. spekii; both as potentially competing species) or leopards (as major predator).
Yet in a world where people allowed the northern savanna buffalo to continue to live in protected areas, the reality of the West African context would perhaps be that the absence of sufficient shade or wallowing holes would make their lives unbearable, but the extreme scarcity or even absence of predators and competing species would not hinder further evolution towards bigger sizes. Indeed, in West Africa today the lion is nearly extinct, and potentially competing species (Table 8.3) are very rare. The east and southern savanna buffalo, if well-protected, could also well become bigger under natural selection (Table 8.6).
We started this attempt to understand the differences between the forms or subspecies of the African buffalo with three storylines. We did not want to use the term ‘hypothesis’ because in science a hypothesis is a strong presumption preferably based on theory or a set of coherent observations. Too much is missing from the palaeontological records to formulate a proper hypothesis concerning the evolutionary (in contrast to genetical) relationship between the subspecies or forms of the African buffalo. The Popperian instrument of falsifying also is not in our toolkit, so we have to fall back on the concept of plausibility instead of falsifiability. We do this to stimulate research into the question of whether subspecies are ecologically (not classificatory) speaking meaningful entities without claiming ‘proof’ (see Walton, Reference Walton1988, Reference Walton2001), yet the concept of ‘plausibility’ may become more important in science than it was before (see Sinatra and Lombardi, Reference Sinclair2020).
Storyline 2 is of importance here. It states that the original large buffalo Syncerus acoelotus was able to infiltrate the rainforest (perhaps at times when the forest was reduced to only gallery forest during one of the Glacial Periods; about 150 kyr; de Jager et al., Reference Jager, Glanzmann and Möller2021). Indeed, present-day forest buffalo mainly use small savannas in the rainforest, which savannas have been shrinking in size during the Holocene (Tutin and White, Reference Tutin, White, Newbery, Prins and Brown1998). Secondary dwarfing took place there and the subspecies S. c. nanus arose. At times when the rainforest nearly disappeared (e.g. during the Last Glacial Maximum), hybridization took place with S. c. aequinoctialis leading to the form S. c. brachyceros. The further west one travels, the lesser the imprint of S. c. aequinoctialis is expected to be visible in S. c. brachyceros, leading to a cline. So, how plausible does it sound that dwarfing of the descendants of S. acoelotus took place in the rainforest but not in the savanna? Table 8.6 summarizes our feeling that dwarfing (or better stated: miniaturization) would be under positive selection. The genetics of both dwarfing (Boegheim et al., Reference Boegheim, Leegwater, van Lith and Back2017) and miniaturization (Bouwman et al., Reference Bouwman, Daetwyler and Chamberlain2018; see also Boden, Reference Boden2008) are well understood in cattle and other species. ‘Dwarfing’ is often associated with negative effects, but miniaturization much less so. Miniaturization has been observed in Asian buffalo (weighing only 200 kg: Anilkumar et al., Reference Anilkumar, Syman Mohan, Ally and Sathian2003) and in cattle (mini zebu’s weighing only 150–250 kg: Boden, Reference Boden2008; Porter et al., Reference Porter, Alderson, Hall and Sponenberg2016). Selection can result quickly in small forms (Miniature Texas Longhorns, n.d.).
Why would we posit the notion that Syncerus caffer brachyceros could be viewed as a ‘hybrid (sub-)species’? There are a number of reasons to think so. The first is that when the present-day Sahara was a savanna, other species of buffalo existed there, namely S. antiquus, where it lived with the now extinct Equus mauritianum and the white rhino (Ceratotherium simum). Because no fossil material of S. c. brachyceros (or S. c. aequinoctialis) is available, we do not know whether there was a zone to the south with S. c. nanus, a zone to the north with S. antiquus, and in between a zone with the two present-day subspecies (brachyceros and aequinoctialis). We do not find this very plausible because it assumes quite a lot. Intriguingly, the West African Guinea Savanna (between isohyets 1200 and 900 mm) and Sudan Savanna (between isohyets 900 and 600 mm), presently the habitat of S. c. brachyceros and S. c. aequinoctialis, appears to be largely man-made and rather recent due to people bringing slash-and-burn cultivation and fire management to this zone (Klop and Prins, Reference Klop and Prins2008). If we are correct, then S. c. brachyceros especially, and to a lesser extent S. c. aequinoctialis, can be viewed as hybrid ‘species’ similar to the European wisent (or European bison, Bison bonasus). Indeed, based on mitochondrial DNA, the European wisent nests more strongly with Bos taurus than with Bison bison (Bibi, Reference Bibi2013; Zuranoa et al., Reference Zuranoa, Magalhãesa and Asato2019); similar results were found using nuclear DNA (Druica et al., Reference Druica, Ciorpac and Cojocaru2016). The scenario in this case is that wisent arose as a hybrid between the aurochs (Bos primigenius) and the Steppe bison (Bison [Bos] priscus; see Verkaar et al., Reference Verkaar, Nijman and Beeke2004), even though not all geneticists agree. The modern B. bison may also be the result of hybridization between two subspecies of B. antiquus, namely, B. a. antiquus and a subspecies that evolved from B. antiquus into B. a. occidentalis (McDonald, Reference McDonald1981, p. 82). Presently, hybridization takes place between the lowland anoa (Bubalus depressicornis) and the mountain anoa (B. quarlesi) even though they are characterized by a very large divergence time of some 2 Myr (Kakoi et al., Reference Kakoi, Namikawa and Takenaka1994; Tanaka et al., Reference Tanaka, Solis and Masangkay1996) after they putatively immigrated into Sulawesi independently of each other (Takenaka et al., Reference Takenaka, Hotta and Kawamoto1987). Similarly, a hybrid zone exists between the two different species of Asian water buffalo, namely, the ‘river form’ B. bubalis and the ‘swamp form’ B. carabenensis (Mishra et al., Reference Mishra, Dubey and Prakash2015; Kumar et al., Reference Kullmer, Sandrock, Schrenk and Bromage2020). Microsatellite data seem to show that these two buffalo ‘species’ were already separated some 1.6 million years ago (Ritz et al., Reference Ritz, Glowatzki‐Mullis, MacHugh and Gaillard2000), while cytochrome-b data indicate a separation between 1.7 and 1 Myr (Schreiber et al., Reference Schreiber, Seibold, Nötzold and Wink1999). Nuclear data, underpinning their separation, also shows much introgression between these two forms (MacEachern et al., Reference MacEachern, McEwan and Goddard2009). In other words, much precedent exists for thinking that hybridization can result in new forms or species in large buffalo-like animals, strengthening the plausibility of its occurrence at the root of the existence of the bush cow (S. c. brachyceros).
An important consideration here is that the Guinea Savanna and Sudan Savanna are to a very large extent man-made environments due to shifting agriculture, slash-and-burn cultivation and intense use of fire (see Sankaran et al., Reference Sankaran, Hanan and Scholes2005; Klop and Prins, Reference Klop and Prins2008; Laris, Reference Laris2008). Grasses become quickly unpalatable when growing during the wet season, reaching heights of 2 m or more (see Penning de Vries and Djitèye, Reference Penning de Vries and Djitèye1982; Olff et al., Reference Olff, Ritchie and Prins2002). Further north lies the Sahel, but that is too dry for buffalo, and does not offer enough food for buffalo in the dry season (or for many of the East African grazers such as zebra; cf. Klop and Prins, Reference Klop and Prins2008). To describe the influence of human-induced habitat changes on the incidence of hybridization, the botanist Edgar Anderson (Reference Anderson1948) coined the phrase ‘hybridization of the habitat’. Indeed, numerous hybridization events are the outcome of anthropogenic actions (Ottenburghs, Reference Ottenburghs2021). In general, novel environments – whether induced by human actions or not – can offer opportunities for the evolution of hybrid plant species, as has already long been put forward regarding the recolonization of deglaciated areas after a glacial period (see e.g. Daubenmire, Reference Daubenmire1968; Young, Reference Young1970; Kallunki, Reference Kallunki1976; Fredskild, Reference Fredskild1991; Gussarova et al., Reference Gussarova, Popp, Vitek and Brochmann2008). A notable example involves the Arunachal macaque (Macaca munzala), a presumed hybrid between M. radiata and a member of the M. assamensis/thibetana group, which occupies a specialized ecological niche in mountain forests (Chakraborty et al., Reference Chaix, Faure, Guerin, Honegger, Krzyzaniak, Kroeper and Kobusiewicz2007). Similarly, the transgressive phenotype of the hybrid rodent species Lophuromys melanonyx allowed it to invade a new habitat zone (Lavrenchenko, Reference Lavrenchenko2008). These examples and additional cases of rapid hybrid speciation in other taxonomic groups (Comeault and Matute, Reference Cornélis, Melletti, Korte, Melletti and Burton2018; Ottenburghs, Reference Ottenburghs2018; Nevado et al., Reference Nevado, Harris, Beaumont and Hiscock2020) indicate that the hybrid origin of the brachyceros is a plausible storyline.
Conclusion
O’Brien and Mayr (Reference O’Brien and Mayr1991) provide guidelines to help think about subspecies: ‘Members of a subspecies share a unique geographic range or habitat, a group of phylogenetically concordant phenotypic characters, and a unique natural history relative to the subdivisions of the species.’ We believe that we have made the case that this applies to S. c. nanus and S. c. caffer. We are less convinced about a distinction between S. c. brachyceros and S. c. aequinoctialis; although they fall into two mtDNA clades, their nuclear DNA does not reveal distinction (Chapter 3). We do not believe that S. c. matthewsii should be maintained as a possible subspecies because phenotypically it is not very different from S. c. caffer and it also does not have a unique natural history. O’Brien and Mayr (Reference O’Brien and Mayr1991) continue with ‘Because they [the subspecies] are below the species level, different subspecies are reproductively compatible … are normally allopatric.’ Indeed, evidence of genetic barriers between nanus and caffer is insufficient, which thus precludes independent species status for these two forms. There is in effect gene flow between nanus and caffer because there are mtDNA haplotypes that are characteristic in nanus found in caffer and vice versa (Smitz et al., Reference Smitz, Berthouly and Cornélis2013), and there is thus successful hybridization. O’Brien and Mayr (Reference O’Brien and Mayr1991) end by stating that ‘most subspecies will be monophyletic, however they may also derive from ancestral subspecies hybridization’. We believe that this is happening and has happened with nanus and brachyceros, but also with aequinoctialis. This then would be our motivation to lump the northern savanna buffalo into one subspecies like Smith (Reference Smith1986) has done previously. In our weighing, we included not only genetic but also ecological and historical reasoning as advocated by O’Brien and Mayr (Reference O’Brien and Mayr1991). Because the Syrian Mameluke geographer Ibn Fadl Allah al-Umari was the first to write about these buffalo around 1337 ce (737 AH) (Levitzion and Hopkins, Reference Levitzion and Hopkins2000, p. 264), we propose to name it in his honour Syncerus caffer umarii, but will leave a formal decision of course to a taxonomist.
The selection forces for the forest buffalo appear to be very different than for the savanna buffalo; the former are expected to further dwarf if that is genetically possible, while the latter would benefit under natural conditions to increase in size. The critical environmental factor is that they should continue having access to sufficient water for cooling. The human impact had been negligible on all forms of buffalo until the relentless expansion of arable agriculture, monopolization of water resources and the widespread availability of steel for snares and gin traps. Indeed, if humans were to go extinct, there would be a bright future for buffalo.


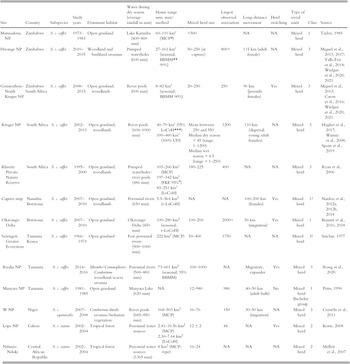


 Open access