


Paul Erdős, arguably the most prolific mathematician in the twentieth century, was, by all accounts, rather eccentric. The Hungarian-born mathematician – who moved to the US before the start of WWII – lived out of a ragged suitcase that he famously dragged with him to scientific conferences, universities, and the homes of colleagues all over the world. He would show up unannounced on a colleague’s doorstep, proclaim gleefully, “My mind is open.” He then spent a few days working with his host, before moving on to surprise some other colleague at some other university. His meandering was so constant that it eventually earned him undue attention from the FBI. To his fellow mathematicians, he was an eccentric but lovable scientist. But to law enforcement officers during the Cold War, it was suspicious that he crossed the Iron Curtain with such ease. Indeed, Erdős was once arrested in 1941 for poking around a secret radio tower. “You see, I was thinking about mathematical theorems,” he explained to the authorities in his thick Hungarian accent. It took decades of tracking for the Bureau to finally believe him, concluding that his rambling was indeed just for the sake of math.
His whole life was, too. He had no wife, no children, no job, not even a home to tie him down. He earned enough in guest lecturer stipends from universities and from various mathematics awards to fund his travels and basic needs. He meticulously avoided any commitment that might stand in the way of his work. Before he died in 1996 at the age of 83, Erdős had written or coauthored a stunning 1,475 academic papers in collaboration with 511 colleagues. If total publication counts as a measure of productivity, how does Erdős’ number compare to the productivity of an ordinary scientist? It surely seems exceptional. But how exceptional?
1.1 How Much Do We Publish?
Scholarly publications are the primary mode of communication in science, helping disseminate knowledge. The productivity of a scientist captures the rate at which she adds units of knowledge to the field. Over the past century, the number of publications has grown exponentially. An important question is whether the growth in our body of knowledge is simply because there are now more scientists, or because each scientist produces more on average than their colleagues in the past.
An analysis of over 53 million authors and close to 90 million papers published across all branches of science shows that both the number of papers and scientists grew exponentially over the past century [Reference Dong, Ma and Shen4]. Yet, while the former grew slightly faster than the latter (Fig. 1.1a), meaning that the number of publications per capita has been decreasing over time, for each scientist, individual productivity has stayed quite stable over the past century. For example, the number of papers a scientist produces each year has hovered at around two for the entire twentieth century (Fig. 1.1b, blue curve), and has even increased slightly during the past 15 years. As of 2015, the typical scientist authors or coauthors about 2.5 papers per year. This growth in individual productivity has its origins in collaborations: Individual productivity is boosted as scientists end up on many more papers as coauthors (Fig. 1.1b, red curve). In other words, while in terms of how many scientists it takes to produce a paper, that number has been trending downwards over the past century, thanks to collaborative work individual productivity has increased during the past decade.
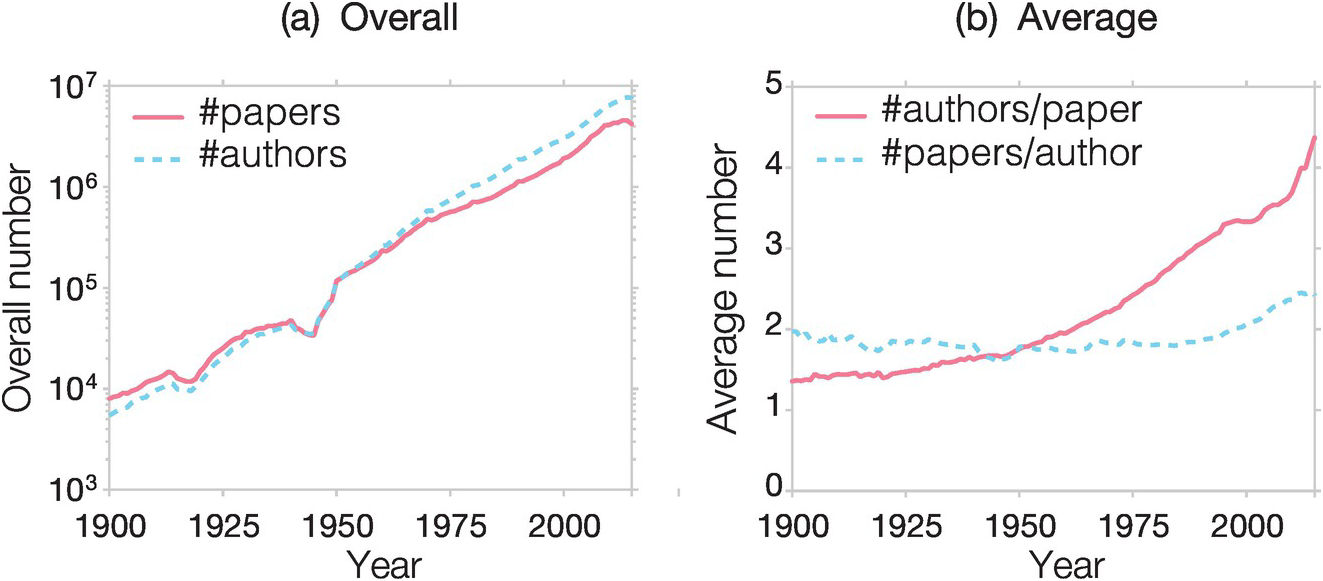
Figure 1.1 The growing number of scientists. (a) During the past century, both the number of scientists and the number of papers has increased at an exponential rate. (b) The number of papers coauthored by each scientist has been hovering around two during the past 100 years, and increased gradually in the past 15 years. This growth is a direct consequence of collaborative effects: Individual productivity is boosted as scientists end up on many more papers as coauthors. Similar trends were reported using data within a single field [Reference Sinatra, Deville and Szell5]. For physics, for example, the number of papers coauthored by each physicist has been less than one during the past 100 years, but increased sharply in the past 15 years.
1.2 Productivity: Disciplinary Ambiguities
But, when it comes to a scientist’s productivity, it’s not easy to compare across disciplines. First, each publication may represent a unit of knowledge, but that unit comes in different sizes. A sociologist may not feel their theory is fully articulated unless the introduction of the paper spans a dozen pages. Meanwhile, a paper published in Physical Review Letters, one of the most respected physics journals, has a strict four-page limit, including figures, tables, and references. Also, when we talk about individual productivity, we tend to count publications in scientific journals. But in some branches of the social sciences and humanities, books are the primary form of scholarship. While each book is counted as one unit of publication, that unit is admittedly much more time-consuming to produce.
And then there is computer science (CS). As one of the youngest scientific disciplines (the first CS department was formed at Purdue University in 1962), computer science has adopted a rather unique publication tradition. Due to the rapidly developing nature of the field, computer scientists choose conference proceedings rather than journals as their primary venue to communicate their advances. This approach has served the discipline well, given everything that has been accomplished in the field – from the Internet to artificial intelligence – but it can be quite confusing to those outside the discipline.
Ignoring the varying publication conventions that characterize different disciplines can have serious consequences. For example, in 2017, the US News and World Report (US News), which develops authoritative ranking of colleges, graduate schools, and MBA programs around the world, published their first ranking of the world’s best computer science departments. The ranking was so absurd that the Computing Research Association (CRA) had to put out a special announcement, calling it “nonsense” and “a grave disservice” to its readers.
How could an experienced organization specializing in ranking academic institutions get it so wrong? It turns out that US News calculated their rankings based on journal publications recorded by Web of Science, a procedure that served them well in all other disciplines. But, by ignoring peer-reviewed papers published in conferences, the US News rankings were completely divorced from computer scientists’ own perceptions of quality and impact.
The productivity difference across disciplines can be quantified using data from the National Research Council on research doctorate programs in the US [Reference Goldberger, Maher and Flattau6, Reference Baird7]. Using the average number of publications by faculty in each department over a five-year period as a proxy, researchers find that the numbers ranged from 1.2 in history to 10.5 in chemistry. Even between similar disciplines we see large productivity differences. For example, within biological sciences, faculty productivity ranged from 5.1 in ecology to 9.5 in pharmacy.
Taken together, the data presented so far in this chapter make at least one message crystal clear: no matter how we measure it, the productivity of a typical scientist is nowhere near Erdős’. Indeed, his total – 1,475 papers – implies a staggering two papers per month over a span of 60 years. By contrast, a study focusing on more than 15 million scientists between 1996 and 2011, found that less than 1 percent of our colleagues managed to publish at least one paper every year [Reference Ioannidis8]. Hence, only a small fraction of the scientific workforce can maintain a steady stream of publications. Interestingly, this small fraction contains the most high-impact researchers. Though they represent less than 1 percent of all publishing scientists, this stable core puts out 41.7 percent of all papers, and 87.1 percent of all papers with more than 1,000 citations. And if a productive scientist’s pace lags, so does the impact of their contributions. Indeed, the average impact of papers published by a researcher is substantially lower if they skipped even a single year.
While Erdős is an outlier, his impressive productivity speaks to the enormous productivity differences among researchers. Why are there such differences? After all, we all have a 24-hour day to work with. So how can people like Erdős be so much more productive than their peers? To answer these questions, we need to visit the legendary Bell Laboratory in its heyday.
1.3 Productivity: The Difference
The career of William Shockley, the man who brought silicon to Silicon Valley, was not free of controversies. To be sure, his attempts to commercialize a new transistor design in the 1950s and 1960s transformed the Valley into the hotbed of electronics. Yet, his troubling advocacy for eugenics eventually isolated him from his colleagues, friends, and family. Shockley spent his most productive years at the Bell Laboratory, where he co-invented the transistor with John Bardeen and Walter Brattain. That discovery not only won the trio the 1956 Nobel Prize in Physics, it also began the digital revolution we continue to experience today.
While managing a research group at Bell Labs, Shockley became curious [Reference Shockley9]: Were there measurable differences in the productivity of his fellow researchers? So he gathered statistics on the publication records of employees in national labs such as Los Alamos and Brookhaven. Once he charted the numbers, he was surprised by the outcome: The curve indicated that individual productivity, the number of papers published by a researcher, N, follows a lognormal distribution
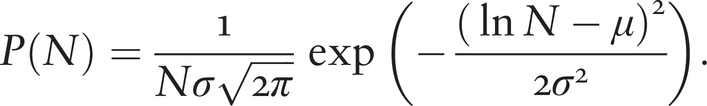 (1.1)
(1.1)Lognormal distributions are fat-tailed, capturing great variations in productivity. In other words, Shockley learned that most researchers publish very few papers, whereas a non-negligible fraction of scientists are orders of magnitude more productive than the average. Evidence for (1.1) is shown in Fig. 1.2, plotting the distribution of the number of papers written by all authors listed in INSPECT, together with a lognormal fit [Reference Fronczak, Fronczak and Hołyst10].
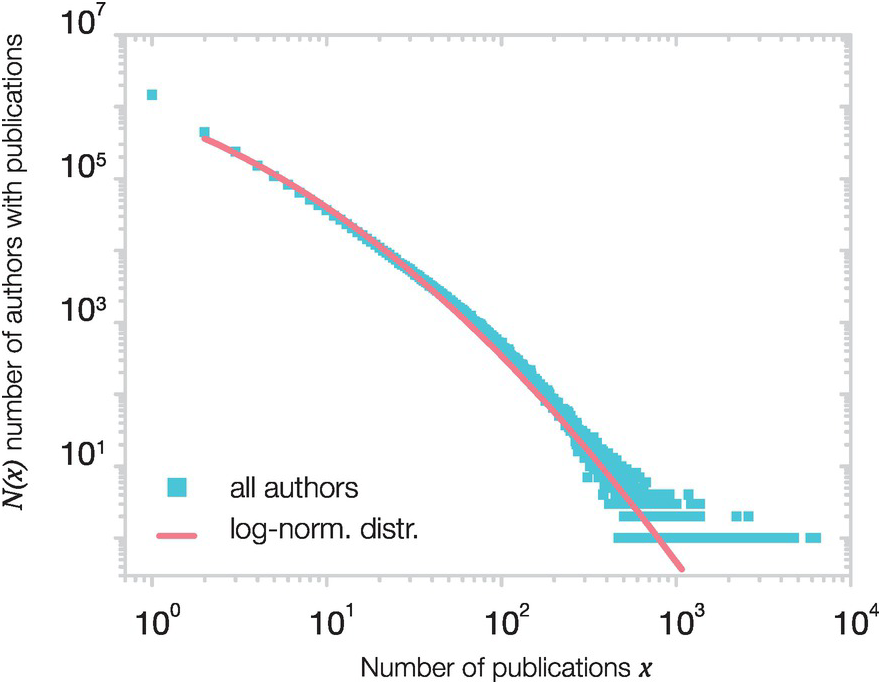
Figure 1.2 Productivity distribution. The blue symbols show the number of papers published by all authors listed in the INSPECT database of scientific and technical literature, in the period 1969–2004 (over 3 million authors). The red line corresponds to the lognormal fit to the data (1.1).
Box 1.1 The study of productivity has a long history [Reference Shockley9–Reference Radicchi and Castellano15]
In 1926, Alfred J. Lotka [Reference Lotka11] observed that the number of papers produced by scientists follows a fat-tailed distribution. In other words, he found that a small fraction of scientists are responsible for the bulk of scientific literature. Lotka studied 6,891 authors listed in Chemical Abstracts publishing between 1907 and 1916, concluding that the number of authors making N contributions follows a power law
where the exponent α ≈ 2. A power law predicts that productivity has a long tail, capturing major variations among individuals. Note that it often requires a large amount of data to reliably distinguish a power law from a lognormal distribution [Reference Shockley9], which Lotka did not have in 1926.
This lognormal distribution of productivity is rather odd, as Shockley quickly noticed. Indeed, in most competitive arenas, individual performance metrics almost always follow a narrow distribution. Think about running. At the Rio Olympics in 2016, Usain Bolt finished the 100-meter final in just 9.81 seconds. Justin Gatlin came in second and Andre De Grasse in third, with running times 9.89 s and 9.91 s, respectively. These numbers are awfully close, reflecting a well-known fact that performance differences between individuals are typically bounded [Reference Barabási16]. Similarly, Tiger Woods, even on his best day, only took down his closest contenders by a few strokes, and the fastest typist may only type a few words more per minute than a merely good one. The bounded nature of performance reminds us that it is difficult, if not impossible, to significantly outperform the competition in any domain. Yet, according to Fig. 1.2, this boundedness does not hold for scientific performance. Apparently, it is possible to be much better than your competitors when it comes to churning out papers. Why is that?
1.4 Why So Productive?
Shockley proposed a simple model to explain the lognormal productivity distribution he observed (Eq. 1.1) [Reference Shockley9]. He suggested that in order to publish a paper, a scientist must juggle multiple factors, like:
F1. Identify a good problem.
F2. Make progress with it.
F3. Recognize a worthwhile result.
F4. Make a decision as to when to stop the research and start writing up the results.
F5. Write adequately.
F6. Profit constructively from criticism.
F7. Show determination to submit the paper for publication.
F8. Make changes if required by the journal or the referees.
If any of these steps fail, there will be no publication. Let us assume that the odds of a person clearing hurdle Fi from the list above is pi. Then, the publication rate of a scientist is proportional to the odds of clearing each of the subsequent hurdles, that is N ~ p1p2p3p4p5p6p7p8. If each of these odds are independent random variables, then the multiplicative nature of the process predicts that P(N) follows a lognormal distribution of the form (1.1).
To understand where the outliers come from, imagine, that Scientist A has the same capabilities as Scientist B in all factors, except that A is twice as good at solving a problem (F2), knowing when to stop (F4), and determination (F7). As a result, A’s productivity will be eight times higher than B’s. In other words, for each paper published by Scientist B, Scientist A will publish eight. Hence small differences in scientists’ ability to clear individual hurdles can together lead to large variations in overall productivity.
Shockley’s model not only explains why productivity follows lognormal distribution, but it also offers a framework to improve our own productivity. Indeed, the model reminds us that publishing a paper does not hinge on a single factor, like having a great idea. Rather, it requires scientists to excel at multiple factors. When we see someone who is hyper-productive, we tend to attribute it to a single exceptional factor. Professor X is really good at coming up with new problems (F1), or conveying her ideas in writing (F5). The model suggests, however, that the outliers are unlikely to be explained by a single factor; rather, a researcher is most productive when she excels across many factors and fails in none.
The hurdle model indicates that a single weak point can choke an individual’s productivity, even if he or she has many strengths. It also tells us that Erdős may have not been as superhuman as we often think he was, or that his productivity might be attainable with careful honing of various skills. Indeed, if we could improve at every step of writing a paper, and even if it’s just a tiny bit in each step, these improvements can combine to exponentially enhance productivity. Admittedly, this is easier said than done. But you can use this list to diagnose yourself: What step handicaps your productivity the most?
The remarkable variations in productivity have implications for reward. Indeed, Shockley made another key observation: while the productivity of a scientist is multiplicative, his salary – a form of reward often tied to performance – is additive. The highest paid employees earn at best about 50–100 percent more than their peers. There are many reasons why this is the case – it certainly seems fairer, and it helps ensure a collaborative environment. Yet, from a paper-per-dollar perspective, Shockley’s findings raise some interesting questions about whether the discrepancy between additive salaries and multiplicative productivities could be exploited. Indeed, an institution may be better off employing a few star scientists, even if that means paying them a great deal more than their peers. Shockley’s arguments are often used as a rationale for why top individuals at research-intensive institutions are offered much higher salaries and special perks, and why top departments within a university get disproportionately more funding and resources.
To be sure, gauging a career based on publication count alone grossly misrepresents how science works. Yet, individual productivity has been shown to closely correlate with the eminence of a scientist as well as her perceived contributions to the field. This pattern was documented by Wayne Dennis, dating back at least to 1954 [Reference Dennis1], when he studied 71 members of the US National Academy of Sciences and eminent European scientists. He found that, almost without exception, highly productive individuals have also achieved scientific eminence, as demonstrated by their listing in the Encyclopedia Britannica or in histories of important developments they have contributed to the sciences. Higher productivity has been shown to increase the odds of receiving tenure [Reference Bertsimas, Brynjolfsson and Reichman17], and of securing funding for future research [Reference Stephan18]. At the institutional level, the publication rates of the faculty are not only a reliable predictor of a program’s reputation, they also influence the placement of graduates into faculty jobs [Reference Clauset, Arbesman and Larremore19].
In sum, sustained high productivity is rare, but it correlates with scientific impact and eminence. Given this evidence, it may appear that productivity is the key indicator for a meaningful career in science. Yet, as we show in the following chapters, among the many metrics used to quantify scientific excellence, productivity is the least predictive. The reason is simple: While great scientists tend to be very productive, not all scientists who are productive make long-lasting contributions. In fact, most of them do not. Multiple paths can lead to achieving high productivity. For example, lab technicians in certain fields may find their names on more than a hundred – or sometimes as many as a thousand – papers. Hence, they appear to be exceptionally prolific based on their publication counts, but are rarely credited as the intellectual owner of the research. The way people publish is also changing [Reference Broad20]. Coauthorship is on the rise, as are multiple publications on the same data. There have also been more discussions about LPUs, which stands for least publishable unit [Reference Broad20] or the “salami publishing” approach, which could further contribute to inflated productivity counts.
So, if productivity is not the defining factor of a successful career, what is?
Our ability to accurately track individual productivity relies on our skill to identify the individual(s) who wrote a paper and all other work that belongs to that individual [Reference Smalheiser and Torvik21, Reference Ferreira, Gonçalves and Laender22]. This seemingly simple task represents a major unsolved problem [Reference Smalheiser and Torvik21–Reference Torvik, Weeber and Swanson23], limited by four challenges. First, a single individual may appear in print under multiple names because of orthographic and spelling variants, misspellings, name changes due to marriage, religious conversion, gender reassignment, or the use of pen names. Second, some common names can be shared by multiple individuals. Third, the necessary metadata is often incomplete or missing. This includes cases where publishers and bibliographic databases failed to record authors’ first names, their geographical locations, or other identifying information. Fourth, an increasing percentage of papers is not only multi-authored, but also represents multidisciplinary and multi-institutional efforts. In such cases, disambiguating some of the authors does not necessarily help assign the remaining authors.
While multiple efforts are underway to solve the name disambiguation problem, we need to be somewhat mindful about the results presented in this and following chapters, as some conclusions may be affected by the limitations in disambiguation. In general, it is easier to disambiguate productive scientists, who have a long track record of papers, compared with those who have authored only a few publications. Therefore, many studies focus on highly productive scientists with unusually long careers instead of “normal” scientists.


