The sharp increase in elite polarization has been called “the central puzzle of modern American politics” (Poole 2004).Footnote 1 Increasingly, scholars hold that polarization is asymmetric, with “the movement of the Republican Party to the right account[ing] for most” of polarization (McCarty Reference McCarty, Hopkins and Sides2015).Footnote 2 For example, Ahler and Broockman (forthcoming) find that in the years 2008–2016, Democratic members of the US House voted with the majority of their constituents 69% of the time on roll calls about which the Cooperative Congressional Election Study (CCES), whereas Republican members did so only 52% of the time, barely more often than would be expected by chance. Similarly, Hall (Reference Hall2015, Table A.4) finds that Republican candidates often take positions more extreme than would be electorally optimal, while Democrats do so far less often. Scholars have worked to understand how politicians’ congruence with public opinion can break down from many perspectives (Achen and Bartels Reference Achen and Bartels2016; Bawn et al. Reference Bawn, Cohen, Karol, Masket, Noel and Zaller2012; Gilens Reference Gilens2012), but existing theories still struggle to explain such one-sided biases.
In this article, we argue that politicians can misperceive constituency opinion dramatically and systematically enough to contribute to significant, one-sided biases in representation such as asymmetric polarization. Existing evidence establishes that politicians want to be congruent with constituency opinion, as they change their behavior when they learn more about it (Bergan Reference Bergan2009; Butler and Nickerson Reference Butler and Nickerson2011). This evidence is consistent with canonical theories that politicians seek to represent the median voter (e.g., Downs Reference Downs1957) and empirical findings demonstrating politicians’ strong responsiveness to public opinion (e.g., Erikson, MacKuen, and Stimson Reference Erikson, MacKuen and Stimson2002; Erikson Reference Erikson2013). However, classic theories of representation argue that politicians’ information environments can leave them imperfectly informed about the median voter’s preferences: “the constituency that a representative reacts to is the constituency that he or she sees” (Fenno Reference Fenno1977, 883), but “The Representative knows his constituents mostly from dealing with people who do write letters [and] who will attend meetings” (Miller and Stokes Reference Miller and Stokes1963, see also Butler and Dynes Reference Butler and Dynes2016; Miler Reference Miler2010). Extending these theories, we argue that biases in politicians’ information environments common across politicians can lead politicians as a whole to systematically misperceive constituency opinion and, in turn, to contribute to systemic breakdowns in dyadic representation like asymmetric polarization.
We demonstrate our argument in the context of the contemporary United States, where conditions for bias in politicians’ perceptions of constituency opinion appear ripe. Over the past few decades, and especially since the mid-2000s, actors on the political right built the capacity to “rapidly mobilize large numbers” of conservative citizens to participate in the public spheres representatives monitor (Blee and Creasap Reference Blee and Creasap2010) by organizing intense conservative issue publics, coordinating with talk radio programs, and more (Goss Reference Goss2008; Fang Reference Fang2013). During the Obama presidency, these forces and “thermostatic” (Wlezien Reference Wlezien1995) reactions pushed right-wing activism to new heights (Skocpol and Williamson Reference Skocpol and Williamson2011; Skocpol and Hertel-Fernandez Reference Skocpol and Hertel-Fernandez2016). For example, while voter turnout for conservatives and liberals differs only slightly,Footnote 3 conservatives have recently been significantly more likely to participate in the public sphere in other ways, such as by contacting their legislators or attending town hall meetings. These differences are not small: For example, in the 2008 Cooperative Congressional Election Study, Republican citizens were 39% more likely than Democrats to indicate they had contacted their US House member’s office to express their opinion, differences that persisted in 2012 but were not evident in previous decades (see Table A1). The explicit goal of much of conservatives’ participation in the public sphere is to shape how politicians perceive the public’s demands (e.g., MacGuffie Reference MacGuffie2009).
In contexts like these, can politicians indeed systematically misperceive constituency opinion on salient issues? To shed light on this question, we gathered one of the most extensive documentations of elite perceptions of constituency opinion ever compiled. This original survey evidence spans two years and 3,765 surveys of American politicians, across which we collected 11,803 elite perceptions of constituency opinion in total. Our main evidence comes from a survey we conducted in 2014 of 1,858 state legislative politicians. We chose to study state legislative politicians because of evidence that the same dynamics of asymmetric polarization persist at the state level and by the variation in contexts available in the states. Further, motivated by evidence that polarization is partly a function of newly elected candidates taking more extreme positions than their predecessors (Theriault Reference Theriault2006), we surveyed both incumbents and candidates. We measured these officeholders’ and candidates’ perceptions of public opinion in their districts across seven issues in total. We then compared these politicians’ perceptions of opinion in their constituencies to estimates of actual opinion there, which we computed using Cooperative Congressional Election Study data, to examine whether their politicians’ perceptions were significantly or systematically distorted. We also present data from a study we conducted in 2012.
Our evidence reveals that, on average, American politicians from both parties in 2012 and 2014 believed that support for conservative positions on these issues in their constituencies was much higher than it actually was. These misperceptions are large, pervasive, and robust: Politicians’ right-skewed misperceptions exceed 20 percentage points on issues such as gun control—where these misperceptions are the largest—and persist in states at every level of legislative professionalism, among both candidates and sitting officeholders, among politicians in very competitive districts, and when we compare politicians’ perceptions to voters’ opinions only. That Democratic politicians also overestimate constituency conservatism suggests these misperceptions cannot be attributed to motivated reasoning or social desirability bias alone.
Why are US politicians’ perceptions of constituency opinion systematically skewed to the right? We present additional evidence that suggests a potential mechanism consistent with politicians’ information environments playing a role (Miller and Stokes Reference Miller and Stokes1963). Not only are Republican citizens more likely to voice their views to politicians in general, but we show that Republican citizens are especially likely to express their views to politicians who are fellow Republicans. This means that whereas Democratic politicians hear from Republican constituents somewhat disproportionately, Republican politicians appear to hear from Republican constituents very disproportionately. Consistent with this mechanism, we show that much (although not all) of the conservative misperceptions we found are driven by Republican politicians. Online Appendix H finds suggestive evidence that the strength of the partisan imbalance in contact from constituents also correlates with the extent to which politicians overestimate conservatism. We also find in Online Appendix I that in earlier eras when there was less asymmetry in partisan participation, politicians did not appear to exhibit the same asymmetric misperceptions. Although direct contact with legislators is just one of many asymmetries in citizens’ public engagement that could skew politicians’ perceptions of constituency opinion, these patterns suggest that direct contact and the other participatory behaviors it proxies for may play an important role.
Consistent with our theoretical argument, these biases in politicians’ perceptions of constituency opinion are pervasive enough and considerable enough in magnitude to plausibly contribute to a phenomenon like asymmetric polarization. For example, we find that even in districts where majorities of constituents favor same-sex marriage, Republican politicians in these districts perceive their constituents as opposed to same-sex marriage by three to one on average. Such misperceptions may help explain the puzzle of why so many politicians remain opposed to same-sex marriage even when their constituents favor it (Krimmel, Lax, and Phillips Reference Krimmel, Lax and Phillips2016).
In concluding, we discuss several additional empirical predictions of our theory that are confirmed in other evidence. However, our argument readily allows that US politicians’ misperceptions of constituency opinion could change in magnitude or even in direction—such as in response to protest in the wake of the Trump presidency—and that such changes would have important implications. We also discuss several broader implications of our argument and directions for future research. In terms of immediate implications for theories of democratic responsiveness, our findings present a mixed verdict. On the one hand, we find very strong responsiveness of politicians’ perceptions of constituents’ opinions to that opinion (Erikson, MacKuen, and Stimson Reference Erikson, MacKuen and Stimson2002). The correlations between public opinion and politicians’ perceptions of it we find are strong. However, this robust responsiveness belies often large gaps in congruence between opinion and perceptions (Achen Reference Achen1978): Politicians’ perceptions are offset by an “intercept shift” that leads them to often misperceive majority will.Footnote 4 This is consistent with a more nuanced understanding of the relationship between public opinion and public policy (Lax and Phillips Reference Lax and Phillips2012). Future research can and should further explore what gives rise to politicians’ misperceptions of public opinion, what determines variation in them, and what consequences they have.
THEORETICAL PERSPECTIVES
Politicians’ positions and the policies they make are clearly responsive to public opinion (e.g., Erikson, MacKuen, and Stimson Reference Erikson, MacKuen and Stimson2002; Erikson Reference Erikson2013; Tausanovitch and Warshaw Reference Tausanovitch and Warshaw2014; Caughey and Warshaw forthcoming), but they are not perfectly congruent with it (e.g., Lax and Phillips Reference Lax and Phillips2012). For example, the United States has recently witnessed a sharp increase in asymmetric polarization, wherein Republican politicians take positions that are more extreme than their Democratic counterparts on many issues (see Online Appendix B for review). What contributes to major biases in democratic representation like this? Existing explanations for phenomena such as asymmetric polarization largely focus on reasons why politicians might have electoral incentives to diverge from the preferences of the median voter (McCarty, Poole, and Rosenthal Reference McCarty, Poole and Rosenthal2006; Hacker and Pierson Reference Hacker and Pierson2005). These explanations are compelling but may offer incomplete explanations in some cases. For example, evidence indicates that Republican politicians are even more polarized than would be electorally optimal (Hall Reference Hall2015; Hall and Snyder Reference Hall and Snyder2015; Jacobson Reference Jacobson2013).
Classic theories of representation suggest another hypothesis: that politicians may not accurately perceive what their constituents want. These theories argue that although politicians prefer to remain in step with prevailing constituency opinion, they have incomplete information about it and so must rely on imperfect cues (Arnold Reference Arnold1990; Fenno Reference Fenno1977; Kingdon Reference Kingdon1967; Miller and Stokes Reference Miller and Stokes1963), which they cognitively process with classic behavioral biases (Butler and Dynes Reference Butler and Dynes2016; Miler Reference Miler2010). Consistent with these theories, field experiments show that even a few dozen calls from constituents or one poll about constituency opinion can change how legislators vote (Bergan Reference Bergan2009; Bergan and Cole Reference Bergan and Cole2015; Butler and Nickerson Reference Butler and Nickerson2011). Evidence from natural experiments, elite survey experiments, elite interviews, and descriptive data supports these same conclusions.Footnote 5
In this article, we extend these theories to consider their potential consequences for aggregate representation. In particular, we argue that systematic biases in politicians’ information environments common across politicians could generate significant widespread biases in their perceptions of their geographic constituencies.Footnote 6
Influential arguments hold that even if politicians do misperceive constituency opinion, such errors will be generally random and cancel out among the collective (Weissberg Reference Weissberg1978). However, we argue that the forces that bias politicians’ perceptions of public opinion can be common across many politicians, leading politicians as a whole to hold systematic misperceptions of their constituents. For example, if certain kinds of individuals are more likely to express their views in the public spheres politicians monitor, then these individuals’ viewpoints may loom disproportionately large in many politicians’ minds as they think about what their geographic constituency wants.Footnote 7 If the same kinds of individuals are more active, vocal, and intense across districts, then political elites may systematically misperceive public opinion in similar ways, leading to significant biases in aggregate representation like asymmetric polarization.
Over the past several decades, and from the mid-2000s in particular, the conditions for just this kind of systematic bias in politicians’ perceptions have been ripe in American politics. During this time, conservative actors have focused on cultivating active issue publics on the right and building the infrastructure to mobilize them to participate in the public sphere (Blee and Creasap Reference Blee and Creasap2010). A number of scholars have noted that this organized base of conservative groups and voters have tailored their strategies to influence how politicians perceive their constituents’ demands (Goss Reference Goss2008; Hacker and Pierson Reference Hacker and Pierson2005, Reference Hacker and Pierson2015; Skocpol and Williamson Reference Skocpol and Williamson2011; Skocpol and Hertel-Fernandez Reference Skocpol and Hertel-Fernandez2016). For example, intending to create the impression that legislators’ constituencies were strongly opposed to Barack Obama’s legislative proposals in 2009, organizations affiliated with the Tea Party famously surrounded politicians with conservative constituents voicing strenuous opposition at town halls.Footnote 8
The famous “Tea Party Town Hall Strategy” is just one manifestation of a broader strategy conservative groups and voters have pursued to convince politicians that their constituencies favor conservative policies. For example, journalistic accounts detail how conservative advocacy groups, talk radio hosts, and donors have developed networks and organizations that ensure conservative citizens regularly make politicians hear their voices at town halls, by phone, and otherwise (Fang Reference Fang2013). Such activity has been in a renaissance on the political right, buoyed in part by a backlash to waves of left-leaning policymaking (such as during the Obama era) and conservative national donors’ rising incomes (Blee and Creasap Reference Blee and Creasap2010). Meanwhile, its left-wing equivalents have atrophied, with unions in decline (Goss Reference Goss2008; Hacker and Pierson Reference Hacker and Pierson2005; Skocpol and Williamson Reference Skocpol and Williamson2011).
Theoretically, our argument predicts that these nationwide efforts to make politicians “feel the heat” from conservative constituents since the mid-2000s could have pushed politicians’ collective perceptions of their geographic constituencies to the right and their positions to the right in turn. This would likely exacerbate asymmetric polarization by slowing Democrats’ leftward moves and hastening Republicans’ rightward trajectory.
With this said, it is by no means obvious that such activity would actually bias politicians’ perceptions of public opinion pervasively and dramatically enough to contribute to these significant biases in representation. Politicians may well appreciate that the people who call their offices, attend town hall meetings, write letters to the editor, and so on, are unrepresentative.
Unfortunately, despite the central role of politicians’ perceptions of public opinion in canonical and contemporary theories, few data on them exist today. Querying politicians’ perceptions of opinion was an active area of empirical research in American politics in the 1960s and 1970s,Footnote 9 but these classic studies had very small sample sizes, and few recent studies have engaged these questions.Footnote 10 Much has changed since the 1960s and 1970s, however, including dramatic changes to how politicians communicate with and hear from their constituents.
In this article, motivated by the theoretical puzzle of why representation can sometimes break down, we present the results of an extensive data collection effort we undertook to shed new light on what contemporary American politicians believe about public opinion among their constituents. To do so, we leverage technological changes since studies like Miller and Stokes (Reference Miller and Stokes1963) to examine how politicians perceive their constituents with greater precision and across more issues than was previously possible. We measure these perceptions in the context of state politics, where asymmetric polarization generally persists (Shor Reference Shor, Thurber and Yoshinaka2015) but where variation gives us leverage to test alternative explanations and secondary hypotheses.
DATA: THE 2014 NATIONAL CANDIDATE STUDY
To measure state politicians’ perceptions of public opinion, we conducted the 2014 National Candidate Study (NCS), an original combined online and mail survey of sitting state legislators and candidates running for state legislature. The survey was fielded in October 2014.
To build the sampling frame of candidates running for state legislature and sitting state legislators running for reelection, we obtained their names and contact information from Project Vote Smart, which maintains a comprehensive database of candidates for office nationwide, and invited all candidates by both mail and email if possible.Footnote 11 For the responses, 1,803 candidates respondedFootnote 12 for an overall response rate of 20.8%, substantially higher than most elite surveys and surveys of the general public. Of the respondents, 950 won their general election and took seats in state legislatures in 2015, and 685 already held office. Importantly, the NCS was designed to minimize the chance of staff responding to the survey instead of politicians themselves.Footnote 13
We also conducted a similar survey in 2012, described in Online Appendix C, which we discuss later in the article to establish the generalizability of our results across election types and issue areas.
Representativeness
The politicians who responded to the 2014 NCS were broadly representative of the overall population of general election candidates for state legislative offices. Figure 1 plots the distributions of Obama’s share of the 2012 two-party vote in each politician’s district and Squire’s (Reference Squire2007) measure of state legislative professionalism, with separate density plots for the entire sampling frame of candidates for office and for just the politicians who responded to the NCS. The left column displays the distributions of districts with and without a Democratic respondent, while the right column displays the same for Republican respondents. There are no major differences that would suggest that our respondents from either party are unrepresentative of the broader population of state legislative districts. Online Appendix D provides additional representativeness assessments. There we find that Democrats and nonincumbents were slightly more likely to respond, and so later in the article we show the results separated by party and incumbency status. We do not find any differences between response rates for those who were running for upper or lower legislative chambers. There we also give the question wording for the questions we asked about candidates’ ideology and the number of polls they took.
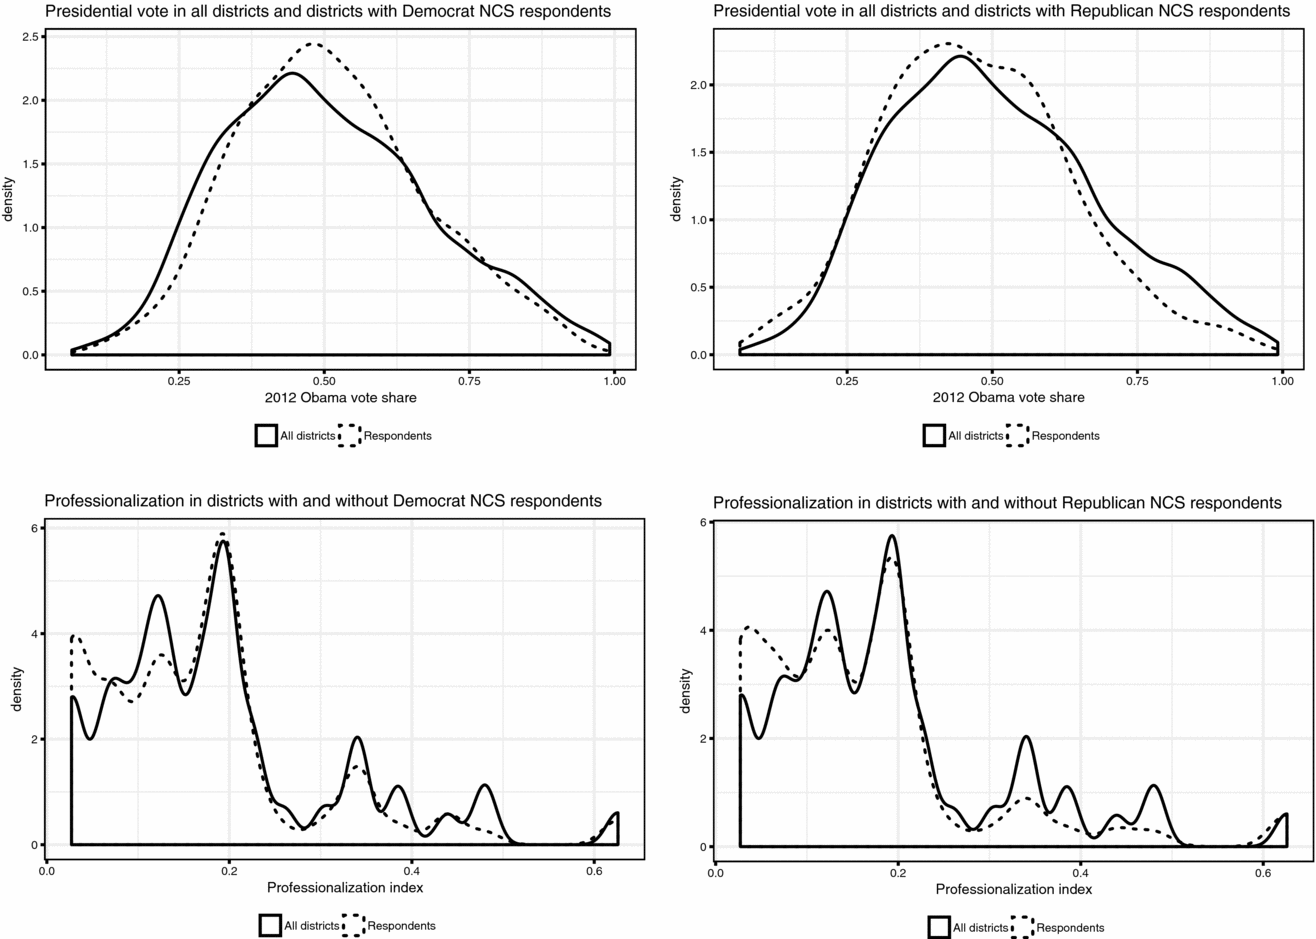
FIGURE 1. Representativeness of Politicians who Responded, by Party, Presidential Vote Share in the District, and State Legislative Professionalization.
Issues and Instrumentation
To compare elites’ perceptions to reasonably precise estimates of true public opinion, we asked them to estimate constituency opinion on items that were being contemporaneously asked in the 2014 CCES, a large sample survey (N = 56,200) (Ansolabehere and Schaffner Reference Ansolabehere and Schaffner2015). We were therefore constrained in the kinds of issues we could ask about, as the CCES only asked the full public sample about their opinions on a limited set of issues. However, the CCES had several issue items that corresponded well to debates that were highly publicly salient in states during this period, including debates over same-sex marriage, gun control, immigration,Footnote 14 and abortion. Most of these are relatively salient, “easy” issues where public opinion has remained relatively stable, so we expected politicians to be especially likely to have accurate estimates of them. (Later we present data from a pilot study in 2012 that has two economic issues.)
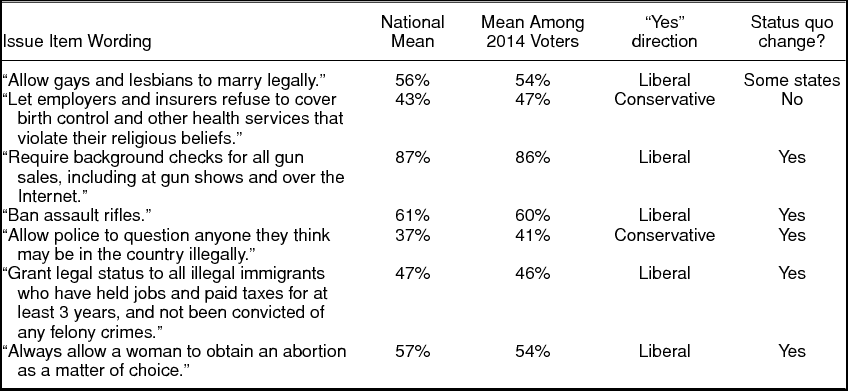
In Table 1, we report the specific CCES items we asked politicians to estimate. We also report the national level of support among opinion holders from the 2014 CCES, using the weights provided by the CCES and among voters the CCES validated to have ultimately voted in 2014. We also report whether a response of “Yes” to the issue question reflects a conservative or liberal preference and whether the issue question would reflect a change in the status quo at the national level. As Table 1 indicates, the issue questions we chose vary along these dimensions. This was a deliberate choice: We wanted a mix of popular, unpopular, and controversial policy statements to avoid ceiling or floor effects in politicians’ estimates of opinion. We did not always want a “Yes” response to the survey question to represent a particular ideological direction, nor did we want all of the questions to represent a status quo change. We were, however, constrained to issues covered in the common content of the CCES, the only publicly available survey with a sample size large enough for our purpose.Footnote 15 Online Appendix E shows that the national means on the CCES to these items are similar to the national means for similar items on other surveys, suggesting representativeness issues with the CCES are unlikely to have spuriously generated our main findings.Footnote 16
TABLE 1. Issue Questions from the 2014 National Candidate Study, with Weighted National Levels of Support from the CCES.
Following Warshaw and Rodden (Reference Warshaw and Rodden2012), CCES respondents are matched to state legislative districts using their zip code and their race. Nearly all respondents are matched to districts with certainty, although to avoid biases from dropping respondents, we conduct a full join and weight observations based on the certainty with which they are matched.Footnote 17
To examine politicians’ beliefs about the districts in which they were running, the NCS asked each politician to estimate, “What percent of the people living in your district would agree with the following statements?” before providing a subsample of the items in Table 1 with essentially the exact same wordings that appeared on the 2014 CCES.Footnote 18 We chose this wording to measure political elites’ perceptions of their geographic constituency’s opinion, because it most closely maps to the theoretical puzzle that motivated our study, asymmetric polarization, which makes important observations about median constituency opinion. In addition, it is possible to objectively measure the correct answer to this question.Footnote 19
POLITICIANS’ PERCEPTIONS OF CONSTITUENCY OPINION
We use two empirical strategies to examine the accuracy of politicians’ perceptions of their districts. Our first strategy is to estimate a grand (weighted) mean of opinion across all districts where politicians responded and compare this to the mean of their perceptions. Our second strategy is to compute estimates of opinion in each district using MRP. Neither of these approaches rely on us having completely accurate estimates of of public opinion in any particular district; rather, we rely on average differences across districts. Moreover, although each of these approaches entails differing assumptions, they ultimately yield highly similar conclusions.
Empirical Strategy 1: Raw Data
For our first approach, we compare the average of politicians’ perceptions across all the districts where politicians responded to the CCES estimate of public opinion across all the districts where politicians responded. Our estimation strategy is as follows. Let C represent the set of all CCES respondents who live in districts where a politician responded to our survey, with CCES respondents indexed by c and issues by i. Denote opinions expressed on issue i by CCES respondent c as o c, i. All the CCES questions we use are binary choice, such that o c, i ∈ {0, 1}. Let p c, i represent the perception of the politician in c’s district of average support for issue i; that is, p c, i is a politician’s estimate of E(o c, i) for their district. The average of p c, i − o c, i within each district thus represents an estimate of politicians’ average overestimation of support for policy i. For example, suppose a politician perceives support for a policy in their district at 80% but true support is only 60%. In this example, E(p c, i − o c, i) = 0.8 − E(o c, i) = 0.8 − 0.6 = 0.2. To estimate politicians’ average overestimation of support for issue i, we estimate the mean of p c, i − o c, i across all the CCES respondents.Footnote 20 To incorporate the CCES sampling weights, we take the weighted mean of this quantity, multiplying by the CCES weights w c, which have mean one. In addition, because the CCES has many more respondents from larger districts than smaller districts, we weight these estimates inversely to district size so that politicians from large districts and small districts matter equally. In particular, we weight each CCES observation by ![]() $\frac{\bar{s_c}}{s_c}$, where s c is the size of each CCES respondents’ district in 2014 according to the US Census. This makes politicians the effective unit of analysis and counts politicians from small and large districts equally. Our results are similar regardless of the weighting approach we use, however.
$\frac{\bar{s_c}}{s_c}$, where s c is the size of each CCES respondents’ district in 2014 according to the US Census. This makes politicians the effective unit of analysis and counts politicians from small and large districts equally. Our results are similar regardless of the weighting approach we use, however.
Given this setup, politicians’ mean perception can be estimated with
 $$\begin{equation}
\widehat{\bar{p_{i}}} = {\displaystyle \frac{\displaystyle \sum _{c \in C} \left[p_{c,i}w_c * {\displaystyle \frac{\displaystyle \bar{s_c}}{\displaystyle s_c}} \right]}{\displaystyle n(C)}} \approx \bar{p_i},
\end{equation}$$
where n(C) is the number of CCES respondents. We can estimate public opinion in the average district—what politicians’ average perceptions would be if their perceptions were perfectly accurate—using
 $$\begin{equation}
\widehat{\bar{o_{c,i}}} = {\displaystyle \frac{\displaystyle \sum _{c \in C} \left[o_{c,i}w_c * {\displaystyle \frac{\displaystyle \bar{s_c}}{\displaystyle s_c}} \right]}{\displaystyle n(C)}}.
\end{equation}$$
This quantity can be interpreted as “the expectation of district opinion in the district of a politician who responded chosen at random.”
Ultimately, we seek to estimate ![]() $\bar{y_i}$, politicians’ average overestimation of district support for issue i:
$\bar{y_i}$, politicians’ average overestimation of district support for issue i:
 $$\begin{equation}
\widehat{\bar{y_i}} = {\displaystyle \frac{\displaystyle \sum _{c \in C} \left[(p_{c,i} - o_{c,i})w_c * {\displaystyle \frac{\displaystyle \bar{s_c}}{\displaystyle s_c}} \right]}{\displaystyle n(C)}}.
\end{equation}$$
The standard errors of our estimates of each of these quantities are cluster bootstrapped, with clustering at the district level for politicians and misperceptions and at the respondent level for public opinion.
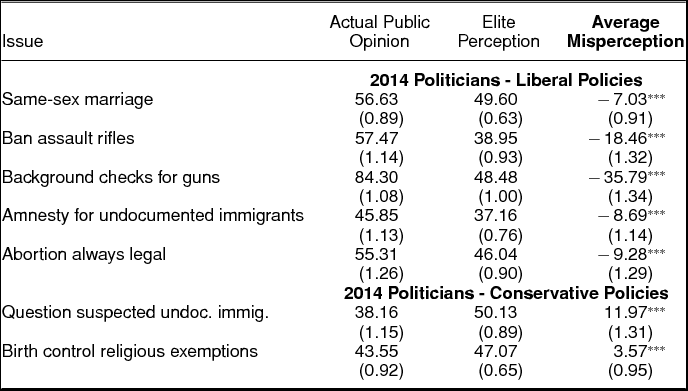
Figure 2 and Table 2 show the results of this approach. For example, when it comes to the issue of same-sex marriage, we estimate that 56.6% of residents of the “average district” supported same-sex marriage, whereas NCS respondents on average perceived their districts as 49.6% supportive, meaning they on average overestimated opposition to same-sex marriage by about seven percentage points. Elites likewise overestimate the percentage of the public that supports conservative policy positions across all the other policies. Politicians’ overestimation of conservatism is even larger on other issues, with a maximum of about 36 percentage points for the issue of background checks for guns—one of the issues where previous research indicates conservative constituents are the most well organized and likely to participate in the public sphere (Goss Reference Goss2008).
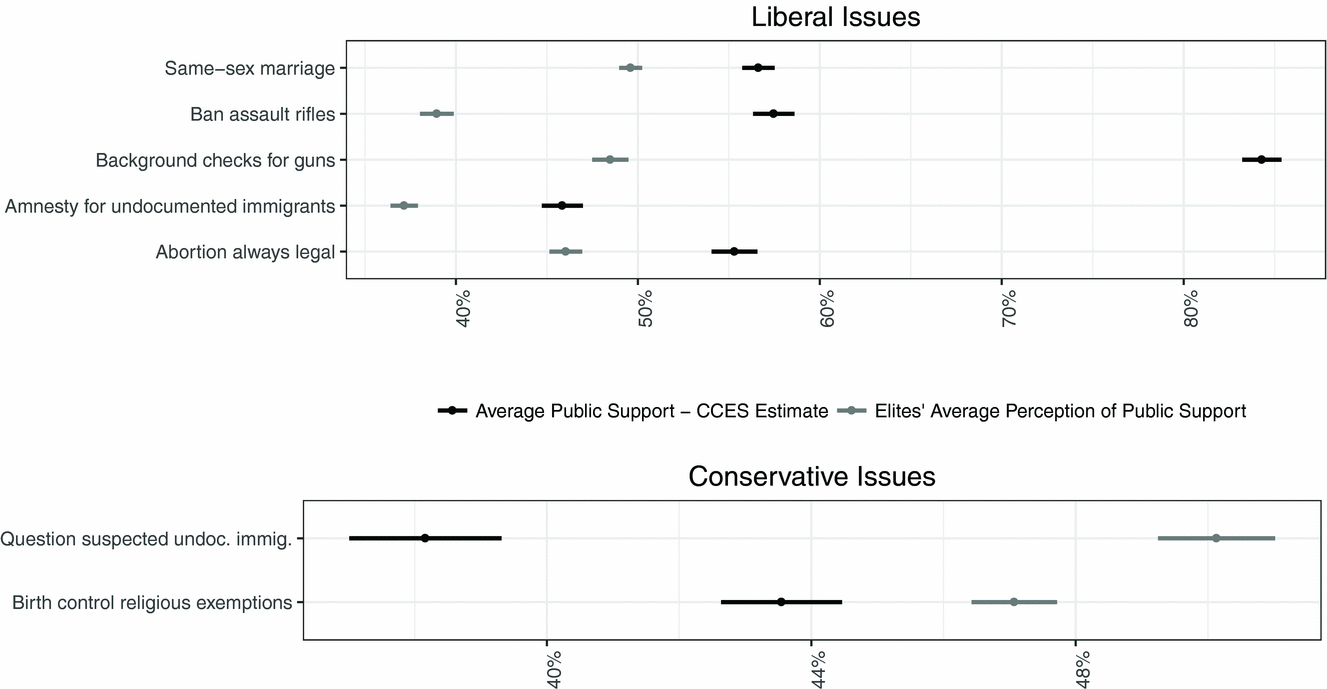
FIGURE 2. Politicians’ Perceptions of District Opinion and True District Opinion.
TABLE 2. Raw Data Estimates of Politicians’ Perceptions, True District Opinion, and Politicians’ Misperceptions.
*** = p < 0.001, ** = p < 0.01, * = p < 0.05.
Notes: Standard errors are cluster bootstrapped at the CCES respondent level for public opinion and at the district level for elite perceptions and for misperceptions.
Later in the article, we also conduct this analysis for only incumbents, for only candidates who won their elections, for only candidates in very close and competitive districts, and for only those who ran in states with professionalized legislatures. The results are unchanged, suggesting that these results are not an artifact of responses from unserious candidates who went on to lose.
Empirical Strategy 2: MRP
We gain additional inferential leverage on the relationship between politicians’ perceptions and true geographic constituency opinion by estimating support for each issue in all of the nation’s state legislative districts using multilevel regression and poststratification (MRP) (Eggers and Lauderdale Reference Eggers and Lauderdale2016; Hanretty, Lauderdale, and Vivyan Reference Hanretty, Lauderdale and Vivyan2016; Lax and Phillips Reference Lax and Phillips2009a, Reference Lax and Phillips2009b, Reference Lax and Phillips2012; Park, Gelman, and Bafumi Reference Park, Gelman and Bafumi2004; Warshaw and Rodden Reference Warshaw and Rodden2012). This facilitates more nuanced dyadic comparisons of politicians’ perceptions and estimates of opinion in their specific districts, in addition to illustrating the robustness of our results to any concerns with the raw data analysis. More details on our MRP procedure are in Online Appendix F. There we also present robustness checks and estimates of uncertainty. MRP uses individual-level survey data and demographic information about the districts from the US Census to construct district-level estimates of support for each issue. Our MRP procedure first fits multilevel choice models to the responses to each issue question from the 2014 CCES. Each model returns estimated effects for demographic and geographic predictors. We then use the estimates from the multilevel model to estimate support for various demographic cells, identified by age, race, education, gender, and district. Finally, using data from the US Census’ American Community Survey, we weight those cells by their frequency in each district. The result is an estimate of the percentage of each district supporting each issue. We then matched these estimates for each district with politicians’ perceptions of that district.
Figure 3 shows the result. Each panel of Figure 3 shows the results for one issue. In each panel, we show how politicians’ perceptions of public opinion on that issue vary as a function of the MRP estimate of true public opinion on that issue in their district. The y-axis in each panel represents politicians’ estimates of support in their districts and the x-axis shows the MRP estimates of public opinion in these same districts. Each point on the graph represents one politician’s response. The striated bands of responses reflect that politicians usually answered in increments of five percentage points. Loess smoothers summarize the average of politicians’ perceptions in each district as a function of the MRP estimate of district support. The straight black line represents the function y = x, where politicians would have answered on average were they perfectly accurate.Footnote 21 For simplicity, we organize the figures by first presenting questions where higher values of support reflect a liberal position and then questions where higher values of support reflect a conservative position.
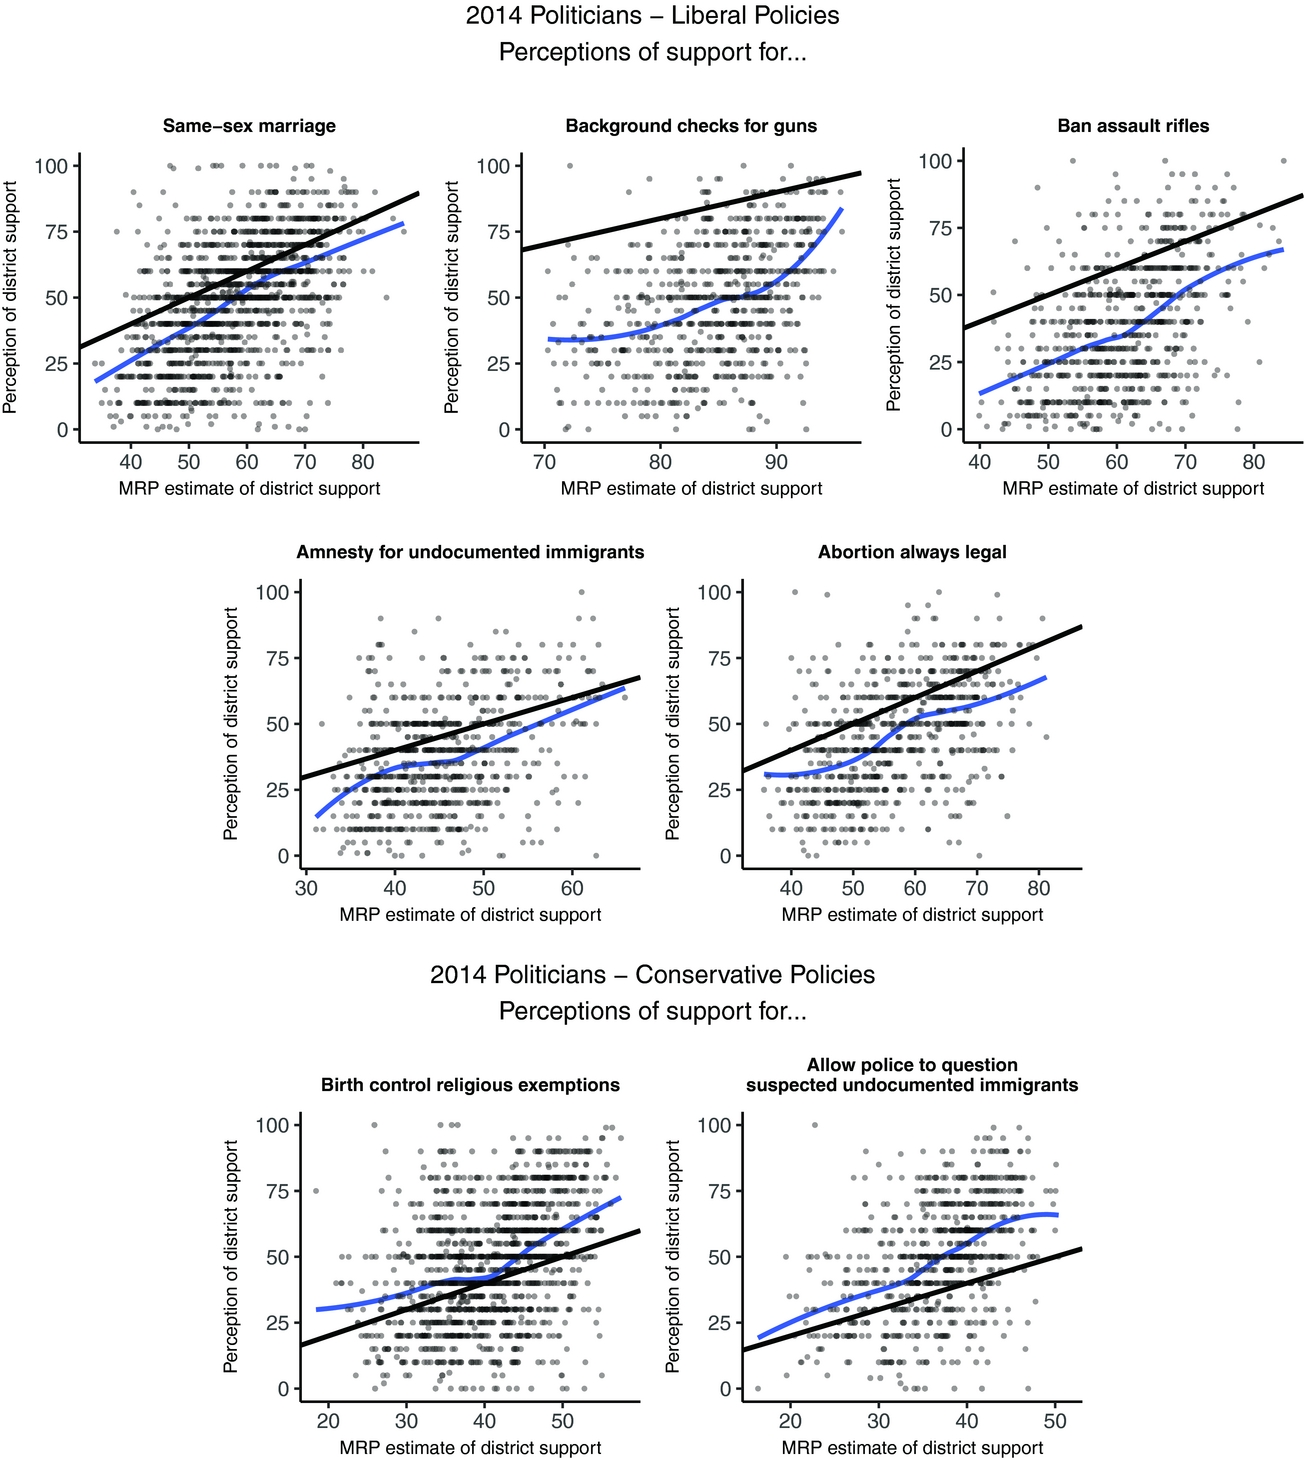
FIGURE 3. Politicians’ Perceptions of District Opinion as a Function of MRP Estimates of District Opinion.
Figure 3 illustrates the nuanced nature of our findings for democratic responsiveness. On the one hand, politicians are strongly responsive to public opinion, in the sense that there is a strong and strikingly linear relationship between our estimates of reality and their perceptions.Footnote 22 Yet there is a substantial “intercept shift” in every panel in Figure 3, such that politicians substantially overestimate support for conservative positions and underestimate support for liberal ones. Such misperceptions are unlikely to disappear in aggregate, unlike simple random errors in individual politicians’ perceptions would (Weissberg Reference Weissberg1978).
The magnitude of these shifts corresponds well with the point estimates from the raw data approach. As before, these elites are especially inaccurate on the gun control policies, which command broad support across districts. Indeed, we estimate that banning assault rifles has majority support in almost all districts and that support for background checks is over 70% in all districts, despite the fact that most politicians perceive the public as fairly evenly divided or even opposed to these measures. Appendix F.3 also presents 95% confidence intervals for the size of politicians’ errors and their overestimation of conservatism as calculated on the basis of the MRP estimates; these intervals are similar in width to the 95% confidence intervals of the raw data estimates.
Robustness across Election Types and Issues: Pilot Study in 2012
We next present data from a pilot study we conducted in 2012 that speaks to the robustness of our findings in two ways: It included data on two additional economic issues and was conducted in a presidential election year. Further information on this sample is in Online Appendix C.Footnote 23
In this 2012 pilot study, we asked candidates running for state legislature to estimate district support for three issues in their districts: same-sex marriage, universal healthcare, and abolishing all federal welfare programs. Table A3 presents question wording and weighted national support for these three issues.
Our measures of public opinion on these issues come from different years of the CCES, determined by question availability. This introduces two main weaknesses, we hasten to note. First, the closest healthcare question on the CCES was four years old and not an exact wording match, a question on the 2008 CCES that also included the phrase “even if it means raising taxes.”Footnote 24 Second, the question about all federal welfare programs only appeared on a (random) subsample of the CCES and only two years prior, in 2010.
Encouragingly, for the robustness of the conclusions in the main data, we see similar patterns in the 2012 pilot data. In particular, Figure A1 and Table 3 show candidates’ average perceptions of public opinion on these three issues and the CCES estimates of public support in the “average district.” We consistently find that they overestimate support for conservative positions by between 11 and 22 percentage points. For example, on the question of whether to abolish all federal welfare programs—an extreme conservative policy that very few Americans favor—support in the average district is approximately 9%, but politicians perceive it to be many times that, at almost 32%.Footnote 25
TABLE 3. Raw Data Estimates of Politicians’ Perceptions, True District Opinion, and Politicians’ Misperceptions, 2012 Pilot Study.

*** = p < 0.001, ** = p < 0.01, * = p < 0.05.
Notes: Standard errors are cluster bootstrapped at the CCES respondent level for public opinion and at the district level for elite perceptions and for misperceptions.
Robustness across Legislators, States, and Voters
The conservative biases we uncovered in politicians’ perceptions of public opinion are robust across statistical methods, weighting approaches, states, districts, years, issues, and reference populations.
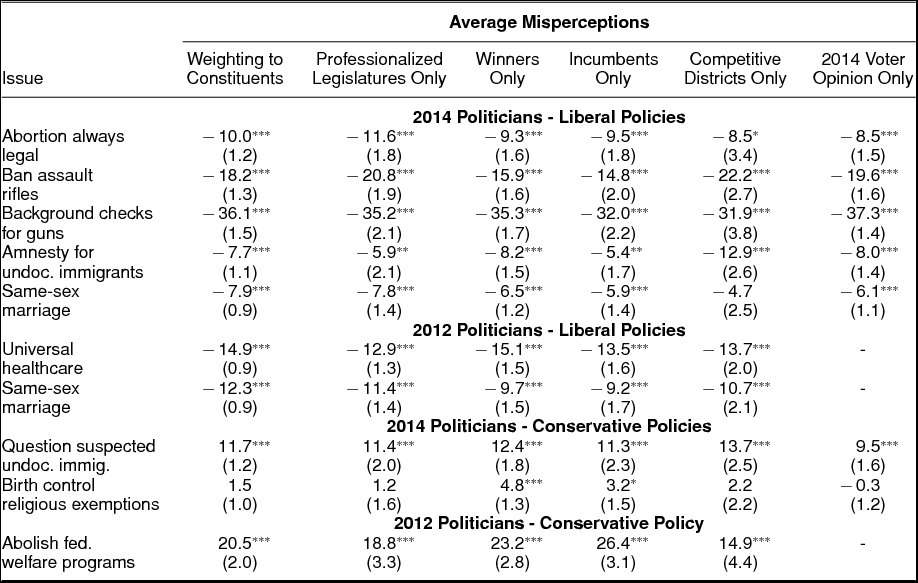
First, the results we presented above effectively used politicians as the unit of analysis, weighting the misperceptions of those in small districts with few constituents just as much as those with hundreds of thousands of constituents, like California State Senators. This raises the possibility that our findings are driven by politicians who represent small districts. Column 1 of Table 4 shows that the main misperception results remain the same when the data are reweighted in the opposite manner, such that all CCES respondents are weighted equally but politicians who represent larger districts are weighted higher.
TABLE 4. Robustness of Misperceptions across Subsamples and Approaches.
*** = p < 0.001, ** = p < 0.01, * = p < 0.05.
Other robustness checks are similarly encouraging. The next column of Table 4 shows the results when we subset to states with highly professionalized legislatures only, as measured by the Squire (Reference Squire2007) index of state legislative professionalism.Footnote 26 The results look similar for the state politicians whose campaigns and offices look much more similar to highly professionalized bodies. Although whether our findings would generalize to Members of Congress is an open question, this finding is provisionally encouraging. The next two columns of Table 4 show that the results also remain unchanged when we examine only politicians who won (e.g., for the 2014 data, those who were in office as of 2015) and when we examine incumbents only (e.g., for the 2014 data, those who were in office in 2014 and seeking reelection).
The next-to-last column of Table 4 shows that the results also hold when we subset to only the very most competitive districts in the sample using a stringent inclusion criteria: where Obama vote share was between 45% and 55% in 2012. The standard errors increase because this is a smaller subsample, but the point estimates remain similar.
In the last column of Table 4, we show that the results also hold when we compute public opinion among CCES respondents who administrative records show voted in the 2014 election and compare politicians’ perceptions of their districts to these voters’ opinion. We still find similar overall results.
PARTISAN ASYMMETRIES IN ELITE MISPERCEPTIONS AND MASS ACTIVISM
When we examine the patterns of misperceptions by politicians’ party, it is clear that Republican politicians drive the bulk of the conservative-leaning misperceptions we found. Figure 4 and Table 5 show that Republican politicians and Democratic politicians both overestimate their constituents’ conservatism, but that Republican politicians do so to a much greater extent. Democrats and Republicans both overestimate their constituents’ conservatism on every single issue, with the one exception that Democrats very slightly underestimate support for the conservative birth control religious exemptions policy. Republicans overestimate support for the conservative position on every issue by over ten percentage points and often by over 20 percentage points. Republicans also overestimate conservatism more than Democrats on every issue, often by over ten percentage points.
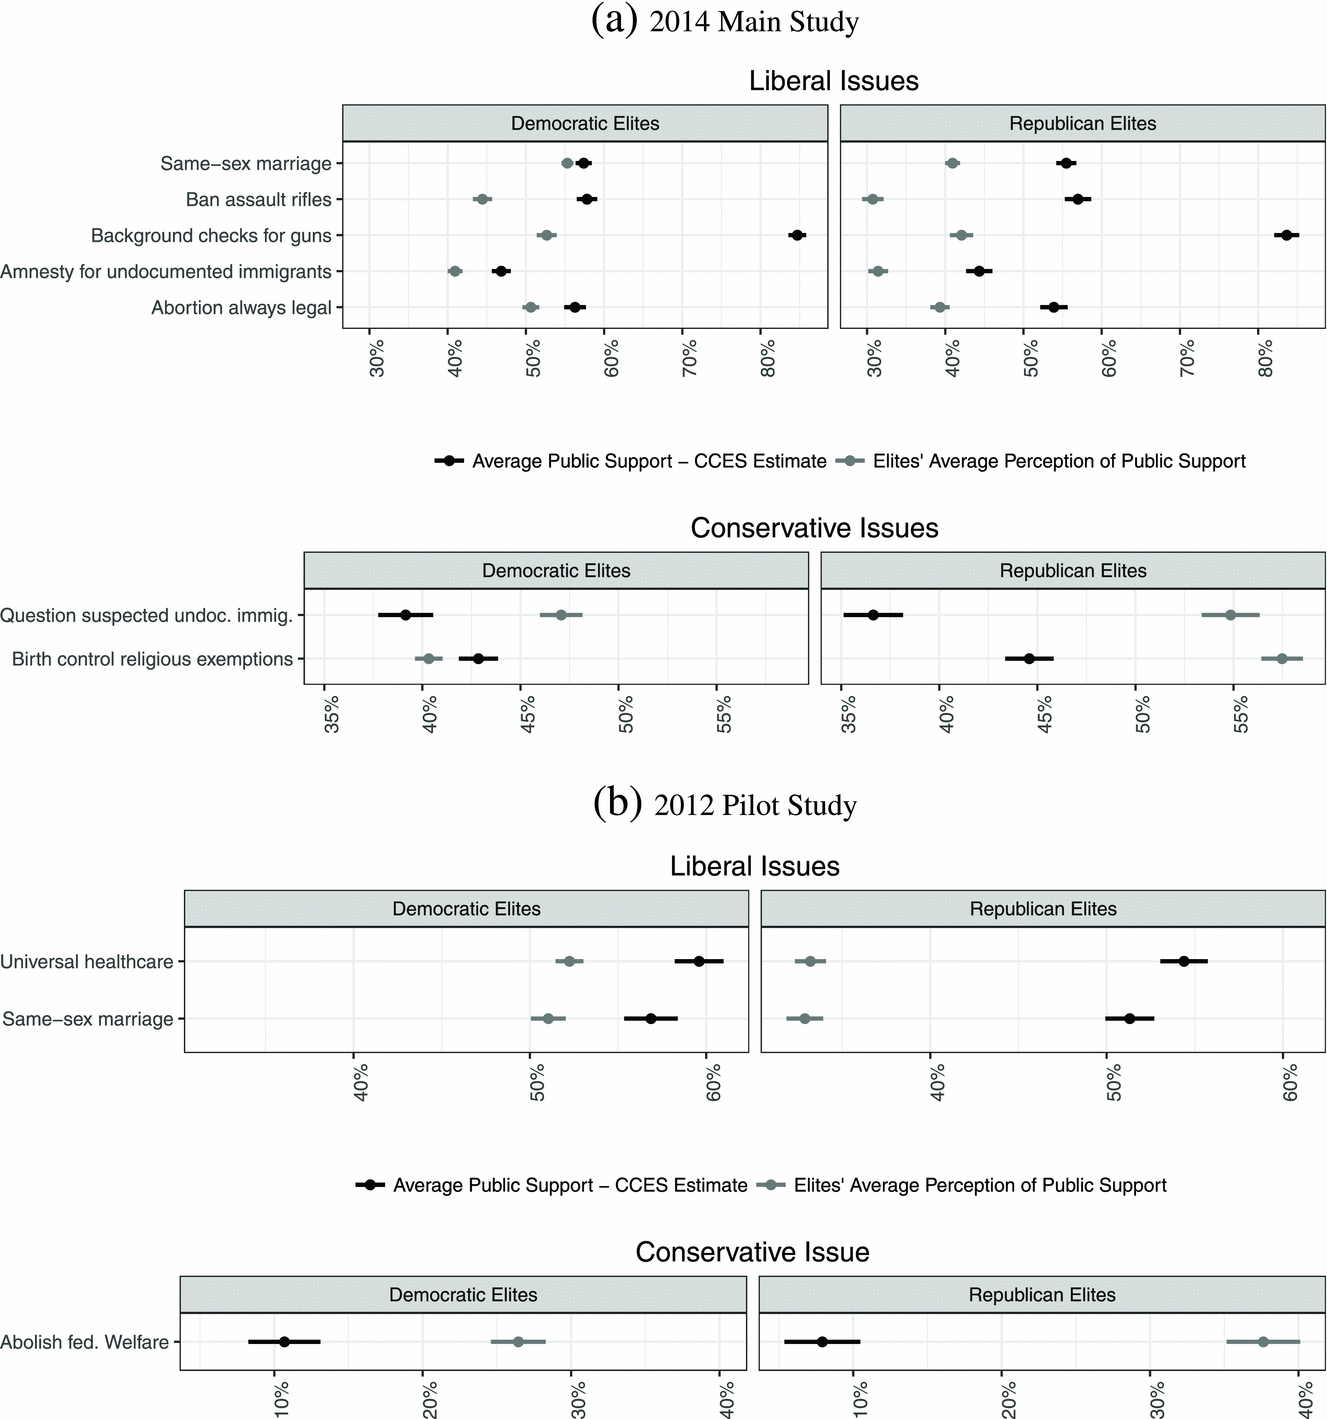
FIGURE 4. Partisan Differences in Misperceptions: Raw Data.
TABLE 5. Partisan Differences in Misperceptions: Raw Data.
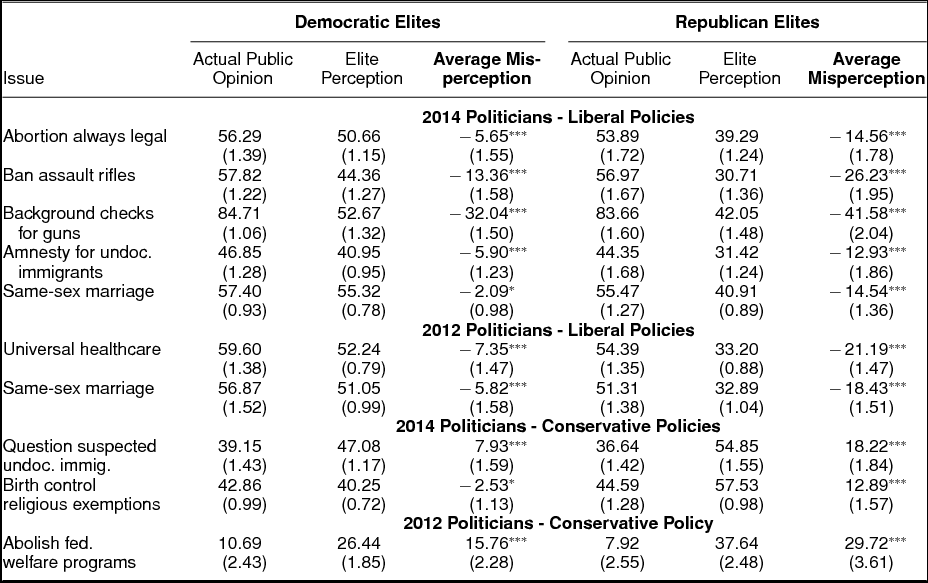
*** = p < 0.001, ** = p < 0.01, * = p < 0.05.
These differences are especially stark when examining the relationship between district opinion and politicians’ perceptions visually with the aid of MRP. Figure 5 shows a version of Figure 3 with the results split by politicians’ party. For example, on the issue of same-sex marriage, constituency support must be at roughly 55% before the majority of Democratic candidates believe their constituencies barely favor same-sex marriage. Republicans, on the other hand, almost never believe their constituents favor same-sex marriage; district support must be above 70% before they think their constituents are barely in favor. Likewise, in districts where the public is evenly split on same-sex marriage, the average Republican believes the public is opposed by nearly three to one. Such patterns seem likely to help explain the puzzle of why so many Republican politicians remain opposed to same-sex marriage even though their constituents favor it (e.g., Krimmel, Lax, and Phillips Reference Krimmel, Lax and Phillips2016); Republicans do not appear to realize this is the case. Intriguingly, even though the correlation between public opinion and perception of this opinion is similar for Republicans and Democrats, Republicans’ greater “intercept shift” means that they misperceive public opinion far more.
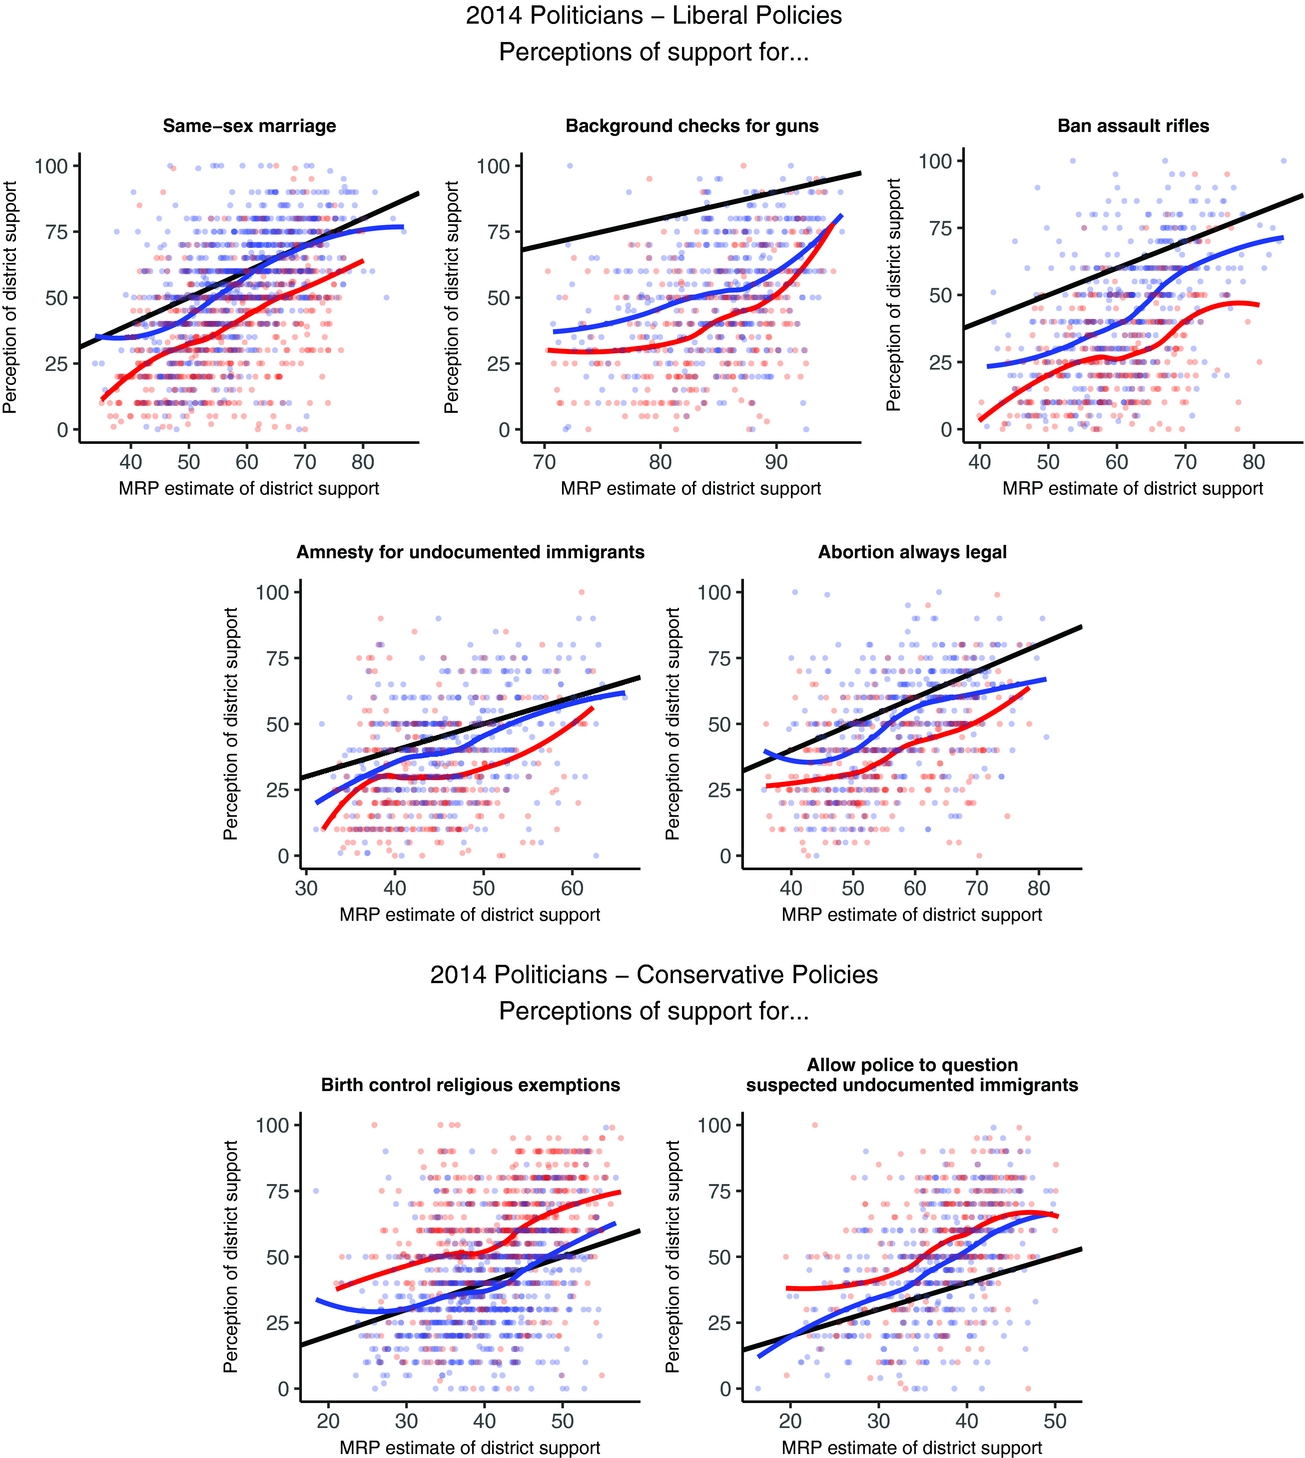
FIGURE 5. Partisan Differences in Misperceptions: MRP.
With this said, Figure 5 also rules out two simple alternative explanations for our findings. First, we can rule out the possibility that politicians simply will not admit to us that they are on the wrong side of the median voter. In fact, on essentially every issue, we see that substantial numbers of politicians indicated to us that they believed their party’s position (which is nearly always their own) is the minority position in the district—even in many cases where we are confident the majority of voters actually do share their party’s view. Second, Democratic politicians also overestimate constituency conservatism, which suggests these misperceptions cannot be attributed to motivated reasoning or social desirability bias alone.
As with our previous results, these partisan differences in misperceptions are robust when we examine incumbents only, winners only, and weight to voters. The first two columns of Table 6 show that they are also robust in professionalized legislatures only. The next two columns show that they also remain similar in the subset of very competitive districts where Obama received between 45% and 55% of the two-party vote in 2012. This is a smaller subset of districts, and so the standard errors increase, but the point estimates remain similar.
TABLE 6. Robustness of Partisan Difference in Misperceptions
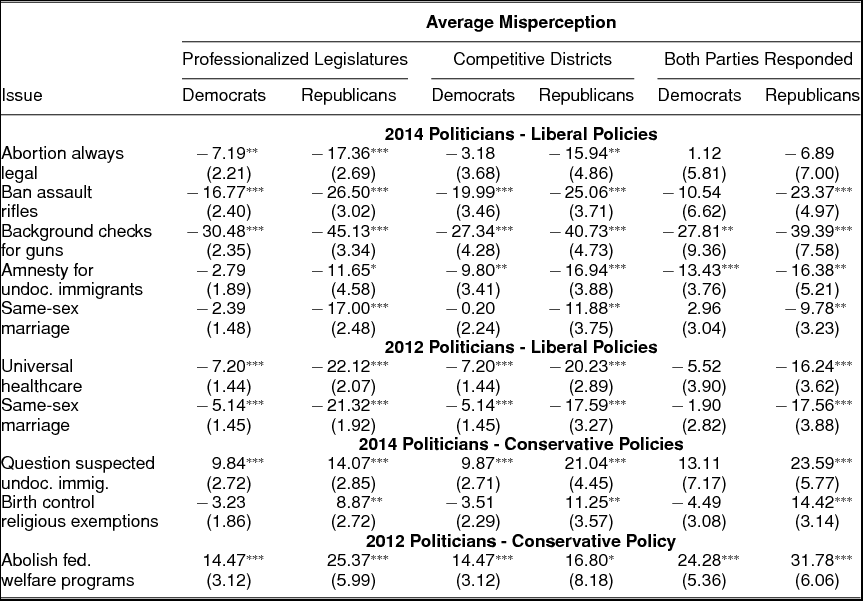
The final two columns of Table 6 present a result that bears special note: that the same partisan difference in misperceptions also holds in just the subset of districts where we received responses from both the Democratic and Republican candidate in a district. The standard errors are much larger because this was a rare occurrence, but this allows us to hold constant public opinion and show that Democrats and Republicans see the same constituents differently. This means we can confidently reject the alternative explanation that politicians perceive opinion accurately but that our estimates or inherent flaws in public opinion data in general (or the CCES in particular) are responsible for introducing bias; if two politicians perceive the same district differently, then they cannot both be right. Moreover, given the similar marginal distributions on the same issues on national polls as on the CCES presented in Online Appendix E, it is highly likely that Democrats’ perceptions are more accurate.
Do Omitted Variables Drive Partisan Differences in Perceptions of Public Opinion?
Are the partisan differences in the magnitude of politicians’ misperceptions driven by omitted variables that correlate with party rather than representing true partisan differences in how Democrats and Republcians see their districts? As a reminder, the last columns of Table 6 showed that our findings held when we compared pairs of politicians providing their perceptions of the same districts, holding constant any confounders related to districts. With that said, there may be other confounders related to individuals. To examine these possibilities, we use a multivariate regression to estimate the relationship between the accuracy of politicians’ perceptions of public opinion using party and several covariates based on other survey items from the NCS that might be related to the accuracy of their perceptions. The outcome variable is specified as the politicians’ mean absolute error or the mean of the difference between their perceptions and the MRP estimates. The results are summarized in Figure 6, in which all variables are scaled to standard deviation one for comparability and higher values for the coefficients reflect more error in perceptions.
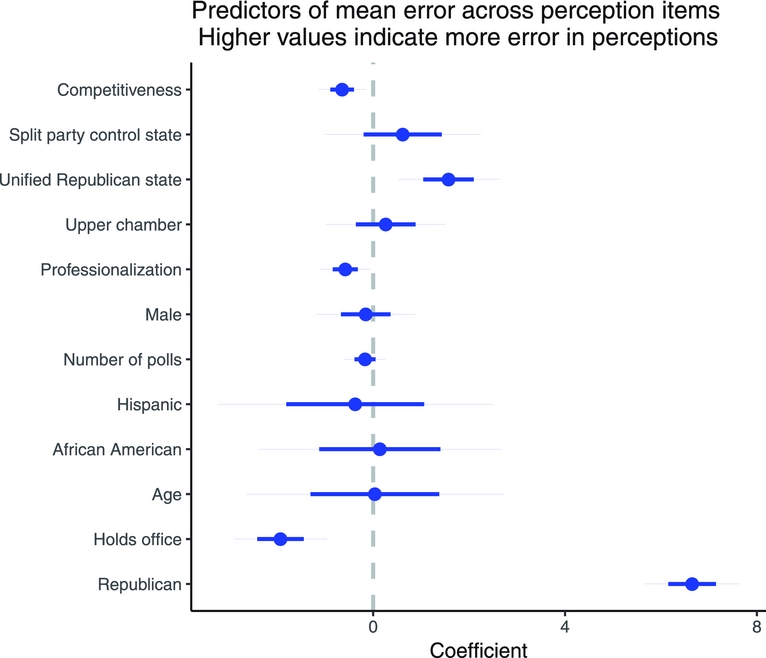
FIGURE 6. Predictors of Errors in Perceptions
We find that errors in perceptions differ in predictable ways, but that by far the largest determinant of misperceptions is that Republicans make much larger errors than Democrats do. Other patterns include that politicians who already held office in 2014 and politicians in competitive elections both have slightly more accurate perceptions.Footnote 27 Somewhat surprisingly, politicians who report taking more polls were not significantly less error prone.Footnote 28 The partisan difference remains robust in the presence of these covariates and remains clearly the largest estimate. For example, Republicans’ greater inaccuracy is ten times larger than the average effect of being in a district one full standard deviation more competitive.
Online Appendix F.3 also presents 95% credible intervals for the size of politicians’ errors and their overestimation of conservatism by party; these intervals are similar in width to the 95% confidence intervals of the raw data estimates above.
Potential Mechanism: Partisan Asymmetries in Contact and Activism
What accounts for this partisan asymmetry in misperceptions? As we have discussed, one potential explanation for both parties’ misperceptions is that politicians’ information environments are not representative of their districts (Fenno Reference Fenno1977; Miller and Stokes Reference Miller and Stokes1963). The citizens who legislators and candidates meet are clearly not a representative sample: politicians may more frequently come in contact with constituents who seek out contact with them, those constituents who are identified as persuadable voters, and citizens who are more engaged in their communities.
What kind of citizens do politicians tend to come into contact with? As a proxy for the variety of experiences politicians have where they may ascertain public opinion from who participates in the public sphere, we examine who reaches out to politicians to express their views. Data on contacting state-level politicians are rare, but some surveys have asked citizens about their patterns of contacting Members of Congress. Consistent with other recent work on activism since the mid-2000s (Goss Reference Goss2008; Schlozman, Verba, and Brady Reference Schlozman, Verba and Brady2012; Skocpol and Williamson Reference Skocpol and Williamson2011), these surveys reveal an important asymmetry: Republican citizens are more likely to indicate they have contacted their representatives than Democratic citizens are. In the 2012 American National Election Studies (ANES), Republicans were 28% more likely to say they had contacted their representatives than Democrats, and in the 2008 CCES Republicans were 39% more likely to have said they contacted their representatives than Democrats.Footnote 29 Taking these results at face value, even politicians in districts evenly divided across partisan lines would hear disproportionately often from Republican constituents.Footnote 30 For example, contacting behavior among gun owners could help explain why politicians’ perceptions on that issue are especially skewed: gun owners are nearly twice as likely to contact elected officials than the general public, whereas gun owners who are members of the NRA are nearly four times as likely to do so.Footnote 31
Not only are Republican citizens more likely to contact their representatives in general, but also, as a descriptive matter, Republican citizens reach out to Republican politicians especially often. Table 7a shows that, in districts represented by a Democratic Member of Congress (MC), Republicans in the 2008 CCES were about 9% more likely to contact their MC than Democrats. However, in districts with a Republican MC, Republicans were a full 41% more likely to contact their MC than Democrats.Footnote 32 Together, Republican citizens’ higher probability of contacting politicians in general and their especially high likelihood of contacting fellow Republicans suggest two consequences: Democratic politicians should hear from Republican constituents slightly disproportionately and Republican politicians should hear from Republican constituents highly disproportionately. Table 7b illustrates this idea. The first row shows that if every citizen had contacted their US House member, the CCES indicates Democratic US House members would receive 36% of their contacts from Republicans while Republican US House members would receive 50% of their contacts from Republicans; 36% of individuals who live in districts a Democrat represents are Republicans and 50% of individuals who live in districts a Republican represents are Republicans. However, the contacting behavior we actually observe is skewed towards Republican constituents. A full 40% of the CCES respondents in Democratic districts who said they contacted their legislator were Republicans versus 36% in the district at large, indicating a 12% overrepresentation of Republicans among those who contact Democratic legislators. This disparity is even larger for Republican legislators; 62% of the CCES respondents who said they contacted their legislators were Republicans, even though only 50% of these legislators’ districts are Republicans on average, a 22% overrepresentation.
TABLE 7. Democratic Politicians Hear from Republican Citizens Somewhat Disproportionately, but Republican Politicians Hear from Republican Citizens Especially Disproportionately.
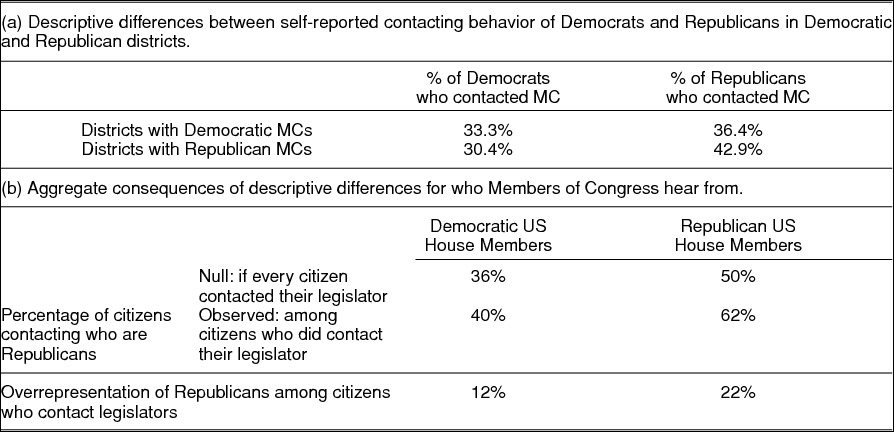
Source: Author’s analysis, 2008 CCES.
These patterns suggest a potential mechanism for the partisan asymmetry in conservative misperceptions of public opinion we found in 2012 and 2014: the partisan asymmetry during these years in who reaches out to which politicians. If these patterns were to generalize and politicians were to heavily rely on who contacts them when forming their perceptions of public opinion (Miller and Stokes Reference Miller and Stokes1963), then the patterns in Table 7 alone would generate the exact patterns of perceptions and misperceptions we found.
The Online Appendix presents additional tests of empirical implications of this mechanism that provide further suggestive support for it. In Table A1, we find that this partisan difference in contacting did not appear in comparable surveys in previous decades, and Online Appendix I shows that the patterns of misperceptions we found do not appear in data on elites’ perceptions of public opinion others gathered in 1958, 1992, and 2000—although these earlier studies have significant limitations. Although these historical data are more difficult to interpret, it is reassuring that in historical periods when this mechanism did not appear to operate, its potential consequences do not appear present.Footnote 33 In addition, Online Appendix H shows suggestive evidence that in districts and in states where we estimate that the Republican-leaning partisan imbalance in self-reported contacting of legislators is greater, we find that politicians’ overestimation of conservatism is also greater.Footnote 34
With this said, as with all studies of causal mechanisms, this evidence must be regarded as tentative. First, to be clear, our claim is not that contacts to legislative or campaign offices alone likely explain all of politicians’ biased perceptions of public opinion. Rather, we see these questions about contacting behavior as diagnostic of the broader set of activities intended to shape politicians’ information environments. Unfortunately, we are not aware of any data on who contacts or otherwise interacts with state legislative politicians, and so we cannot test this argument at the individual level for our elite respondents to examine whether those respondents whose constituencies display this tendency to a greater extent also have the greatest misperceptions. This would represent an ambitious data gathering exercise, and we would urge future research to conduct it. At the very least, our research suggests the discipline’s surveys should include these questions more regularly. With that said, these patterns are consistent with our broader theory that contemporary American politicians—especially Republicans—work in information environments where conservative views are overrepresented.
DISCUSSION
On a broad set of controversial issues in contemporary American politics, US state political elites in 2012 and 2014 believed that much more of the public in their constituencies preferred conservative policies than actually did. This pattern was present in two surveys of state legislators and candidates. Elites’ partisanship was by far the most important determinant for the (in)accuracy of their perceptions: Republicans were prone to severely overestimating support for conservative positions. Democrats’ perceptions also typically overestimated the public’s support for conservative positions, although by less, suggesting our findings cannot be attributed to motivated reasoning by Republicans alone. These findings suggest that misperceptions of public opinion may be an important dynamic that contributes to dynamics such as asymmetric polarization, pushing Republicans to the right and discouraging Democrats from making a similarly strong move leftward.
Theoretically, we argued that the presence of such large, systematic biases in politicians’ perceptions of their geographic constituencies were possible and could contribute to significant biases in democratic representation. Several further testable implications of our argument also find support in our data and others’. First, one implication of our argument is that relatively simple informational interventions would lead to legislative outcomes that are more congruent with public opinion. Indeed, in an ingenious experiment, Butler and Nickerson (Reference Butler and Nickerson2011) find that providing legislators with information about public opinion in their districts causes them to cast more votes that are congruent with their district’s median voter. Further field experiments of this type are a natural next step for testing our theory. Our distinctive claim that politicians’ errors need not be symmetric and random would predict, at least in 2012 and 2014, that treatment effects in such experiments among Republicans in the US should be especially large—exactly as Butler and Nickerson (Reference Butler and Nickerson2011) find. Further consistent with this expectation, although the observational nature of our data prohibits us from drawing firm causal conclusions, we also find that the politicians with the most severe overestimation of conservatism told us they took the most extremely conservative positions (see Table A2). A final testable implication of our empirical findings about the contemporary US are that Republican politicians should be more likely to ideologically “overreach,” facing larger penalties in general elections for being more extreme, as we expect they are more likely to misperceive the median voter’s preferences and thus be more distant from the median to begin with.Footnote 35 In a recent article, Hall (Reference Hall2015) finds exactly this heterogeneity in the effects of additional ideological extremism by party (see Hall Reference Hall2015, Table A.4).
Hall’s (Reference Hall2015) result also suggests our findings about partisan differences are unlikely to be driven entirely by Republican politicians having private information about “real” opinion not reflected in public opinion surveys, as it appears Republicans are losing votes for taking the increasingly conservative positions they are. Our finding that Democrats and Republicans perceive the same districts differently further reinforces this point; if two politicians perceive the same district differently, then they cannot both be right. With this said, electoral incentives are clearly more complex than the simple median voter theorem would imply. More generally, as with any single study, we do not pretend that ours can definitively explain a complex phenomenon like asymmetric polarization in its totality. Rather, our evidence joins other work that tests predictions of significant theories of polarization (e.g., Grossmann and Hopkins Reference Grossmann and Hopkins2016; Noel Reference Noel2012; Thomsen Reference Thomsen2014), which can comfortably coexist with and complement our own.
Our findings should open up new research agendas with the potential to deepen our understanding of democratic representation and competition in a variety of ways. For example, our findings that politicians misperceive public opinion could also prove relevant to understanding why politicians appear differentially responsive to different groups within the public. Considerable evidence suggests that American lawmakers are differentially responsive to different groups in the population, including to those high in income (Bartels Reference Bartels2008; Gilens Reference Gilens2012; Gilens and Page Reference Gilens and Page2014; Lax, Phillips, and Zelizer Reference Lax, Phillips and Zelizer2017), copartisans, and primary voters (Hill Reference Hill2017; Kastellec et al. Reference Kastellec, Lax, Malecki and Phillips2015). Politicians behave as if these subconstituencies and other issue publics exist (Fenno Reference Fenno1977), and a natural next step for future research would be to measure how politicians perceive the size and composition of such groups. To what extent do legislators consciously respond only to certain parts of their constituencies, or to what extent do they try to represent everyone equally but perceive their district in a biased way?Footnote 36 Future work can and should build on ours to answer these questions, which recent advances in estimation of public opinion among subconstituencies should facilitate (Caughey and Warshaw Reference Caughey and Warshaw2015; Kastellec et al. Reference Kastellec, Lax, Malecki and Phillips2015; Lax, Phillips, and Zelizer Reference Lax, Phillips and Zelizer2017). Future work should also expand the number and type of issues examined, especially to consider more economic issues. It should also seek to query these perceptions at the Congressional level, if possible. Members of Congress may well be different due to their differing resources and incentives. Although the presence of asymmetric misperceptions in state legislatures with high professionalism is encouraging, data on Congresspeople themselves would clearly be welcome.
More broadly, reviving a once-widespread interest in how politicians perceive public opinion, our results should also open up a research agenda into better understanding what gives rise to these misperceptions. One possibility our data suggest is that these misperceptions originate from patterns of mass participation in the public sphere; consistent with this, Online Appendix H shows suggestive evidence that politicians overestimated conservatism the most in districts where Republicans were especially likely to contact legislators. However, other dynamics may reinforce these misperceptions as well. For example, party activists are not equally polarized in both parties: Republican party activists harbor more consistently conservative views than do Democratic activists harbor consistently liberal views (Grossmann and Hopkins Reference Grossmann and Hopkins2015, Reference Grossmann and Hopkins2016; Layman et al. Reference Layman, Carsey, Green, Herrera and Cooperman2010; Lelkes and Sniderman Reference Lelkes and Sniderman2016). If politicians look to copartisans to form their perceptions of their districts, then Republican politicians are thus likely to come in contact with an especially polarized group of voters relative to Democrats, potentially distorting Republicans’ views of public opinion more generally. Another possibility future research could address is whether politicians more accurately perceive the public at the level of symbolic instead of operational ideology (Grossmann and Hopkins Reference Grossmann and Hopkins2016). It also remains to be seen whether “thermostatic” (Wlezien Reference Wlezien1995) responses to unified Republican government under Donald Trump will shift patterns in public participation in a manner that might shift politicians’ perceptions of the public, especially on issues where liberals are most vocal—a possibility we readily allow and that could provide additional tests of our theory that mass participation influences politicians’ perceptions. We do not expect that the conservative bias we observed in 2012 and 2014 to be a permanent feature of politics (and indeed we show in Online Appendix I that these same misperceptions do not appear to have been present in earlier eras, when, potentially relatedly, Democratic and Republican citizens contacted politicians at similar rates; see Table A1).
This article should also encourage research that seeks to understand the consequences of these misperceptions. Table A2 shows, unsurprisingly, that even within party politicians who misperceive the public as more conservative by a greater amount are also more conservative in their positions. However, the direction of causality here is obviously unclear. With this said, it is clear how our findings may contribute to a phenomenon like asymmetric polarization, which has produced patterns like one Ahler and Broockman (forthcoming) document: On average, Democratic politicians are much more likely to vote congruently with constituent opinion than are Republicans. How these misperceptions will influence policy outcomes is less clear, as politicians are embedded in institutions that constrain their behavior. For example, Hall (Reference Hall2015) finds that when Republican candidates for office take positions farther to the right, policy actually moves left as a consequence, because Democrats become so much more likely to win office instead. In some cases, it could even be that elites’ conservative misperceptions actually undermine conservative policy goals. Of course, these misperceptions may also contribute to the conservative bias that exists in state policymaking in some domains.Footnote 37
In terms of immediate implications for theories of democratic representation, our findings present a mixed verdict. On the one hand, we found very strong responsiveness of politicians’ perceptions of public opinion to the reality of that opinion (e.g., Erikson, MacKuen, and Stimson Reference Erikson, MacKuen and Stimson2002)—much stronger than Miller and Stokes (Reference Miller and Stokes1963). When comparing two districts with differing levels of support for a policy, it is usually the case that the politicians in the more supportive district perceive higher levels of district support than do politicians in the less supportive district.
At the same time, our findings vividly illustrate how this strong responsiveness to public opinion can belie imperfect congruence with it (Achen Reference Achen1978; Lax and Phillips Reference Lax and Phillips2012). Although the correlation between opinion and perception of opinion is strong, we found that it is frequently offset by an “intercept shift” that leads politicians to misperceive opinion across the board, sometimes dramatically. The result is that policies with majority support in a majority of districts are often seen as having that majority support by only a minority of legislators. These patterns of strong responsiveness yet imperfect congruence are consistent with a more nuanced understanding of how opinion translates into policy than the simple extremes that politicians care only about public opinion or care about it not at all (Lax and Phillips Reference Lax and Phillips2012).
With this said, to the extent our findings are relevant to understanding why politicians do not always represent their constituents perfectly, a degree of optimism seems warranted. Politicians’ incentives are difficult to change, but their information environments are demonstrably malleable (Bendor and Bullock Reference Bendor and Bullock2008; Butler and Nickerson Reference Butler and Nickerson2011). For example, field experiments find that even a few phone calls or emails from constituents can change legislators’ votes (Bergan Reference Bergan2009; Bergan and Cole Reference Bergan and Cole2015). This suggests that any biases in representation that may result from misperceptions of public opinion could be feasible to correct. Further observation of what happens when politicians are confronted with more reliable information on public opinion (e.g., Butler and Nickerson Reference Butler and Nickerson2011) could thus prove both substantively impactful and theoretically illuminating.
SUPPLEMENTARY MATERIAL
To view supplementary material for this article, please visit https://doi.org/10.1017/S0003055418000011. Replication materials can be found on Dataverse at: https://doi.org/10.7910/DVN/DQZXQB.


Comments
No Comments have been published for this article.