INTRODUCTION
Immigration is one of the most salient political issues in Europe (Geddes and Scholten Reference Geddes and Scholten2016). Questions about how many immigrants to admit, what kind of immigrants to admit, and how to integrate immigrants already in the country have been at the center of recent election campaigns across Europe (Clarke, Goodwin, and Whiteley Reference Clarke, Goodwin and Whiteley2017) and have implications for a wide range of policy concerns. For example, debates about security, violence, and counterterrorism measures are often linked to concerns about new arrivals (especially from Muslim-majority countries) (Bansak, Hainmueller, and Hangartner Reference Bansak, Hainmueller and Hangartner2016). In addition, there are longstanding economic debates about whether immigrants are a net benefit or cost to European economies, how best to match immigrants with domestic labor needs, and which domestic interests should be privileged when formulating immigration policy (Peters Reference Peters2017). Immigrants also bring cultural diversity that raises many questions about whether European societies should accommodate, assimilate, or suppress that cultural difference (Koopmans et al. Reference Koopmans, Statham, Giugni and Passy2005; Sniderman, Hagendoorn, and Prior Reference Sniderman, Hagendoorn and Prior2004).
One reason immigration debates are so difficult is that preferences are divided according to where Europeans live (Alba and Foner Reference Alba and Foner2017). Residents of large cities are generally more positive about immigration, more likely to believe that immigration inflows should continue or increase, and more likely to support liberal citizenship policies (Brownstein Reference Brownstein2016). Outside large cities—and especially in the countryside—people are more likely to view immigrants as threats who should be excluded from full membership in European nations. Rural residents are more likely to support immigration reductions, freezes, or restrictions that only permit immigration from neighboring ‘culturally compatible’ countries (Ford and Goodwin Reference Ford and Goodwin2014; Gest Reference Gest2016). The overlapping attitudinal and geographic divides could signal a deep fracture in European societies, making it difficult to find compromise.
Some argue that the geographic divide on immigration is one symptom of a larger value divide that is bifurcating European nations into urban and rural substates. Large cities are the home of Cosmopolitan Europe: where globalization is embraced, a knowledge-based service sector economy is thriving, the European Union is viewed as a source of prosperity and stability, and diverse immigrants are welcome (Andreotti, Le Galès, and Moreno-Fuentes Reference Andreotti, Le Galès and Moreno-Fuentes2015; Sennett Reference Sennett, Vertovec and Cohen2002). Outside the large cities—and especially in the countryside—is Nationalist Europe: where globalization is a threat, the agricultural and industrial economies are struggling, the European Union is viewed as the destructor of national identity, sovereignty, and culture, and immigrants are unwelcome (Guilluy Reference Guilluy2014; Jennings and Stoker Reference Jennings and Stoker2016).Footnote 1
The re-emergence of the urban–rural divide in Europe is particularly challenging because it cuts across left–right partisan divides.Footnote 2 In the new clash between Cosmopolitans and Nationalists, both sides draw support from across the left–right political spectrum. This makes it difficult for established parties to take decisive positions on issues such as immigration and opens space for new (populist) parties to capitalize (Kriesi Reference Kriesi2010). The 2017 French presidential election was a striking example of this trend, as neither of the final candidates was from an established centrist party and the campaign revolved around the urban cosmopolitan (Macron) versus the rural nationalist (Le Pen) perspective. This may be a new era of instability and realignment across Europe, as political systems adjust to geographic divides on issues such as immigration (Hooghe and Marks Reference Hooghe and Marks2018).
Yet, for all the analysis of the new political geography, there has been scant research on why people in large cities are more likely to have favorable opinions about immigrants and immigration. To answer this question, I draw on literature about geographic differences, which offers two potential explanations. One is contextual effects, which implies that something about the experience of living in big cities makes people more positive about immigrants. In particular, residents of large cities are more likely to live in high population density environments and have more exposure to immigrants, which may make them more likely to have positive immigration attitudes. Another possibility is compositional effects, which focuses on the types of people more likely to live in large cities as opposed to the countryside. Demographic composition may matter because people who are highly educated and professionals are more likely to live in large European cities and are more likely to have positive attitudes about immigration. In addition, cultural composition may matter because people with pro-immigration attitudes may be more likely to select into large cities with cultural environments that match their preferences.
To explore geographic divides in immigration attitudes, I analyze data from the European Social Survey (ESS), the Swiss Household Panel (SHP), and the German Socio-Economic Panel (SOEP). The results provide stronger support for compositional as opposed to contextual effects. ESS data from 13 West European countries highlight the importance of demographic composition. There is more variation in immigration attitudes across demographic characteristics within big cities than between big cities and the countryside. Longitudinal data from the SHP find no evidence of contextual effects on immigration attitudes, either from moving to big cities or from lifelong residence in different geographic contexts. Instead, SHP data offer evidence of both demographic and cultural compositional effects. Data from the SOEP indicate variation in immigration attitudes across neighborhoods within big cities. This could mean that contextual effects only exist in specific neighborhood environments where the pro-immigration culture is strongest. However, my results do not support this claim. Instead, neighborhood-level variation in immigration attitudes is consistent with the logic of compositional effects.
This article makes several contributions. First and foremost, my results suggest that geographic contexts are not the primary cause of the urban–rural divide over immigration. Instead, I highlight the selection mechanisms (demographic and cultural) that sort people with different immigration attitudes into urban and rural areas. This implies that geographic polarization may be a second-order manifestation of deeper (demographic and cultural) divides.
My analysis contributes to ongoing debates about the stability of political attitudes (Zaller Reference Zaller1992). Recent research highlights very specific circumstances under which geographic contexts can change attitudes (Harrison and Michelson Reference Harrison and Michelson2017; Laurence and Bentley Reference Laurence and Bentley2018; Mo and Conn Reference Mo and Conn2018). For immigration attitudes, van Heerden and Ruedin (Reference van Heerden and Ruedin2019) find that as the percentage of immigrants in the neighborhood increases over time, there are more positive attitudes about immigrants in the Netherlands. In addition, Lancee and Schaeffer (Reference Lancee, Schaeffer, Koopmans, Lancee and Schaeffer2015) find that moving to neighborhoods with greater ethnic heterogeneity causes more negative immigration attitudes in Germany. In this article, I find no evidence that urban contexts cause more positive immigration attitudes in Swiss cities or in German neighborhoods. Yet, my results do not necessarily contradict findings from earlier research. Instead, I add to the debate by suggesting that to the extent that geographic contexts can change attitudes, the dynamics are unlikely to be universal and are more likely to be contingent on very specific localized factors.
Finally, this article provides new insight on the Cosmopolitan–Nationalist polarization dividing Europe. My results are consistent with the conventional wisdom that there is a strong geographic component to this divide. In addition, if Cosmopolitans continue to cluster in big cities and Nationalists in rural areas, each creating their own worlds, then geographic contexts may develop greater causal power in the future. However, to understand the distinctiveness of contemporary large European cities, my results suggest that it is not the places which make the people but rather the people who make the places.
HYPOTHESES
There are two potential explanations for why immigration attitudes are more positive in large European cities. The first is contextual effects, which means that people who live in the same place should have common experiences that develop similar political attitudes. Existing work in this tradition has analyzed how different local economic and political contexts can shape voting behavior (Ethington and McDaniel Reference Ethington and McDaniel2007; Johnston and Pattie Reference Johnston and Pattie2006). In addition, recent work highlights how political institutions and cultural norms create local and national ‘discursive contexts’ that shape how people view politics and policy options (Cinalli and Giugni Reference Cinalli, Giugni, Morales and Giugni2011).Footnote 3 For the purposes of this article, two aspects of the urban context may be particularly important for causing positive immigration attitudes: population density and exposure to immigrants.
Large cities generally have higher levels of population density, which means more interactions in a wide range of shared spaces from the sidewalk to transportation to parks to the marketplace to public institutions such as museums or libraries (Huckfeldt Reference Huckfeldt1986). This process of being forced to share space may force urban residents to be more accepting and tolerant of cultural differences as a basic coping mechanism for dealing with daily life (Wessendorf Reference Wessendorf2014; Wood and Landry Reference Wood and Landry2008). One way this general tolerance may manifest is through more positive attitudes about immigration.
Large European cities are also distinctive because they tend to have larger immigrant populations than other areas (Garbaye Reference Garbaye2005). As a result, urban residents should be more likely than residents of other geographic areas to be exposed to immigrants on a regular basis. There is a longstanding debate about whether exposure to different groups promotes tolerance or threat, depending on the nature of the exposure (Allport Reference Allport1954; van Heerden and Ruedin Reference van Heerden and Ruedin2019; Kaufmann and Harris Reference Kaufmann and Harris2015). Some evidence suggests that exposure to different groups via competition over scarce resources (Dancygier Reference Dancygier2010; Quillian Reference Quillian1995), rapidly changing population demographics (Hopkins Reference Hopkins2010; Kaufmann Reference Kaufmann2017), or in dense and segregated environments (Enos Reference Enos2017) may promote a sense of threat and negative attitudes. However, any relationship between exposure to immigrants and threat is unlikely to explain urban–rural variation in immigration attitudes. There are more immigrants in large cities and immigration attitudes are more positive in large cities.Footnote 4 Instead, greater exposure to immigrants in large cities may promote more positive attitudes through interactions as equals, whether in intimate relationships, workplace environments, or even casual exposure in public space (McLaren Reference McLaren2003; Pettigrew and Tropp Reference Pettigrew and Tropp2006; Stolle et al. Reference Stolle, Petermann, Schmid, Schönwälder, Hewstone, Vertovec, Schmitt and Heywood2013). In short, large cities are distinctive because of their population density and size of the immigrant population, which may promote more positive attitudes toward immigrants.
H 1: Immigration attitudes are more positive in large cities because of the experience of living in large cities.
The logic of H 1 generates sub-hypotheses that distinguish between two types of urban residents: those who moved to large cities and those who spend their entire lives in large cities. If contextual effects shape the attitudes of movers, then attitudes should become more positive after moving to large cities, relative to people who do not move to large cities. This comparison accounts for the fact that attitudes may change over time for many reasons, but that geographic context effects can be isolated by comparing the attitudinal time trends of people who move and people who do not move (Lancee and Schaeffer Reference Lancee, Schaeffer, Koopmans, Lancee and Schaeffer2015). Contextual effects may also shape the attitudes of people who spend their entire lives in large cities through long-term political socialization that began early in life (Sapiro Reference Sapiro2004). If this is true, then immigration attitudes should be more positive among people who spend their entire lives in large cities than among people who spend their entire lives in other geographic contexts.
H 1a: Moving to large cities makes people more positive about immigration.
H 1b: Spending one’s entire life in a large city makes people more positive about immigration.
The logic of compositional effects starts from the premise that people are not randomly distributed across geographic contexts (Gallego et al. Reference Gallego, Buscha, Sturgis and Oberski2016; McAllister and Studlar Reference McAllister and Studlar1992). Instead, the selection process that sorts people into different geographic contexts may be correlated with immigration attitudes. There are demographic and cultural variants to this logic.
H 2: Immigration attitudes are more positive in large cities because of the types of people who are more likely to live in large cities.
The logic of demographic composition is that the expansion of highly skilled knowledge-economy jobs in large European cities means that residents of those large cities are increasingly likely to be highly educated and professionals. Less-educated and manual workers increasingly find large cities unaffordable and are more likely to settle in small towns and rural areas (Cunningham and Savage Reference Cunningham and Savage2017; Favell Reference Favell2008; Oberti and Préteceille Reference Oberti and Préteceille2016). Moreover, rural areas and small towns have suffered from declining agricultural and manufacturing sectors in recent years. As a result, the more mobile people in rural areas (e.g., the well-educated and the professionals) have incentives to move to large cities in search of opportunities (Castells Reference Castells1989; Sassen Reference Sassen2001). These demographic differences may account for the geographic variation in immigration attitudes because research suggests that people who are highly educated or professionals generally support immigration whereas people who have low levels of education or work in manual occupations are generally opposed to immigration (Cavaillé and Marshall Reference Cavaillé and Marshall2019; Hainmueller and Hopkins Reference Hainmueller and Hopkins2014; Lancee and Sarrasin Reference Lancee and Sarrasin2015).Footnote 5 Therefore, if relationships between demography and immigration attitudes are consistent regardless of geographic location, the geographic divide on immigration could reflect different distributions of demographic groups.
H 2a: Higher socioeconomic status individuals are more pro-immigration regardless of where they live.
A second perspective on compositional effects is that people sort into different geographic areas because of cultural considerations (Bishop Reference Bishop2008; Tam Cho, Gimpel, and Hui Reference Tam Cho, Gimpel and Hui2013). Large European cities are known for greater cultural diversity and openness to immigrants from around the world. Therefore, people who value multicultural environments and support immigration may be more attracted to large cities to be surrounded by like-minded people (Favell Reference Favell2008; Florida Reference Florida2005). Similarly, the distinctive multicultural environment may encourage people who are opposed to immigration to leave large cities. Therefore, urban–rural divides on immigration could reflect geographic sorting according to immigration preferences.
H 2b: People with pro-immigration preferences are more likely to move to large cities.
H 2c: People with anti-immigration preferences are more likely to move out of large cities.
DATA
I use three sources of data in this article. One is the European Social Survey (ESS), a cross-sectional biennial survey that began in 2002 and is conducted across a wide range of European countries. Most of the ESS questions are consistent across countries and across survey rounds, which makes it an excellent source of data to analyze broad attitudinal patterns in Europe. I use data from ESS rounds one (2002) through eight (2016), which was the most recent data available at the time of analysis.
I limit my analysis of the ESS to West European countries, where there have been roughly similar experiences surrounding the politics and contestation of global migration in recent decades. The dynamics of immigration in Central and Eastern Europe are radically different and largely involve population movements between neighboring countries because of wars and changing political boundaries. Therefore, it is not clear that survey question about immigration captures similar dynamics across regions. Table A.1 in the appendix lists the thirteen countries included in my sample, as well as the ESS waves for which there was available data. Not all ESS countries are included in each wave, so to maximize cross-national comparability I limit the analysis to countries with data for at least four of the eight waves and with at least 300 respondents in each geographic category (e.g., urban and rural). My ESS sample has between 1,500 and 3,000 respondents per country per wave, for a total sample size of 198,553 respondents. More details on the ESS are in Appendix A.
The second source of data is the Swiss Household Panel (SHP). Switzerland has a long history of immigration, dating back to labor migration to fuel industrial development in the late nineteenth and early twentieth centuries. In that respect, Switzerland is similar to Western European countries such as Britain, France, Germany, and the Netherlands. Appendix Figure D.1 uses ESS data to present the geographic divide on immigration across thirteen countries and Switzerland is roughly similar to other West European countries in the size of its urban–rural divide.
Panel data allow me to observe immigration attitudes as people move to and from different geographic locations. This is necessary for evaluating the contextual and compositional effects hypotheses and would not be possible with conventional cross-sectional analysis. There were 18 SHP waves available at the time of analysis (1999–2016), but I use 13 (1999–2009, 2011, and 2014) because these are the waves in which the question about attitudes toward immigrants was present in the survey. My SHP sample has 85,731 person-year observations (11,787 distinct individuals). More details are in Appendix A.
The third source of data is the German Socio-Economic Panel (SOEP). Germany also has a long history of receiving immigrants from various countries and is similar to the majority of the ESS sample as immigration attitudes are more positive in large cities and more negative in the countryside. The most distinctive feature of Germany’s urban landscape is a broader range of big cities in comparison to many other countries where one capital city is dominant. This could suggest that city-level contextual effects are less likely to exist in Germany because the difference between urban and rural areas is not as dramatic as in other countries.Footnote 6 However, I use German data for neighborhood-level analysis, and there is no reason to believe that contextual (or compositional) effects are more or less likely to exist at the neighborhood level in Germany as opposed to in other European countries.
The main benefit to using the SOEP is panel data at the neighborhood level, which allows me to investigate how attitudinal dynamics vary within big cities. SOEP has been conducted annually since 1984, with new respondents added periodically. I analyze SOEP data between 2006 and 2016 because these are the years for which neighborhood level data are available (under strict privacy conditions).Footnote 7 The neighborhood data in SOEP are constructed in partnership with MICROM, a consumer marketing firm.Footnote 8 MICROM defines neighborhood units that have an average of 450 households. This is sufficiently fine grained to capture diversity within cities but it is large enough to have multiple SOEP respondents within a neighborhood. My SOEP sample has 205,441 person-year observations (26,930 distinct individuals). More details on the SOEP are in Appendix A.
MEASURES
My dependent variable is attitudes toward immigrants. In the ESS, I construct an additive index out of the following six questions: whether respondents are in favor of allowing people of the same race/ethnicity as [country], allowing people of a different race/ethnicity as [country], allowing people from poorer countries outside of Europe, whether immigration is bad or good for economy, whether the country’s cultural life is undermined or enriched by immigration, and whether [country] is a better or worse place because of immigrants.Footnote 9
In the SHP, I use a question about opinions on chances for foreigners. There are three response options: ‘In favor of equal opportunities’, ‘In favor of better opportunities for Swiss citizens’, or ‘Neither’. I recode these answers into two measures. Equal foreigners: 1—Yes, 0—Other and Better Swiss: 1—Yes, 0—Other. In the SOEP, I use a question on whether respondents are concerned about immigration. There are three response options: ‘Very concerned’, ‘Somewhat concerned’, or ‘Not concerned at all’. I recode these answers into two measures. Very concerned: 1—Yes, 0—Other and Not concerned: 1—Yes, 0—Other.
In the ESS, I use two items to measure geographic residence. One is a self-reported distinction between big city, suburb, town/small city, village, and countryside. The second is administrative data on the subnational region of residence, which correspond to either Nomenclature of Territorial Units for Statistics (NUTS) level 2 or 3 categories. These categories include the metropolitan area of the largest city as a subnational region. I compare respondents from the metropolitan area of the largest city who self-report living in a big city to respondents not in the metropolitan area of the largest city who self-report living in a big city, suburb, town, village, or the countryside. This strategy is useful because not all ‘big cities’ are equally big. By identifying respondents in the largest city of each country, I isolate the population at the heart of debates around the urban–rural divide. In addition, by using administrative data to identify residents of the largest city, I minimize concerns about variation in the subjective understanding of what a ‘big city’ means across countries or across respondents.Footnote 10
In the SHP, I code municipalities (communes) into four categories: great urban center, medium urban center, rural, and other. ‘Other’ is a composite category that includes suburbs, small cities, and towns, and which should have immigration attitudes between those of large cities and rural areas. The SHP codes (presented in detail in Appendix Table A.2) for the ‘other’ communes do not allow me to reliably distinguish between suburbs, small cities, and towns, so I use the conservative composite category. SHP administrators provided me with commune codes that I use to match each respondent observation with census data on various commune characteristics (e.g., unemployment rate, population density, percent foreign-born).
SOEP respondents are categorized by municipality (Kreise) and coded as big city, rural, or other. Respondents are coded as ‘big cities’ if they live in the center (as opposed to the suburbs or outlying areas) of cities with more than 500,000 residents.Footnote 11 The rural municipalities are identified by government classification and ‘Other’ is everything else.
I measure neighborhood context in the SOEP by the ethnic composition of local residents. MICROM analyzes the first and last names of residents and assigns them to different ethnic (national origin) groups. I focus on big city neighborhoods with the fewest ethnically German residents. Presumably these neighborhoods should be the most open to international influences and provide the strongest test of whether contextual effects exist in specific big city neighborhoods. More details on neighborhood classifications are in Appendix A.
The key demographic independent variables are education and occupation. In each survey, I use a standard educational measure of the highest degree obtained: No secondary, Secondary, Post-secondary. For occupation, in each survey, I use International Standard Classification of Occupations (ISCO) categories: Professional, Military, Manager, Associate professional, Clerical, Services and Sales, Agricultural, Trades, Machine, and Elementary.Footnote 12 I create a composite category ‘Manual occupations’ for respondents in agricultural, trades, machine, and elementary occupations. Polarization over immigration is largely a debate about the conditions under which natives will accept newcomers, so all analyses are limited to respondents born in the country of residence.Footnote 13
AN OVERVIEW OF URBAN–RURAL DIVIDES ON IMMIGRATION IN WESTERN EUROPE
I start by analyzing data from the ESS to provide an overview of the relationship between immigration attitudes and geography in Western Europe. Figure 1 plots mean immigration attitude scores across geographic categories. As expected, immigration attitudes are most positive in the largest cities. There is a modest (but statistically significant at p < 0.05) gap of 0.04 points between residents of the largest cities and of big cities. Largest city residents are 0.07 points more positive than suburban residents, 0.09 points more positive than town residents, and 0.10 points more positive than village and countryside residents. These gaps are not enormous but they are notable, especially because they pool data from across thirteen country contexts. Also note that residents of villages and the countryside are close to the midpoint of the scale, which suggests that on average they are indifferent or slightly negative toward immigration, whereas residents of the largest cities are resolutely positive. In short, Figure 1 supports the conventional notion that attitudes toward immigration are more positive in large European cities.Footnote 14
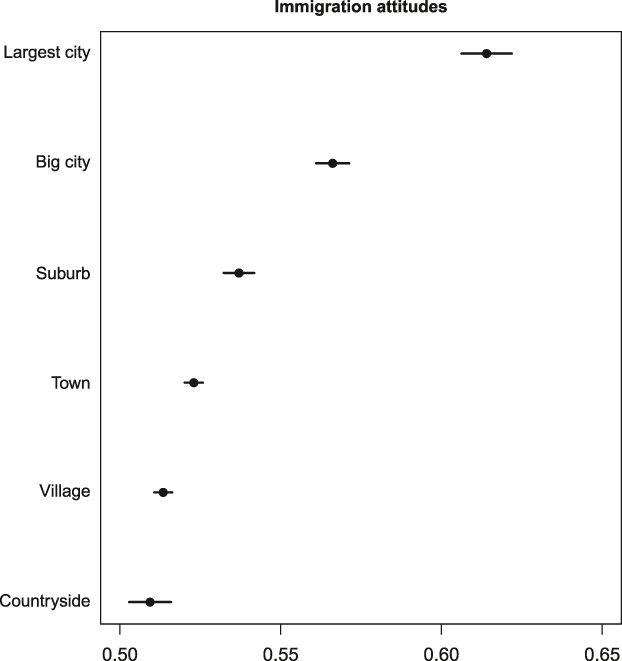
FIGURE 1. Immigration Attitudes Across Geography
Note: Pooled and weighted ESS sample. X-axis coded 0 (negative) to 1 (positive), N = 152,559.
Variation Across Geography and Demography
The logic behind compositional effects is that large cities are demographically different from the rest of the country. Table B.1 in the appendix presents demographic summary statistics and confirms that residents of Europe’s largest cities are more likely than residents of other geographic areas to have post-secondary degrees and to be professionals. Residents of the largest city are also less likely to have no secondary degree or to be in manual occupations. To explore whether these demographic differences can account for the geographic differences in immigration attitudes, I estimate a series of linear regression models. In Table 1, models 1 to 3 include country-level fixed effects (to account for unobserved country-level variation, such as different histories with immigration or different public debates about immigration) and standard errors clustered at the country level (to account for within-country variation on the dependent variable, as some countries are more polarized or unified on immigration attitudes).Footnote 15 Models 3 to 6 are hierarchical linear models, which account for the fact that respondents are nested within countries and within subnational regions.Footnote 16 Results in Table 1 are largely consistent across the two modeling strategies, which suggests that the findings are not an artifact of either approach.
TABLE 1. Estimating Relationships Between Geographic Contexts and Immigration Attitudes
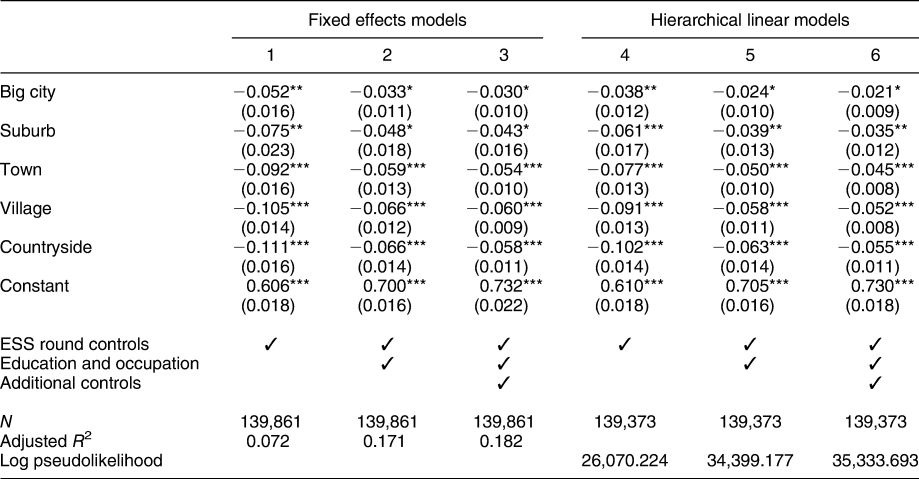
Standard errors in parentheses.
*p < 0.05, **p < 0.01, ***p < 0.001.
Pooled and weighted ESS sample. Models 1–3 are linear regression models with country-level fixed effects and standard errors clustered at the country level. Models 4–6 are hierarchical linear models with observations nested in countries and sub-national regions, random intercepts and an unstructured covariance matrix. ‘Largest city’ is the baseline geographic category. ‘Additional controls’ are: age, sex, citizenship and second generation. ‘ESS round controls’ are a series of dummy variables.
Models 1 and 4 in Table 1 include a factor variable for geography as a predictor, with ‘largest city’ as the omitted category. The results indicate that respondents in each of the other five geographic categories are more negative about immigrants than respondents in big cities and that the relationships are statistically significant (at p < 0.05). Models 2 and 5 add the key demographic controls for education and occupation. Finally, models 3 and 6 include additional controls for age, sex, citizenship, and second-generation immigrant.Footnote 17
The strongest evidence in favor of compositional effects would be if the geographic coefficients approached zero and were no longer statistically significant after the inclusion of demographic controls. Models 2, 3, 5, and 6 in Table 1 indicate that each of the geographic coefficients is reduced (roughly in half) when compared to models 1 and 4 without the demographic controls. Moreover, coefficients in models 3 and 6 indicate that the attitudinal gaps between largest cities and other geographic areas range from 0.02 to 0.06 points after controlling for demographic factors. These gaps are rather modest on a scale of zero to one and suggest that there is minimal geographic variation in immigration attitudes after accounting for variation in demographic profiles across geographic categories.Footnote 18 Nonetheless, geographic categories remain statistically significant (at p < 0.05) in models 2, 3, 5, and 6. This suggests that some geographic variation exists even after controlling for the most relevant demographic variables.
To place the importance of geography and demography in context, I compare immigration attitudes for respondents with the same demographic characteristics across geographic categories. The results are in Figure 2. Attitudes are mostly consistent across geographic categories within each demographic profile. The gap between largest cities and the countryside is only 0.4 points for post-secondary and professional and 0.08 points for no secondary and manual. The main difference is across demographic profiles. Within each geographic category, the gaps between professionals with post-secondary education and those in manual occupations without secondary education range from 0.21 to 0.26 points. This suggests that immigration attitudes are more strongly related to demographic characteristics than to place of residence.
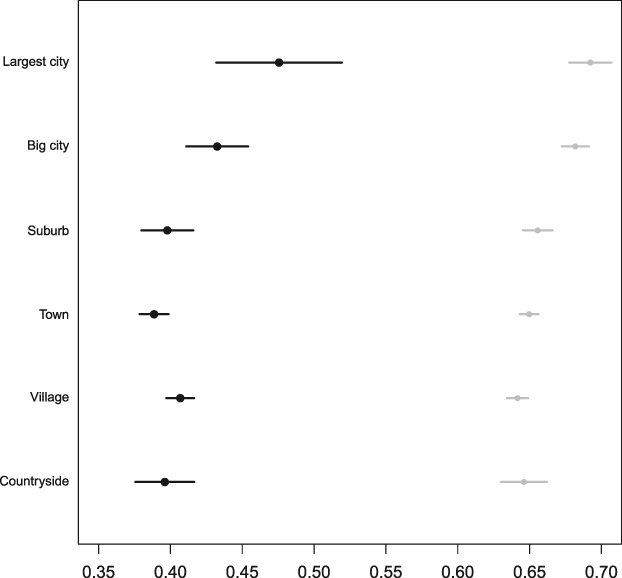
FIGURE 2. Immigration Attitudes Across Geography and Demography
Note: Weighted means from pooled ESS sample. X-axis coded 0 (negative) to 1 (positive). Black circles are no secondary education and manual occupations (N = 9,861). Grey circles are post-secondary education and professional occupations (N = 19,097).
One potential concern is that the analysis in Figure 2 skews results in favor of demography by focusing on the subset of respondents who have extreme outcomes on both education and occupation. Therefore, Figure C.1 in the appendix matches immigration attitudes across geography and demography separately for education and occupation. The results consistently show more variation across demographic than geographic categories. This further suggests that immigration attitudes are more strongly related to demographic characteristics than to place of residence.
In summary, ESS results from 13 West European countries support a compositional (H 2) as opposed to a contextual (H 1) explanation for geographic divides on immigration. Contrary to the contextual argument, the experience of living in a big city is not associated with positive immigration attitudes if you do not have secondary education or are employed in manual occupations. Instead, immigration attitudes appear more strongly associated with demographic characteristics (H 2a), regardless of urban or rural residence.
Robustness Checks
Thus far I have used data pooled across 13 West European countries but it is possible that urban–rural divides are more important in some countries as opposed to others. Figure D.1 in the appendix presents immigration attitudes across countries and geography. There is some variation across countries in the size of the urban–rural divide. For example, the largest divides are in Switzerland (0.18 points) and France (0.16 points) while the smallest divides are in Germany (0.05 points) and Spain (0.07 points). Future research could explore the sources of this cross-national variation in more detail, but the key for this article is that there are similar patterns of more positive attitudes in the largest city and more negative attitudes in the countryside in each country.Footnote 19 Additional analyses suggest that the pattern of greater demographic than geographic variation in immigration attitudes is mostly consistent across each country.Footnote 20
I also explore whether the urban–rural divide has gotten smaller or larger during the 14 years of ESS data. A detailed discussion is in Appendix E. The abbreviated answer is that there has been some modest growth over time in the urban–rural divide on immigration, most likely due to demographic changes in large capital cities, which is consistent with the logic of compositional effects. In contrast, there is no evidence that contextual effects can account for the growing urban–rural divide.
Finally, the analysis thus far has relied on an index compiled from multiple measures of immigration attitudes but it is possible that geographic differences are stronger for some measures. To test this possibility, Figures C.2 and C.3 in the appendix replicate the analysis from Figure 2 with mean scores for each immigration attitude measure across geographic and demographic categories. The results indicate that for each measure of immigration attitudes, there is more demographic than geographic variation, and attitudes are consistent across geographic categories within each demographic group. This is further evidence in support of compositional effects.
In short, ESS data provide an overview of immigration attitudes in 13 West European countries and suggest that compositional effects are stronger than contextual effects as an explanation for urban–rural divides.
CONTEXT VERSUS COMPOSITION: EVIDENCE FROM SWITZERLAND
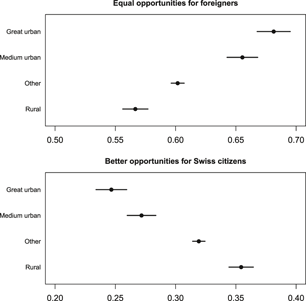
ESS data provide a suggestive overview, but for more analytical leverage on the specific contextual and compositional sub-hypotheses I turn to longitudinal data from Switzerland. Figure 3 plots mean scores on immigration attitude measures in the Swiss data. As expected, residents of Swiss great urban centers are the most in favor of equal opportunities for foreigners and rural residents are the least in favor. Similarly, residents of great urban centers are the least in favor of better opportunities for Swiss citizens and rural residents are the most in favor.
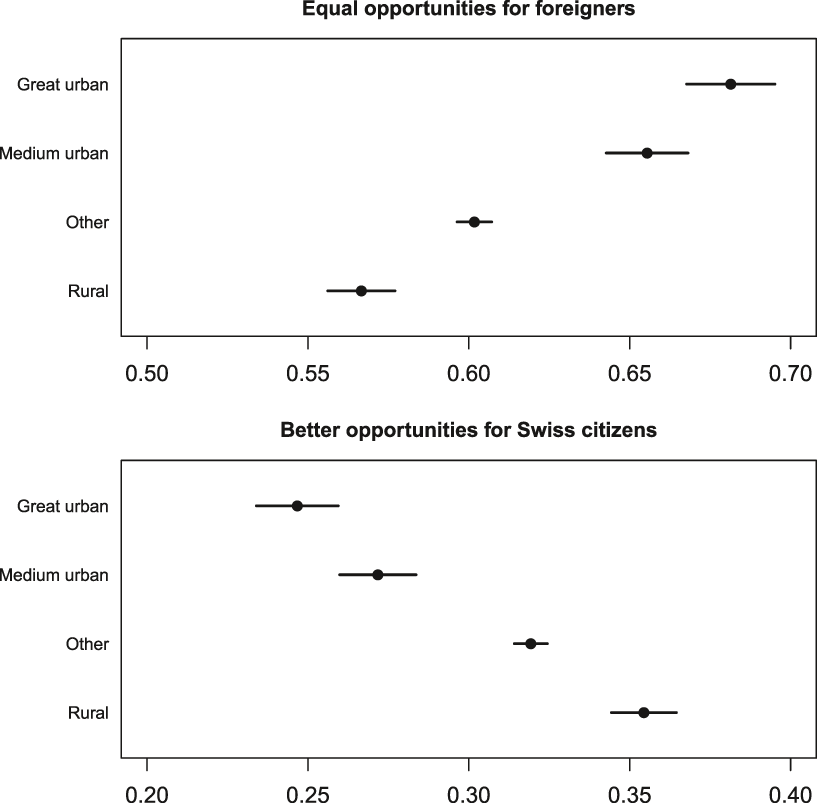
FIGURE 3. Immigration Attitudes Across Geography, SHP
Note: Swiss Household Panel 1999–2016. X-axis coded 0 (no), 1 (yes), Respondents all born in Switzerland, N = 55,488.
Does Moving to Urban Areas Change Immigration Attitudes?
To test whether moving to urban areas affects immigration attitudes (H 1a), I compare the time trend of attitudes among people who move to great urban centers with the time trend of people who do not move to great urban centers. This approach identifies attitude changes over time, which are due to moving to great urban centers by controlling for attitude changes over time for reasons unrelated to moving. I estimate linear regressions with person fixed effects.Footnote 21 The three key covariates indicate urban moving status. One is a bivariate measure of whether respondents moved to great urban centers since the previous survey wave. This captures whether the attitude change from one wave to the next is different for people who move to great urban centers as opposed to those who do not move. The second key covariate is a categorical variable for the number of years before moving to great urban centers. This captures whether the attitude change over several different time intervals is different for people who will move to great urban centers as opposed to those who will not move. The final covariate of interest is a categorical variable for the number of years after moving to great urban centers. This captures whether the attitude change over several different time intervals is different for people who have moved to great urban centers as opposed to those who have not moved.
Figure 4 presents results. The line at 0 on the y-axis is the trend for people who do not move to great urban centers. Coefficients plotted on the y-axis indicate the extent to which movers deviate from that trend. If moving to great urban centers has a causal effect on globalization attitudes, we would expect the coefficients to be zero before the move and then deviate from zero after the move.Footnote 22 Yet, across seven years before the move and six years after the move, the 95% confidence intervals all overlap with zero. This suggests that the time trend for immigration attitude is constant before and after moves to the big city, which does not support the logic of contextual effects.
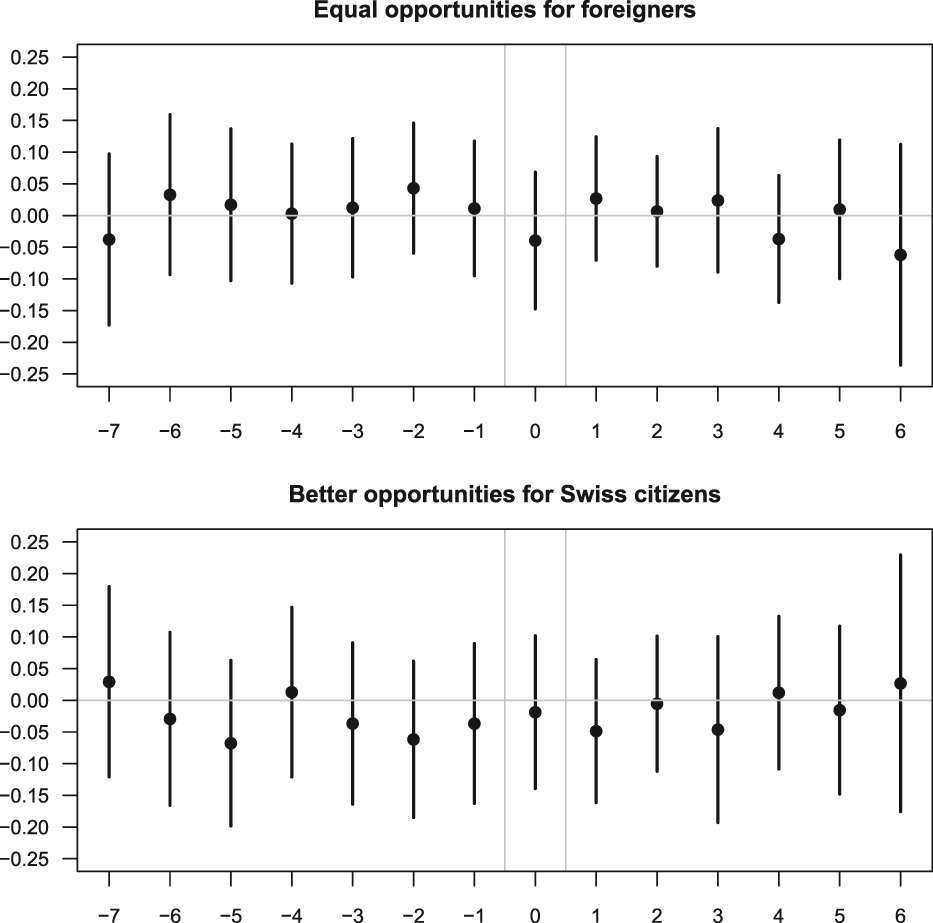
FIGURE 4. Immigration Attitude Time Trends for Moving to Great Urban Centers
Note: Swiss Household Panel 1999–2016. Coefficients (surrounded by 95% confidence intervals) from linear regression models with person fixed effects for the difference in attitudes between people who move/do not move to great urban centers. Positive/negative coefficients indicate a more positive/negative change for movers as opposed to not-movers. The X-axis plots time before and after the move. ‘0’ is the period the move occurred. Negative/positive numbers are the periods before/after the move. Weighted models are restricted to respondents born in Switzerland and include controls for education, occupation, age, Swiss citizenship, any household move, year, and canton. 45,734 person-year observations and 7,241 respondents.
Does Lifelong Exposure to Urban Environments Affect Immigration Attitudes?
To test whether lifelong exposure to an urban environment affects immigration attitudes (H 1b), I compare attitudes among people who have been exposed to different geographic environments their entire lives. I begin by restricting the data to respondents who have been in the same commune since they were 10 years old and who do not change communes during the SHP study.Footnote 23 I then estimate logistic regressions with standard errors clustered by respondent among the sample subset who spend their entire lives in the same commune. The key covariate of interest measures whether respondents spend their whole lives in different geographic contexts. Results are in Appendix Table F.1 and suggest that geographic differences in immigration attitudes are not statistically significant (at p < 0.05) among people who have spent their entire lives in the same commune.
Contextual Effects Robustness Checks
As a robustness check, I explore whether contextual effects exist in specific urban environments. Research on contextual effects suggests that population density and size of the foreign population are key factors that make urban residents more positive about immigration. Across great urban centers, population density is consistently high but there is more variation in the size of the foreign population.Footnote 24 Therefore, contextual effects may only exist (or be stronger) in urban areas with the highest shares of foreign residents. To test this possibility, I estimate linear regression models with person fixed effects (similar to the models from Figure 4) for the subset of movers to great urban centers that are in the top quartile of foreign population. Yet, results in Appendix Figure F.1 indicate there is no effect of moving to great urban centers in the top quartile of foreign population on immigration attitudes. In addition, there is no statistically significant difference (at p < 0.05) between people who live their entire lives in great urban centers in the highest quartile of foreign population and people who live their entire lives in medium urban centers, ‘other,’ or rural areas.Footnote 25
It is possible that the European geographic divide on immigration is not fundamentally between urban and rural areas but between economically thriving and economically depressed areas (Guilluy Reference Guilluy2014). According to this logic, the contextual effect of living in large cities may only cause more positive immigration attitudes in cities that have thriving local economies. A detailed discussion of this possibility is in Appendix G, but the key finding is that Swiss communes with better economic indicators (lower unemployment rates and fewer people receiving social welfare) tend to have more negative immigration attitudes. Therefore, at least in Switzerland, there is no evidence that the urban–rural divide on immigration is about economically thriving versus economically depressed areas.
I also explore whether contextual effects are more relevant for different subsets of the population. For example, the effect of moving to great urban centers may only exist for people who move from sufficiently different contexts. However, additional analyses suggest that there is no effect of moving to great urban centers from rural or ‘other’ areas.Footnote 26
Younger people moving to cities may be more impressionable and more likely to exhibit attitude change. Yet, there is no effect of moving to great urban centers on attitudes for respondents under 35 years old.Footnote 27 It is also possible that the experience of living in the same commune for one’s entire life is more important for younger or older people. Young people may be more marked by spending their entire lives in urban versus rural communes because they have not yet developed occupational or other life identities that may shape immigration attitudes. Conversely, older people have had the most time to be separated by their experiences in different geographic contexts. However, there is no evidence that spending one’s whole life in communes from different geographic contexts shapes immigration attitudes for the youngest or oldest respondents.Footnote 28 In short, a series of robustness checks with the SHP data fail to provide evidence for contextual effects of geography on immigration attitudes.
Demographic Sorting
Demographic statistics in Appendix Table B.2 indicate that residents of great urban centers are more likely than residents of other geographic areas to have post-secondary qualifications and professional occupations. In addition, great urban center residents are less likely to have no secondary qualifications and manual occupations. The logic of H 2a is that these demographic imbalances across geography should account for urban–rural divides on immigration. To test this proposition, I estimate logistic regression models with standard errors clustered by respondent and present full results in Appendix Table H.1. I start with a basic model predicting immigration attitudes with a covariate for geographic context. In subsequent models, I add demographic controls, and the coefficients for geography are reduced by roughly one-half. This suggests that demographic imbalances across geography can account for some of the urban–rural divide on immigration.
Yet, the differences between great urban centers and ‘other’ and rural areas remain statistically significant (at p < 0.05) even after the inclusion of demographic controls. This suggests that demographic imbalances across geography (at least as measured in my analyses) cannot account for all geographic variation in immigration attitudes. Therefore, to simultaneously evaluate the substantive significance of geographic and demographic predictors of immigration attitudes, I estimate a set of logistic regression models with interaction terms for geography and education and geography and occupation. I then calculate predicted probabilities according to different levels of educational and occupational attainment, across each geographic category. Results are in Figure 5.
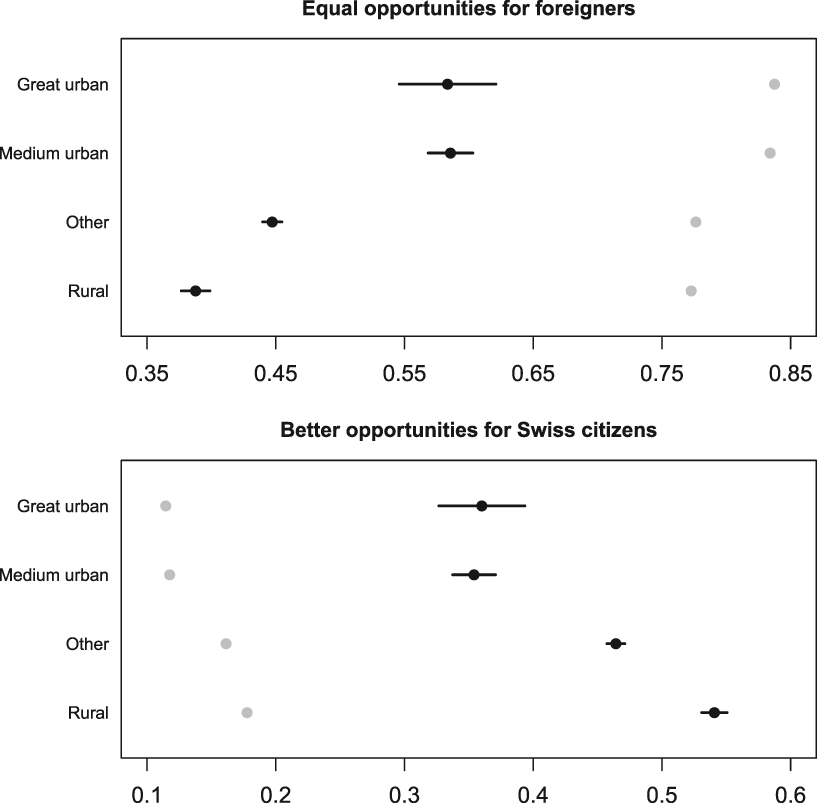
FIGURE 5. Predicted Immigration Attitudes Across Geography and Demography
Note: Swiss Household Panel 1999–2016. Calculated from logistic regression models with standard errors clustered by respondent. Points are predicted probabilities and lines are 95% confidence intervals. For each panel, the X-axis is coded ‘0’–No, ‘1’–Yes. Weighted models are restricted to respondents born in Switzerland and include controls for education, occupation, age, Swiss citizenship, year, and canton (54,761 person-year observations and 8,001 respondents). Black circles are no secondary education and manual occupations (1,071 person-year observations and 201 respondents). Grey circles are post-secondary education and professional occupations (5,852 person-year observations and 685 respondents).
The main takeaway from Figure 5 is the larger substantive significance of demographic as opposed to geographic predictors of immigration attitudes. The gap between high and low socioeconomic status respondents is 0.25 points in great urban areas and 0.39 points (equal opportunities) and 0.36 points (better for Swiss) in rural areas. In comparison, the urban–rural gap is 0.07 points for high socioeconomic status respondents and 0.19 and 0.18 points for low socioeconomic status respondents. These results support the logic of demographic compositional effects (H 2a) because they suggest that immigration attitudes are heavily stratified by demography in all geographic contexts.
Nonetheless, results in Figure 5 suggest that the demographic composition of different geographic areas cannot completely account for the urban–rural divide on immigration. In particular, there is notable geographic variation among low socioeconomic status respondents, which leads to more variation between high and low socioeconomic status respondents in rural as opposed to urban areas. These results could be explained by cultural sorting if lower socioeconomic status individuals who are pro-immigration select into urban areas. I explore this possibility in the next section.
Cultural Sorting
I test for cultural sorting with a series of models that regress moving to and from urban areas on immigration attitudes. Given the strong relationships outlined above between demography and immigration attitudes and between demography and geographic residence, I estimate the models first without and then with controls for demographic characteristics. This allows me to determine whether immigration attitudes predict moving status after controlling for demographic differences between subgroups with different immigration attitudes.Footnote 29
Results from models 1, 2, and 3 in Table 2 suggest that people who move to great urban centers are more likely to have positive immigration attitudes. Earlier results suggest that people with positive immigration attitudes are also more likely to have higher socioeconomic status and that socioeconomic status is correlated with geographic residence. However, immigration attitudes remain statistically significant predictors (at p < 0.05) of moving to urban areas even after controlling for education and occupation.Footnote 30
TABLE 2. Predicting Who Will Move To/Leave Great Urban Centers

*p < 0.05, **p < 0.01, ***p < 0.001.
Logistic regressions with standard errors (in parentheses) clustered by respondent. Models 1–3 limited to observations not in great urban centers. Dependent variable coded ‘0’ will not move to great urban center, ‘1’ will move to great urban center. Models 4–6 limited to observations in great urban centers. Dependent variable coded ‘0’ will remain in great urban center, ‘1’ will leave great urban center. ‘Additional demographic controls’ are sex, Swiss citizenship and age.
Moreover, additional analysis suggests that people who move to great urban centers are more likely to have positive immigration attitudes than people who live their whole lives in great urban centers.Footnote 31 Therefore, people may be drawn to urban areas by the pro-immigration environment and in the process push the urban cultural environment even further in the cosmopolitan direction. In short, there is strong evidence to support the cultural sorting hypothesis for people who move to great urban centers.
Results for people who leave urban areas do not support the logic of cultural sorting. Models 4, 5, and 6 suggest that views on equal opportunities for foreigners are not associated with whether or not one leaves urban areas. In addition, people who prefer better opportunities for Swiss citizens are less likely to leave urban areas. This latter finding runs counter to the logic of cultural sorting. Yet, it is consistent with recent research, which finds that people who make major geographic moves (i.e., leave urban areas for other regions of the country) tend to have higher socioeconomic status and be younger—demographic characteristics that are associated with more positive immigration attitudes (Maxwell Reference Maxwell2018). In the SHP, people who leave great urban centers are more likely to have post-secondary education and be younger than people who remain in great urban centers. As a result, in Table 2, the coefficient for better opportunities for Swiss citizens is reduced (although still statistically significant at p < 0.05) after controlling for education and occupation and then further reduced (and no longer statistically significant) after controlling for sex, citizenship, and age.
The Magnitude of Demographic versus Cultural Sorting
SHP results provide support for demographic sorting and cultural sorting for people who move to urban areas. To evaluate the relative magnitude of each process, I estimate models predicting immigration attitudes with covariates for demographic characteristics, moving status, and interactions between demography and moving status. I then calculate predicted probabilities of immigration attitudes across demography and moving status.Footnote 32 Results are in Figure 6 and suggest the greater importance of demographic sorting.
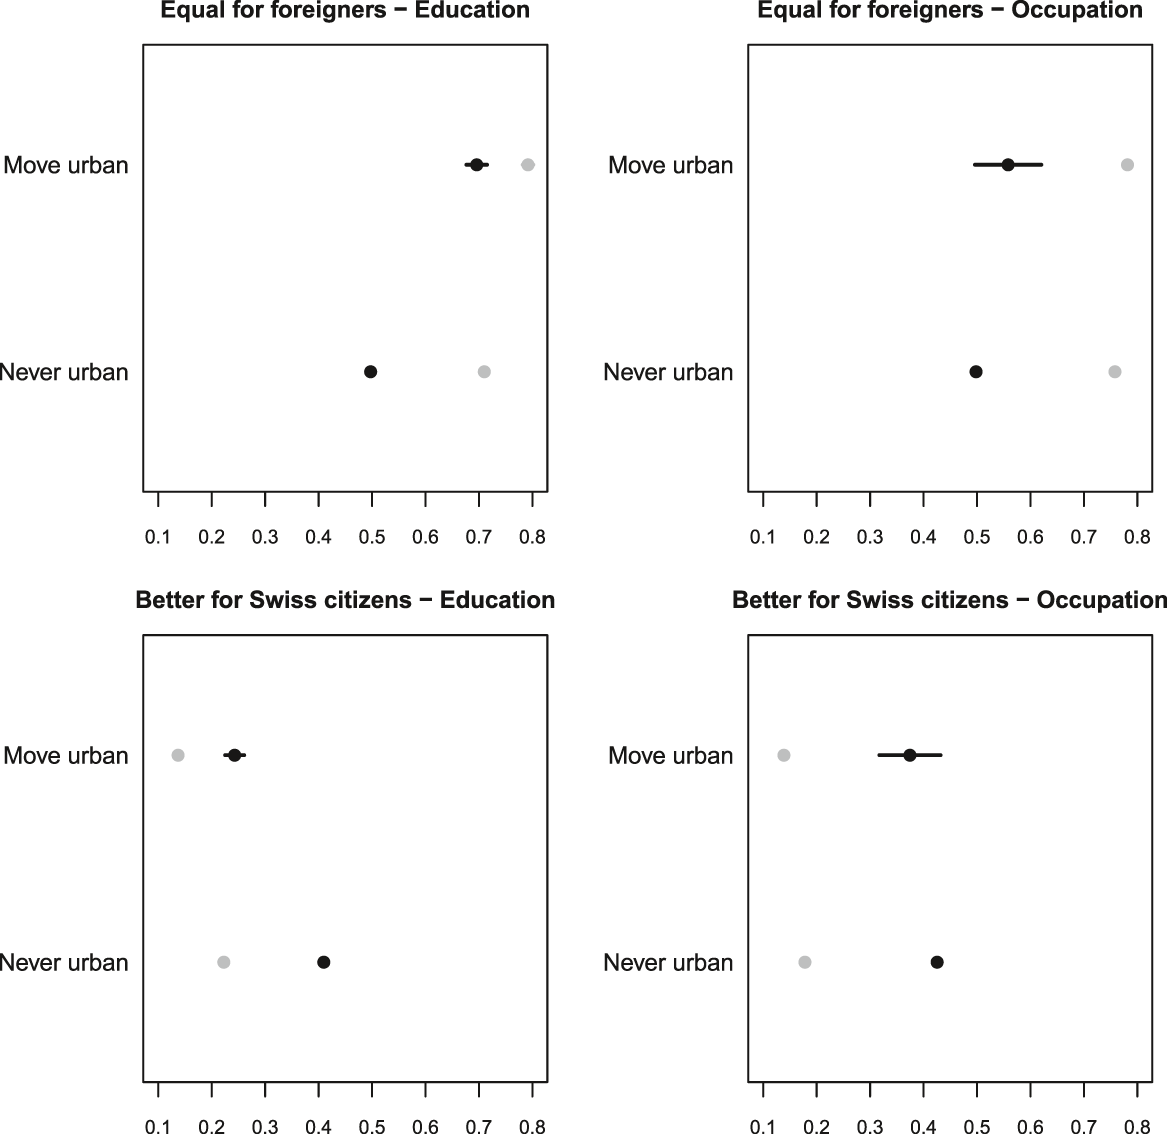
FIGURE 6. Demographic Versus Cultural Sorting
Note: Swiss Household Panel 1999–2016. Calculated from logistic regression models with standard errors clustered by respondent. Points are predicted probabilities and lines are 95% confidence intervals. Weighted models include controls for education, occupation, age, Swiss citizenship, year, and canton (49,954 person-year observations and 7,379 respondents) for each panel, the X-axis is coded ‘0’–No, ‘1’–Yes. ‘Move urban’ is respondents who will move to great urban centers later in the panel (1,902 person-year observations and 332 respondents) ‘Never urban’ is respondents who spend the entire panel not in great urban centers (48,052 person-year observations and 6,183 respondents). Black circles in the left panels are no secondary education and in the right panels are manual occupations (1,030 person-year observations and 196 respondents). Grey circles in the left panels are post-secondary education and in the right panels are professional occupations (4,987 person-year observations and 559 respondents).
The two panels on the left of Figure 6 indicate similar amounts of variation across educational attainment within the same moving status and across moving status within the same educational attainment. This suggests that the amount of geographic sorting by education is roughly similar to the amount of cultural sorting within educational groups. However, panels on the right of Figure 6 indicate no evidence of cultural sorting among manual workers and extremely limited evidence of cultural sorting among professionals. In comparison, the variation across occupational categories within the same moving status is always well over 0.20 points. This suggests that there is much more geographic sorting by occupation than there is cultural sorting within occupational groups.
Although Figure 6 provides more support for demographic as opposed to cultural sorting, the strongest evidence of cultural sorting is among respondents without secondary education. It is not clear why cultural sorting should be greater for this subpopulation, but it could help account for the greater geographic variation in attitudes among low socioeconomic status respondents in Figure 5. Future research should explore this in more detail.
Overall, results in this section suggest that demographic sorting is stronger than cultural sorting. Moreover, nonrandom sample attrition may create an upward bias in the amount of cultural sorting observed in the SHP data (a more detailed discussion is in Appendix A), which further suggests the relative importance of demographic as opposed to cultural sorting. More broadly, results from the SHP provide no evidence that contextual effects cause geographic divides on immigration. Instead, there is strong evidence that demographic and cultural sorting creates uneven population compositions across geographic areas.
VARIATION WITHIN LARGE CITIES: NEIGHBORHOOD-LEVEL EVIDENCE FROM GERMANY
ESS and SHP data indicate sizeable variation in immigration attitudes within big cities across demographic groups. This questions whether big cities are the appropriate unit of analysis for understanding spatial divides in immigration attitudes. Therefore, in this section, I explore more fine-grained spatial divides at the neighborhood level. Using data from Germany, I focus on big city neighborhoods with the fewest ethnically German residents. These neighborhoods should have the most international cultural environments and may be where contextual effects on immigration attitudes are most likely to exist.
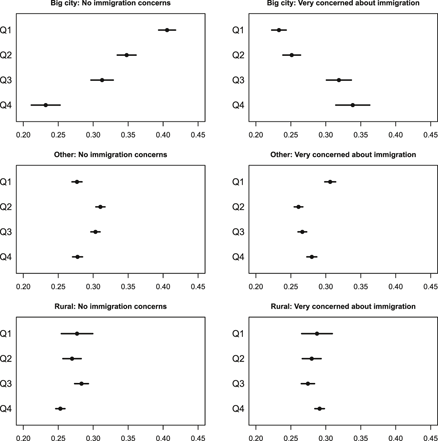
Figure 7 presents immigration attitudes across urban–rural geography and neighborhood.Footnote 33 As expected, attitudes are the most positive in big city neighborhoods with the lowest quartile of German residents. These neighborhoods are more positive about immigration than ‘other’ and rural areas, as well as big city neighborhoods with more German residents. Moreover, big city neighborhoods with more German residents have similar immigration attitudes as ‘other’ and rural areas. This suggests that natives are the most positive about immigration in big city neighborhoods with the fewest German residents.
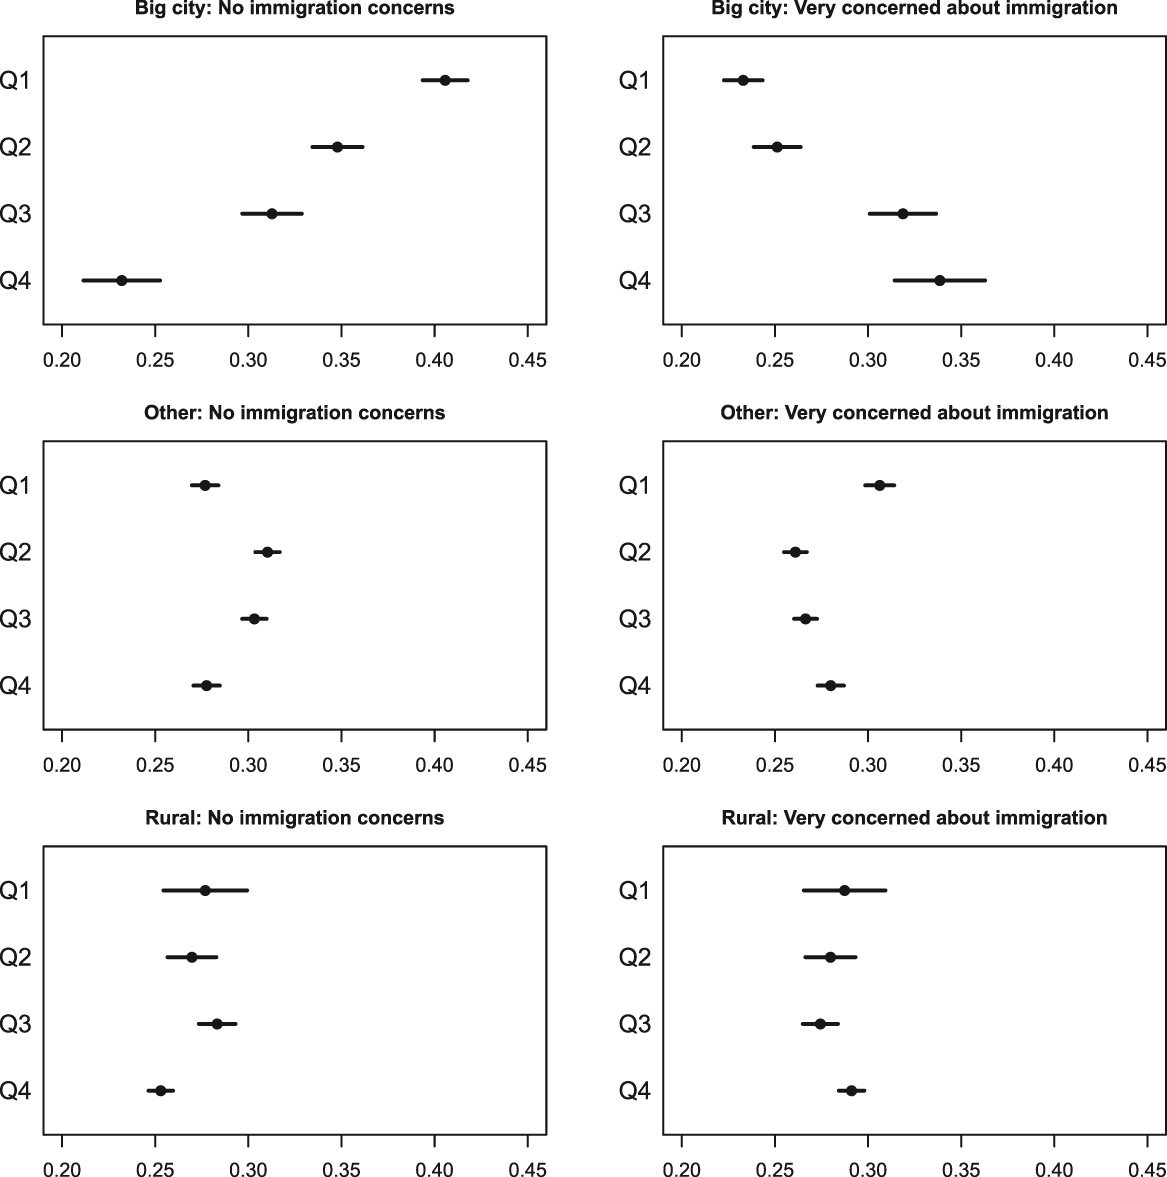
FIGURE 7. Immigration Attitudes across Neighborhoods and Urban-Rural Geography
Note: German Socio-Economic Panel 2006–2016. X-axis coded 0 (no), 1 (yes), Respondents all born in Germany. Q1 is lowest neighborhood quartile of ethnic-German residents, Q4 is highest quartile of ethnic-German residents (305,284 person-year observations and 42,887 respondents)
Do Contextual Effects Exist at the Neighborhood Level?
The logic of H 1a is that moving to big city neighborhoods in the lowest quartile of German residents should make immigration attitudes more positive. To test this, I compare the attitudinal time trend of people who move to those neighborhoods with people who do not move to those neighborhoods. The results are in Figure 8 and indicate no difference in the time trend for the two groups.Footnote 34 This suggests that moving to big city neighborhoods with fewer German residents does not cause people to become more positive about immigration.
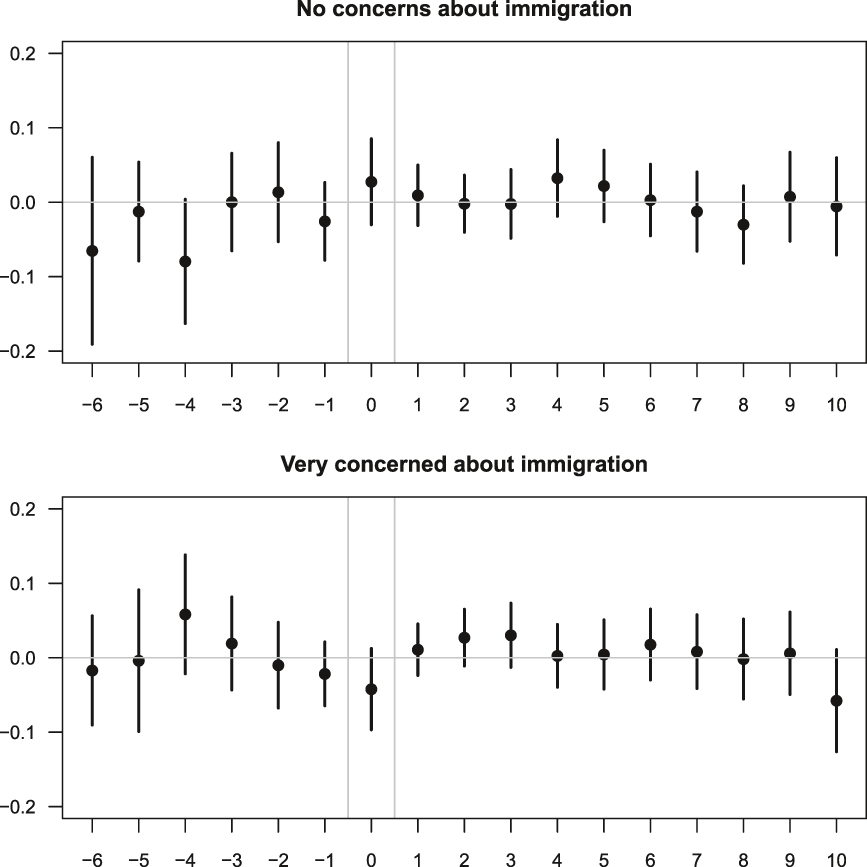
FIGURE 8. Immigration Attitude Time Trends for Moving to Big City Neighborhoods With the Fewest German Residents
Note: German Socio-Economic Panel 2006–2016. Coefficients (surrounded by 95% confidence intervals) from linear regression models with person fixed effects for the difference in attitudes between people who move/do not move to big city neighborhoods with the lowest quartile of German residents. Positive/negative coefficients indicate a more positive/negative change for movers as opposed to not-movers. The X-axis plots time before and after the move. ‘0’ is the period the move occurred. Negative/positive numbers are the periods before/after the move. Weighted models are restricted to respondents born in Germany and include controls for education, occupation, age, German citizenship, any household move, year, state and east/west region. 186,283 person-year observations and 35,916 respondents.
I explore alternate specifications to test the robustness of this finding. To ensure that my results are not driven by coding neighborhoods into quartiles of German residents, I estimate models where the percent of German residents is divided into thirds and into fifths. Results are in Appendix Figure I.2 and are consistent with Figure 8 as there is no evidence that moving to specific big city neighborhoods causes people to become more positive about immigration.
It is possible that moving to specific big city environments only affects people from dramatically different environments. For example, moving to big city neighborhoods with fewer German residents may have larger effects on people who come from neighborhoods outside of big cities with more German residents.Footnote 35 Results for this comparison are in Appendix Figure I.3 but there is no evidence that moving to big city neighborhoods with the lowest quartile German residents has an effect on immigration attitudes when coming from nonurban and non-lowest quartile German neighborhoods.
Given research on how exposure to immigrants can generate hostility for lower socioeconomic status individuals who compete with immigrants for scarce resources (Dancygier Reference Dancygier2010), I explore whether moving to big city neighborhoods with fewer German residents has different effects for high and low socioeconomic status respondents. Results are presented in Appendix Figure I.4 and suggest that attitudinal time trends are the same for movers and nonmovers among both high and low socioeconomic status respondents.
Another possibility is that attitudes are more positive in big city neighborhoods with fewer German residents because of the contextual effect of population change over time. Research from the Netherlands suggests that immigration attitudes become more positive among natives when the immigrant population grows at the neighborhood level, and especially when the immigrants are from non-Western countries (van Heerden and Ruedin Reference van Heerden and Ruedin2019). Moreover, in the SOEP, big city neighborhoods with the lowest quartile of German residents experience the greatest reduction over time in the German population and the greatest increase over time in the non-Western population.Footnote 36 However, regression results in Appendix Table I.1 provide no evidence of a relationship between immigration attitudes and within-person changes in neighborhood ethnic demographics (models in Appendix Table I.1 use measures for changing percentages of ethnic German residents and residents with non-Western ethnic origins). This suggests that while changing neighborhood demographics may affect immigration attitudes in some specific contexts, there is no evidence in the SOEP that changing local population dynamics can explain the positive immigration attitudes in big city neighborhoods with fewer German residents.
Finally, the logic of H 1b is that lifelong residence in a big city neighborhood with fewer German residents should cause more positive immigration attitudes. SOEP data allow a tentative exploration of this hypothesis by comparing people from different neighborhoods who have lived their entire lives in the same residence. This analysis provides no evidence that lifelong residence in big city neighborhoods with the lowest quartile of German residents is associated with more positive immigration attitudes, although the sample is limited and the results should be interpreted with caution. More details are in Appendix I.
The Composition of Neighborhoods
There is no evidence the contextual effects cause positive immigration attitudes in big city German neighborhoods with fewer German residents. Instead, the data suggest that attitudinal variation across neighborhoods is better understood as an example of how compositional effects contribute to urban–rural divides. For example, neighborhoods are not distributed evenly across urban–rural areas. In the SOEP, 43% of big city residents who were born in Germany live in neighborhoods with the lowest quartile German residents compared to only six percent of rural residents. As mentioned earlier, these international neighborhoods are more likely to be formed and sustained in big cities for a range of reasons: including economic trends, migration patterns, and cultural affinity. All of these dynamics suggest that people prone to more positive immigration attitudes are more likely to select into certain urban neighborhoods rather than those neighborhoods exerting direct effects on attitudes.
My earlier analysis explored two types of compositional effects: demographic and cultural. Both are likely to be relevant for neighborhood-level variation. As seen in Appendix Table B.3, residents of big city neighborhoods with the lowest quartile German residents are more likely to have post-secondary qualifications and be in professional occupations than the overall SOEP sample. Moreover, matching analysis (in Appendix Figure I.7) suggests that respondents with post-secondary education and professional occupations are always more positive about immigration than respondents with manual occupations and no secondary education, across geography and neighborhood. This is consistent with the logic of demographic sorting because it suggests that the demographic composition of big city neighborhoods with the lowest quartile of German residents contributes to their exceptionally positive immigration attitudes. In addition, Appendix Table I.2 suggests that having positive immigration attitudes is an important predictor of who moves to big city neighborhoods with the lowest quartile German residents.Footnote 37 This suggests that cultural preferences for pro-immigration environments may cause people to select into big city neighborhoods with the lowest quartile of German residents. In short, neighborhood-level dynamics contribute to the urban–rural divide on immigration and are consistent with logic of compositional effects.
DISCUSSION
This article has examined the urban–rural divide on immigration with cross-sectional data from 13 West European countries and panel data in Switzerland and Germany. Together, the results consistently suggest that the cosmopolitan immigration attitudes in large European cities are due to compositional and not contextual effects. Large European cities have more positive immigration attitudes than rural areas because those cities have larger percentages of residents who are highly educated and professionals and because people with positive immigration attitudes self-select into large cities.
One implication of my analysis is that demographic divides are essential to understanding conflict over immigration in Europe. However, there is much to learn about why people who are highly educated or in professional occupations are more likely to have positive immigration attitudes. Recent research has only begun to unpack the causal mechanisms connecting demography to immigration attitudes (Cavaillé and Marshall Reference Cavaillé and Marshall2019; Lancee and Sarrasin Reference Lancee and Sarrasin2015), as well as the nuances in how different demographic groups conceptualize immigration (Flemmen and Savage Reference Flemmen and Savage2017). Further research will be necessary to chart the future of these demographic divides.
Another implication of this article is that future geographic polarization in Europe depends on how the sorting mechanisms develop over time. If macroeconomic trends continue to spatially divide Europeans by demographic characteristics and micro-level cultural sorting continues to divide people by cultural preferences, we should expect large European cities to become increasingly distinctive over time. Moreover, ESS data (in Appendix F) suggest that the urban–rural divide may have (slightly) grown between 2002 and 2016. Charting these developments over time will be vital for future research.
I do not find evidence that geographic contexts contribute to urban–rural divides on immigration, but future research should continue to explore the conditions under which contextual effects may occur. For example, geographic context may have indirect effects on immigration attitudes. Given the importance of education and occupation for understanding immigration attitudes, if geographic context shapes educational and occupational attainment, it could indirectly affect immigration attitudes through those demographic outcomes.Footnote 38 The data in this article do not permit a full exploration but future research should explore more closely the multiple possible pathways for geographic context to influence political attitudes.
In addition, future research should explore the nuances of neighborhood-level dynamics. My results suggest that city-level aggregations can obscure important heterogeneity, across residents with different demographic characteristics and across space. Understanding how people sort into different neighborhoods and when those small-scale environments do and do not shape attitudes will undoubtedly provide insight on what makes large cities distinct as well as the future of the urban–rural divide.
Overall, the main takeaway message from this article is that geographic polarization between ‘Cosmopolitan’ cities and ‘Nationalist’ rural areas is a second-order manifestation of deeper demographic and cultural divides. Large European cities are distinctive environments but they do not make people more cosmopolitan about immigration. Instead, large European cities are cosmopolitan environments because of the people who live there.
SUPPLEMENTARY MATERIAL
To view supplementary material for this article, please visit https://doi.org/10.1017/S0003055418000898.
Replication materials can be found on Dataverse at: https://dataverse.harvard.edu/dataverse/urbanimmatt.






Comments
No Comments have been published for this article.