How does the medium of political communication affect the message, if at all? A glance at the landscape of US political media suggests some connection between the two, with right-wing outlets dominant on talk radio and cable news and successful new digital-native outlets generally leaning left. In the comparative context, campaigns in democracies where broadcast media are more centralized and public-owned are more programmatic and party-centered than in those with more fragmented viewer markets (Plasser and Plasser Reference Plasser and Plasser2002). Of course, these are pure correlations, and it is entirely possible that these associations between medium and content simply reflect the demographic profile of the audienceFootnote 1 or common consequences of varying political cultures.
Nonetheless, the dramatic technological changes experienced over the past 15 years have real potential to shift the strategic landscape of campaign communication and thereby alter the content of campaign messaging that voters receive. In particular, the mass adoption of the Internet, smartphones, and social media have moved the technological frontier of mass communication in two strategically important ways. First, social media platforms substantially lower the cost of advertising,Footnote 2 expanding the set of candidates for whom advertising—and thus the potential to reach voters and seriously contest an election—is a real possibility. Second, and perhaps even more consequential, social media platforms offer vastly more precise targeting capabilities than legacy broadcast media. This feature of social media could allow campaigns to strategically tailor messages to narrowly defined audiences, a capability with the potential to undermine democratic accountability.Footnote 3
While there are clear theoretical reasons to think that the mass adoption of social media would alter equilibrium campaign behavior, the examples above illustrate that differentiating consequences from correlates of communication technology is difficult. This paper attacks this challenge by introducing a new dataset of candidate-sponsored advertising, covering all advertising on TV and on Facebook by the universe of US congressional, statewide, and state legislative campaigns in 2018. We combine information from the Facebook Ad Library API, which archives all political advertisements run on Facebook since late May 2018 (Nicas Reference Nicas2018), and the Wesleyan Media Project (WMP) database of political ads on television. We compare, on multiple dimensions of content and quantity, advertising on the two media by the same candidate in the same race. The use of within-candidate comparisons allows us to hold fixed candidate attributes, the competitiveness of the electoral environment, constituency characteristics, and other covariates that might otherwise bias a comparison of content across media.Footnote 4
Comparing content across media within the same electoral campaign allows us to assess whether and how candidates take advantage of three opportunities afforded by social media: to increase advertising quantity thanks to its lower costs of production and placement, to use advertising for other purposes—like fundraising—that are impractical on television, and to strategically adapt their self-presentation to match the preferences of finely segmented audiences. Because the latter in particular may involve subtle changes that are difficult to detect at scale, we build a rich dataset of finely detailed advertising features—choices of words, images, facial expressions, and references to political figures—that are measured in a consistent way across media. In addition to providing a comprehensive description of the content of political advertising both online and offline, these data elucidate how the capabilities of social media alter candidates’ choices of issue agenda, tone, and ideological positioning in their advertising. Our findings offer some confirmation but also a number of surprises relative to our ex ante theoretical expectations.Footnote 5 Notably, Facebook ads engage in less attacking of the opponent and more promotion of the sponsoring candidate, compared with the same candidate’s ads on TV. This finding suggests that fear of a voter backlash (Dowling and Wichowsky Reference Dowling and Wichowsky2015; Lau, Sigelman, and Rovner Reference Lau, Sigelman and Rovner2007; Roese and Sande Reference Roese and Sande1993) is not a significant constraint on the negativity of campaign advertising: campaigns could, if they chose, use Facebook’s targeting capability to show negative ads only to supporters and avoid exposing the swing voters or opponents’ supporters who are likely to exhibit backlash. Candidates do not appear to be implementing this strategy in significant numbers. Our results are instead consistent with an account of negative ads as demobilizing to the supporters of the opponent (Krupnikov Reference Krupnikov2011), as the more selected audience for Facebook ads leads to less rather than more negativity compared with TV.
Facebook ads contain less issue content than television ads by the same candidate. This is true even for relatively niche issues, where one might expect the targeting ability and low production cost of Facebook to make viable the production of ads hitting a wider range of issues not of sufficiently mainstream interest to justify the cost of a TV spot. We speculate that the compressed format and reduced attention that viewers give to online communications (Dunaway et al. Reference Dunaway, Searles, Sui and Paul2018) counteracts these forces for more varied issue discussion.
Facebook ads are, however, more easily identifiable as partisan and more ideologically polarized than their TV counterparts. This is true both in the aggregate and within-candidate. Candidates do appear to take advantage of finer targeting to deliver more partisan messaging, which suggests that the capabilities of social media push candidates toward using ads more for mobilization than for persuasion. We also find that the ideological positioning of candidate messaging is more variable within candidates on Facebook than on TV. That is, candidates are better able to fine-tune their message to comport with audience preferences on Facebook. In ads run by the same candidate in the same race, both issue mentions and perceived partisanship correlate with the demographic composition of the audience.
On the extensive margin, the set of candidates who advertise on Facebook is much broader than those who advertise on TV. The ability of ad spots on Facebook to be geographically targeted to avoid wasting impressions on viewers outside of an electoral district matters especially for down-ballot candidates; at the state house level, more than 10 times as many candidates advertise on Facebook than advertise on TV.
Taken together, these findings suggest that communication media have substantial impact on candidates’ communication strategy. The primary effect of an increase in targeting precision appears to be to allow candidates to reach their supporters more efficiently. For lower-resourced candidates, this is the difference between advertising and not. For higher-resourced candidates, the change leads to a shift of advertising messages away from those focused on persuasion—taking popular issue positions, attacking the opponent, and downplaying partisan cues—and towards those focused on mobilization. The political diversity of television audiences compels candidates to engage in attempts at persuasion; absent this constraint, candidates prefer to abandon most discussion of issues or comparison with the opponent and instead activate preexisting partisan loyalties. Given the connection between candidates’ campaign issues and legislative activity once in office (Sulkin Reference Sulkin2011), the relative lack of issue content on Facebook may lead to reduced citizen knowledge of candidates’ policy platforms as the use of social media for political communication rises. We take up this and other implications of our results in the concluding section.
THEORY and EMPIRICAL PREDICTIONS
Our theorizing begins with the two strategically important differences between television and online ads. First, there is a difference in cost. Because digital ads can be displayed to individual users instead of the entire local audience for a television program, online advertisements can be purchased in much smaller increments of impressions. Unlike television ads, the audience for online advertising need not follow the boundaries of television media markets (Designated Market Areas or DMAs), a fact which is especially important for political advertisers attempting to reach electorates in districts whose boundaries may not align well with those of a DMA. This increase in geographic alignment has the effect of (sometimes dramatically) lowering the effective cost per impression, as candidates need not waste impressions on viewers who cannot vote in their district. Moreover, the cost of production of a digital advertisement can be much lower than that on television.
Second, the precision of audience targeting varies across television and online advertising. Whereas television advertisers can select programs with particular demographic profiles (Lovett and Peress Reference Lovett and Peress2015) in an attempt to reach a desired audience, television programs provide a far from perfect partition of the ideological or partisan spectrum.Footnote 6 Social media firms, on the other hand, have an unusually rich set of individual-specific information, including self-identified interests, demographics, and media consumption choices that can be used to target advertisements to precise audiences: a campaign could, for instance, run an advertisement only to users who self-identify as political moderates, or users who follow the page of a particular national politician. Facebook offers advertisers the ability to go even a step further by specifying their own “custom audiences”—for example, lists developed from voter files and turnout history or from contacts at campaign events.
We develop a series of hypotheses about the impact of social media technology on advertising quantity and content on the basis of these two observations. Although most of the theoretical and empirical work on campaign advertising to date has focused on television (Freedman and Goldstein Reference Freedman and Goldstein1999; Fowler, Franz, and Ridout Reference Fowler, Franz and Ridout2016; Goldstein and Freedman Reference Goldstein and Freedman2000; Reference Goldstein and Freedman2002a; Kahn and Kenney Reference Kahn and Kenney1999; Krasno and Green Reference Krasno and Green2008; Sides and Vavreck Reference Sides and Vavreck2013), our research nonetheless speaks to three relevant literatures: the question of whether the Internet equalizes the playing field between well-known candidates with abundant resources and upstart candidates, the strategic use of different communication modes, and the literature on the content of messaging in elections. We take on each in turn.
Equalizing or Normalizing?
First, we situate our work in the on-going debate on the impact of new technologies on electoral competition. Do digital media and the internet help equalize electoral competition (Barber Reference Barber2001; Gainous and Wagner Reference Gainous and Wagner2011; Reference Gainous and Wagner2014) by allowing poorly financed candidates to compete on a more level field or merely reinforce existing resource inequities (Bimber and Davis Reference Bimber and Davis2003; Gibson et al. Reference Gibson, Margolis, Resnick and Ward2003; Hindman Reference Hindman2008; Stromer-Galley Reference Stromer-Galley2014)?
We are interested in whether Facebook allows candidates with fewer resources most often challengers and down-ballot candidates) to overcome resource imbalances in airing relatively costly television ads at the media market-level. The cost to advertise on television is often cited as part of the incumbency advantage at the federal level (Prior Reference Prior2006).
We start by asking whether and how online advertising broadens the set of candidates who advertise by comparing both extensive and intensive margins of advertising on television to that on Facebook. Of particular interest is the ability of challengers to level the electoral playing field by using Facebook advertisements in electoral environments where television advertising is feasible for incumbents but too costly for challengers. We also ask whether the much lower entry cost of Facebook advertising enables candidates in down-ballot races who are priced out of the market for TV ads to reach voters. Taken together, these analyses examine whether more financially constrained candidates, specifically challengers and state legislative candidates, advertise relatively more on Facebook, compared with their incumbent and up-ballot counterparts.
When and Where Do Candidates Advertise?
Online advertising can be tailored to achieve different campaign goals than traditional advertising on television. The low cost of online advertising and the ability to target has potential implications for both when candidates choose to advertise and where these ads are displayed. Facebook offers two potential targeting advantages relative to television that may affect how campaigns use the platform. First, behavioral information can be used to serve engagement-oriented advertisements to well-off users who have expressed an interest in politics and are particularly likely to donate to a campaign. Second, Facebook advertisements can be targeted to much lower levels of geographic aggregation, such as the zip code, than television advertisements, which can only be geographically targeted at the DMA level. These capabilities of online advertising have implications for both when in the campaign candidates serve online advertisements and the spatial location of these advertisements.
Campaigns can use Facebook advertisements to solicit campaign resources in a way that is infeasible with television advertisements. While television advertisements may incidentally increase campaign contributions,Footnote 7 online advertising is better suited to soliciting campaign resources and measuring return on investment. Online advertisements might serve a similar function to direct mail as a cost-effective tool for generating campaign resources for candidates (Hassell and Monson Reference Hassell and Monson2014).
Previous content analyses of online advertisements suggest that campaigns do use these ads to recruit volunteers and donations. Campaigns often link their advertisements to landing pages where users can sign up for a mailing list, register to volunteer, or make contributions. Online advertisements allow users to immediately follow through by performing an action at the request of the campaign. One analysis of the 2016 presidential campaign found that fewer than half of the digital ads that were sampled had a goal of voter persuasion (Franz et al. Reference Franz, Franklin Fowler, Ridout and Wang2019). Similarly, in their study of online display ads from the 2012 presidential campaign, Ballard, Hillygus, and Konitzer (Reference Ballard, Hillygus and Konitzer2016) coded only 37% of the ads as focusing on undecided or persuadable voters.
Financial contributions and volunteers are more valuable earlier in the campaign when candidates still have time to build out campaign infrastructure and use these resources to mobilize and persuade potential voters. TV ads, on the other hand, are most useful to campaigns in the days leading up to the election. Gerber et al.’s (Reference Gerber, Gimpel, Green and Shaw2011) field experiment demonstrated that television advertising has a measurable persuasive effect on citizens’ political preferences, but the effects are short-lived, lasting no longer than a week or two. This research suggests that ads that attempt to persuade will have higher electoral returns as the election date approaches. Based on this logic, we expect that Facebook advertising will be used earlier in the campaign than television.
The targeting ability of online ads also has implications for their spatial location, relative to TV. One dimension in which this difference may manifest itself is the distribution of online ads to users who are ineligible to vote in the candidate’s election but may be willing to contribute resources to the candidate.Footnote 8 While the different motivations of online and offline advertising would lead to the prediction that a higher proportion of online ads are sent to out-of-state residents, a countervailing factor that increases the relative proportion of TV ads outside of the state is the spatial structure of media markets, which often cross state lines. Candidates in electoral constituencies with a DMA that crosses state boundaries are often forced to waste advertising dollars on out-of-state viewers. In some cases, the lack of congruence between an electoral district and the containing DMA makes the effective price of TV ads so high that candidates cannot afford to advertise at all. We use our data to ask whether the proportion of ads displayed to out-of-state residents differs across Facebook and television and how this difference varies with the electoral district–media market congruence.
What Messages Do Candidates Include in Advertising?
A final relevant literature considers the content of political advertising and its determinants. One possibility is that campaigns emphasize a similar message across modes, what Bode et al. (Reference Bode, Lassen, Kim, Shah, Fowler, Ridout and Franz2016) call “a single coherent message strategy.” Alternatively, campaigns might adapt their message to meet the expectations of the varied audiences across media. As noted, television audiences are more politically diverse than targeted online audiences, suggesting that TV ads may be used to persuade the median voter while online messages may be directed at those who share an ideological or partisan affinity with the candidate. These different audiences may have different issue priorities and different expectations of campaign tone. To that end, we examine both in our analyses.
Scholars have long noted the potential of negative television advertisements to harm the sponsor of the advertisement, a backlash effect (Roese and Sande Reference Roese and Sande1993). In their meta-analysis of 40 studies of negative campaigning, Lau, Sigelman, and Rovner (Reference Lau, Sigelman and Rovner2007) find that citizens evaluate the sponsor of negative messages more negatively in 33 of the studies, and this effect is substantively large and statistically significant.Footnote 9 Because of the targeting limitations inherent on television, negative ads will be viewed by citizens who are favorably disposed toward the candidate who is attacked in the advertisement. As a result, these citizens may lower their evaluations of the sponsoring candidate or increase their likelihood of turning out. Inability to target the negative message to those citizens who will be most receptive to it increases the magnitude of the backlash effect. Thus, campaigns may allocate their negative messaging to online platforms where they can more precisely control who sees those ads, limiting the potential for a backlash. Our dataset thus provides an ideal setting to evaluate how constrained candidates are by fear of backlash effects. We ask, Do a higher proportion of ads exhibit a negative tone on Facebook relative to television?Footnote 10
On the issue agenda of advertising, again expectations about the audience may drive the nature and level of issue discussion. Bode et al. (Reference Bode, Lassen, Kim, Shah, Fowler, Ridout and Franz2016) found that Twitter was much less likely to provide discussion of issues than television advertising, but the study acknowledges that the character limitations of the medium (at the time 140) might restrict the capacity to raise issue or policy claims relative to other platforms. Still, issue discussion on Twitter does occur, and Kang et al. (Reference Kang, Fowler, Franz and Ridout2018) found higher issue convergence within a campaign between advertising and Twitter and lower convergence between advertising and email in 2014 U.S. Senate Races. Twitter is closer to a broadcast medium than email, given that tweets are often seen and shared by journalists (and can therefore be seen by voters of different partisan and ideological dispositions). Email, in contrast, is targeted to individuals with a direct past tie to the campaign, either from a donation, sign-up, or request to receive emails. In that sense, email is conceptually more similar to Facebook advertising.Footnote 11 So, our next research question is, Do candidates discuss different policy issues on Facebook than on television?
We also investigate the degree of partisanship and polarization of ideological positioning in Facebook relative to television ads. On TV, candidates often downplay their partisan affiliation (Neiheisel and Niebler Reference Neiheisel and Niebler2013) and, consistent with a goal of persuading on-the-fence swing voters, highlight issue stances where they are most different from their party (Henderson Reference Henderson2019). We ask, Does the more precise targeting afforded by Facebook give candidates license to include more explicitly partisan messaging in their ads?
Finally, we investigate the effect on within-candidate variation in messaging. Narrow-cast Facebook ads might allow the same candidate to offer different messages to different audiences, varying the content of advertising according to characteristics of the audience, rather than staking out a unified message strategy. We ask, Do Facebook ads have more within-candidate variation in ideological positioning than TV ads? Does the content of messaging correlate with characteristics of the audience, within candidates?
DATA AND METHODS
We draw on television and Facebook advertising data from all federal, statewide, and state legislative candidates. A challenge that has hampered the study of online political communication in the past, as Ballard, Hillygus, and Konitzer (Reference Ballard, Hillygus and Konitzer2016) discuss, is that many advertisements only appear briefly and are targeted to specific users in a way that is not visible to third parties. These limitations have prevented scholars from seeing the complete universe of campaign advertisements. Facebook, however, has recently released a database of information on the political advertisements run on its platform since May 2018 (Nicas Reference Nicas2018). We use this database to study campaign ads in the 2018 midterms. Although others have used these data (e.g., Edelson et al. Reference Edelson, Sakhuja, Dey and McCoy2019), we believe ours to be the first study that examines not only the volume of spending but also the content of the ads, how candidate advertising strategies vary up and down the ballot, and when and where candidates deploy their advertisements.
Data on television advertising come from the Wesleyan Media Project (Fowler, Franz, and Ridout Reference Fowler, Franz and Ridout2016), which has tracked political advertising on local broadcast, national broadcast, and national cable television since 2010. The Wesleyan data rely upon ad tracking by a commercial firm, Kantar/CMAG, which detects and classifies ads aired in each of the 210 media markets in the United States. The data are at the level of the ad airing, so for each advertisement we observe the television station, media market, and time of day when the ads aired. The data also measure the estimated cost of each airing. In addition to these raw tracking data, Kantar/CMAG supplies Wesleyan with a video of each ad (the “creative”), and coders at the project classify each on a variety of characteristics, including its tone and the issues that were mentioned.Footnote 12
The Facebook Ad Library API includes a snapshot of the ad creative as it would have displayed to users, including any text, images, and video. It also reports the sponsor who financed the ad, the dates of the ad, the approximate number of impressions that the ad received, the cost of the ad, and aggregate demographic information on the age range, gender, and state of residence of the ad’s audience.Footnote 13 Facebook includes both candidate and issue advertisements in this database. We focus on candidate-sponsored ads. The data were accessed via Facebook’s API, which we had access to in Fall 2018.Footnote 14 The API allowed for bulk downloads of ad data based on a supplied list of key words or page IDs. We collected a comprehensive list of candidates’ Facebook page IDs and downloaded all ads from these pages.
From the television and Facebook ad creatives, we extracted a large set of features by processing the ad’s text, images, video, and audio through commercially available computer vision, audio transcription, and natural language processing software. The extracted features are described in complete detail in Appendix B. Features include word frequencies in text and transcribed audio, descriptive tags for images included in the ad, and attributes such as emotion classifications and predicted ages of human faces detected in the ad’s images.
We use these features to detect the occurrence of negative advertisements and advertisements by issue area. We had research assistants classify a training sample of the Facebook advertisements on issue and tone dimensions and then used these classifications, along with classifications of the TV ads in the Wesleyan data, as the basis for a supervised learning classification procedure, described in detail in Appendix B. The fitted model from this process then produces predicted values for tone and issue content, which we use as our measure of these quantities for all ads in the data set. Using the same process and the same ad features, we also produced predictions of the partisanship and campaign finance-based ideology score of the ad sponsor (Bonica Reference Bonica2014).Footnote 15 To aggregate these ad-level measures to the candidate level, we calculated expenditure-weighted averages of message content for each candidate.Footnote 16
We have also gathered information on the partisanship, incumbency status, and campaign resources of the federal- and state-level candidates from the two major parties.Footnote 17 The final dataset contains a total of 7,298 candidates, 1,032 who advertised on both Facebook and television, 242 who advertised only on TV, and 6,024 who advertised only on Facebook. Additional summary statistics are in Appendix A.
Which Campaigns Advertise Online and Offline?
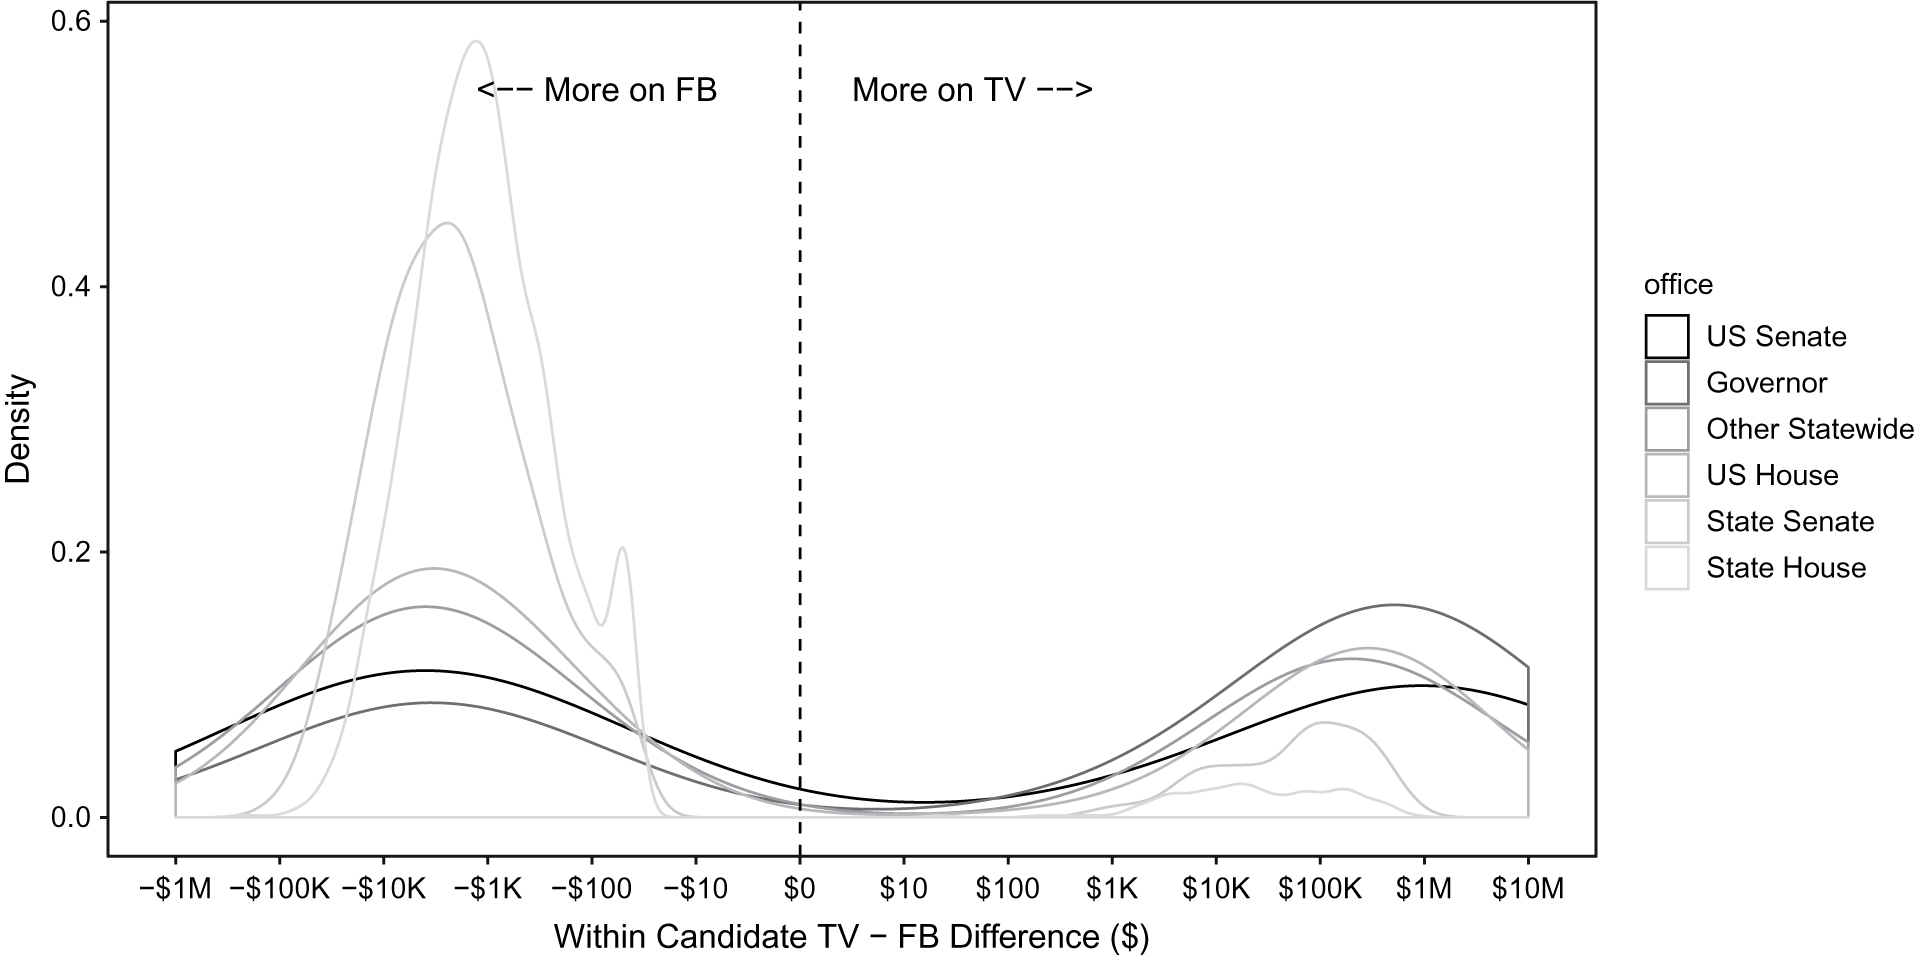
We first provide some descriptive analysis of the aggregate use of both Facebook and television media, by office sought. In Figure 1, we show the distribution of cross-medium spending differences by congressional, gubernatorial, other statewide,Footnote 18 and state legislative candidates.Footnote 19 The densities include all candidates in our dataset who advertised on both TV and Facebook, with positive values indicating the campaign spent more on TV than on Facebook, and negative values the opposite. Most governor and US Senate campaigns spent substantially more (by $100 thousand to $1 million) on TV than on Facebook, though a minority of these campaigns invested more heavily on Facebook. As we move downballot, the pattern reverses, with the vast majority of state house and senate candidates doing more of their spending on Facebook. Total spending is much lower in these campaigns, however, so typical within-candidate differences are an order of magnitude smaller (in the range of $1 thousand to $10 thousand).
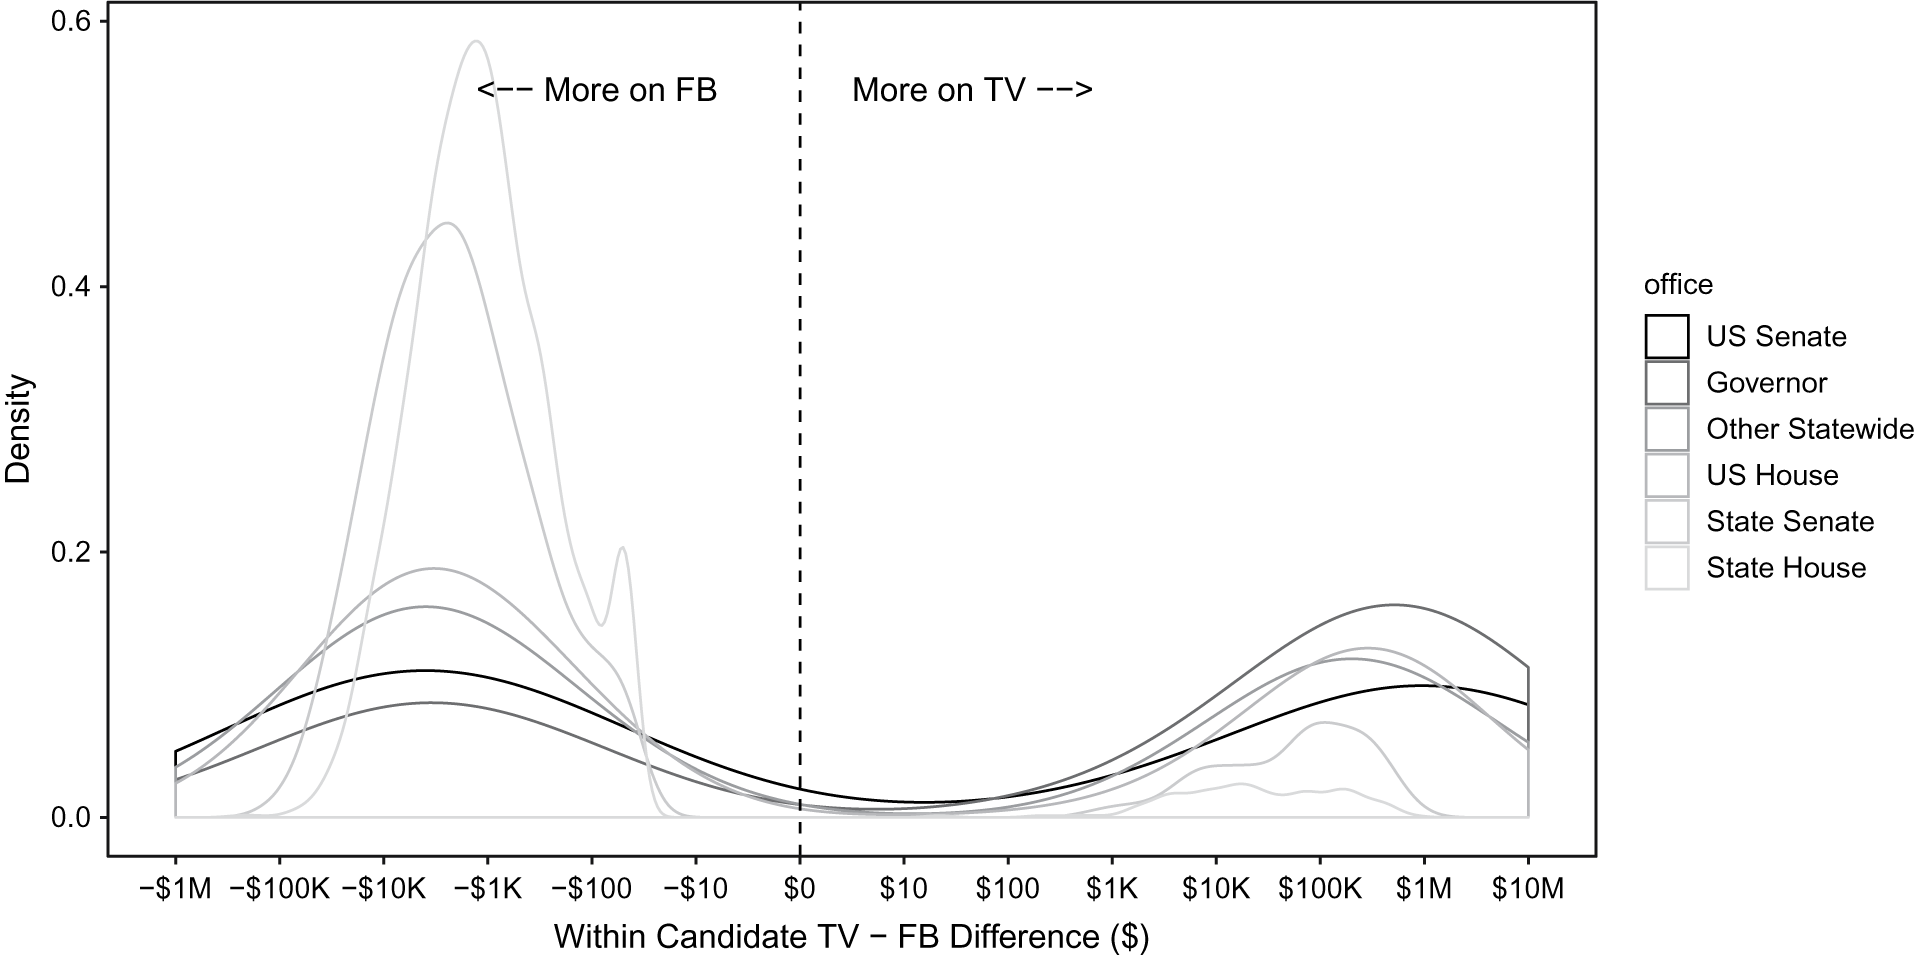
FIGURE 1. Kernel Density Estimate of Candidate-Level Difference between Spending on Television and on Facebook, by Office Sought
Figures A2a and A2b in the Appendix plot the distributions of spending on Facebook and TV separately. These plots show that in the aggregate, candidates for all levels of office spent more on television than on Facebook ads. In total, candidates spent about 10 times more on TV than on Facebook in 2018. However, the cross-office differential is compressed on the Facebook platform relative to television: the difference in typical spending between Senate or governor and state house races on Facebook is about two orders of magnitude, compared with closer to three on television.
Figure 2 examines the extensive rather than intensive margin of advertising, by medium. The panels plot the proportion of all candidates with nonzero spending on Facebook (2a) and TV (2b) ads, by office and incumbency status. The effect of Facebook’s relatively low cost in expanding access to advertising is clearly evident in the down-ballot races: less than 10% of state house and senate candidates advertised on television, whereas closer to 40% advertised on Facebook. Facebook also appears to narrow the incumbent–challenger gap in access in most offices. In fact, in the two farthest down-ballot categories, challengers were more likely to advertise on Facebook than their incumbent counterparts.Footnote 20
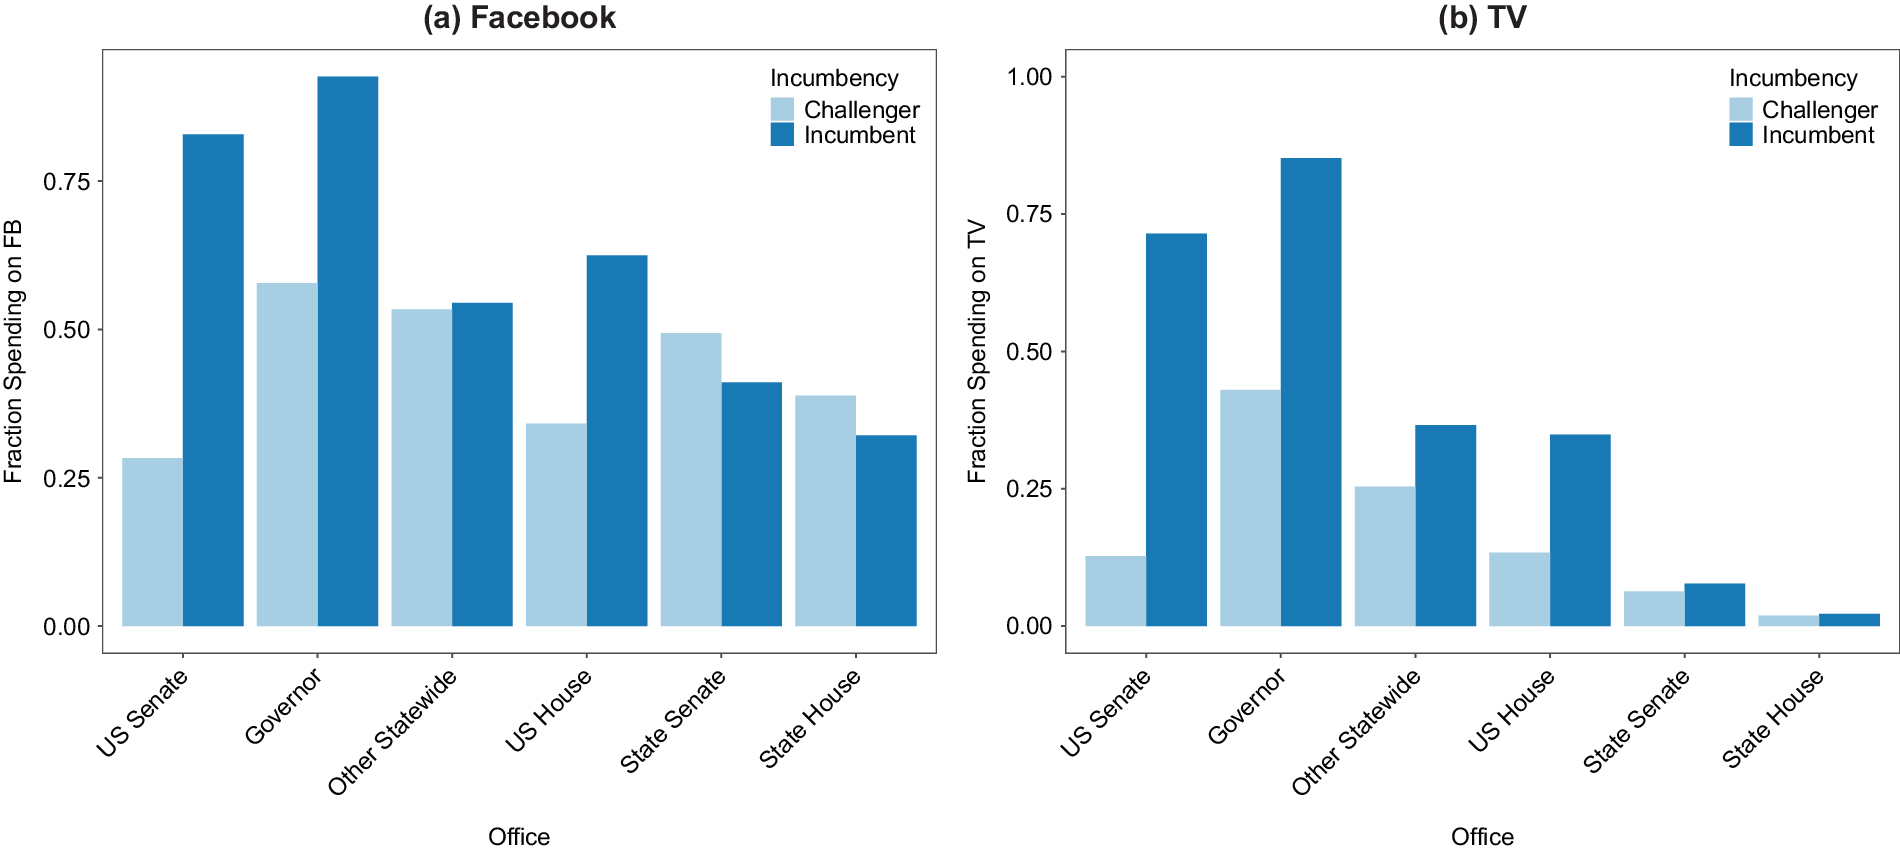
FIGURE 2. Fraction of Candidates with Positive Spending on Each Medium, by Office and Incumbency Status
As outlined earlier, our first research question concerns whether and how online advertising broadens the set of candidates who advertise. Figures A2 and 2 make clear that both the composition of candidates who advertise, and the level of expenditures they invest, are quite different across media. We show this in regression form in Table 1, in which the dependent variable is total advertising spending on Facebook or television between May 24, 2018, and Election Day.Footnote 21 We estimate the following regression with candidate fixed effects:
TABLE 1. Within-Candidate Regressions of Spending Levels on FB Indicator
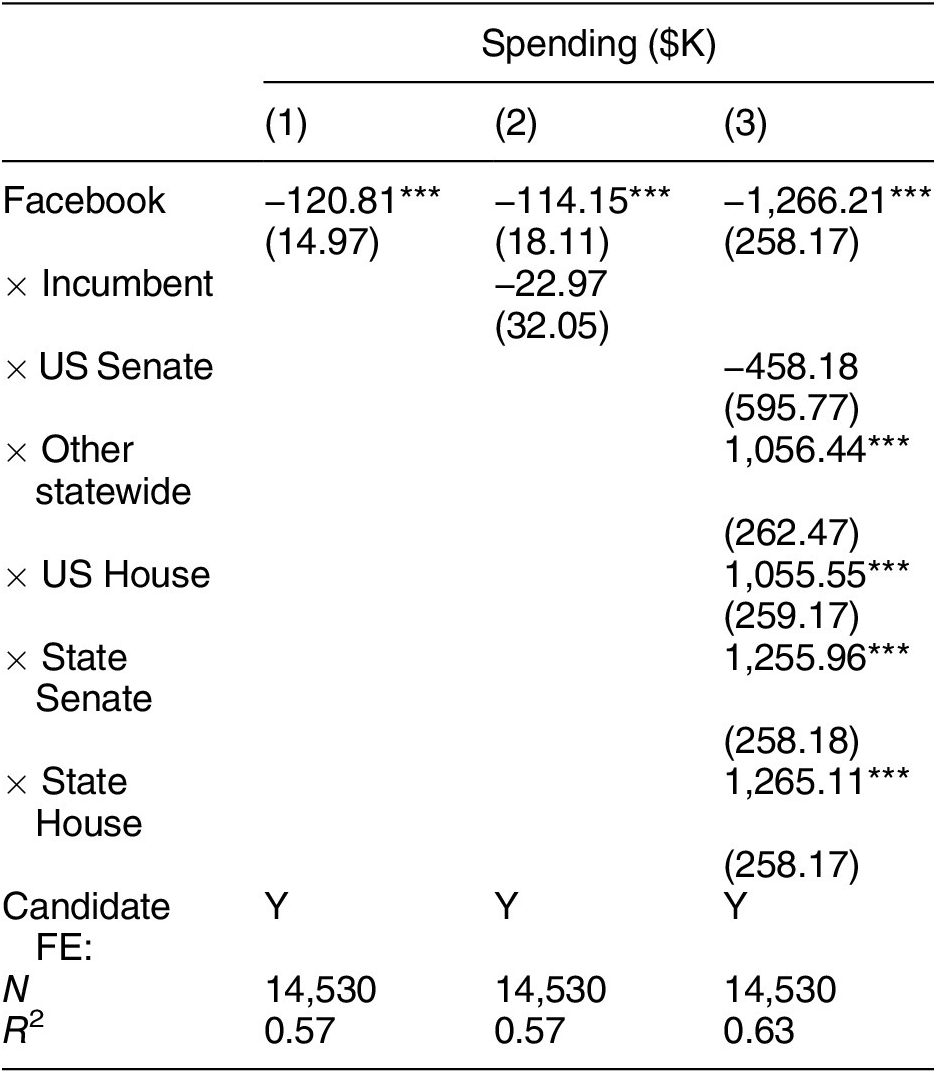
Note: Robust standard errors (clustered by candidate) in parentheses. An observation is a candidate × medium. The excluded category in column (3), which includes office interactions, is gubernatorial candidates. *** p < 0.01.
The dataset for this regression contains one observation for each candidate’s spending on television advertisements and one observation for each candidate’s spending on Facebook advertisements. The
![]() $$ {\alpha}_i $$
are candidate-specific fixed effects,
$$ {\alpha}_i $$
are candidate-specific fixed effects,
![]() $$ {Facebook}_k $$
is a binary indicator for whether the particular observation corresponds to Facebook advertising expenditures, and
$$ {Facebook}_k $$
is a binary indicator for whether the particular observation corresponds to Facebook advertising expenditures, and
![]() $$ {\varepsilon}_{ik} $$
is an idiosyncratic error term. The inclusion of the candidate fixed effects means that our estimates use only within-candidate variation to identify the Facebook effect
$$ {\varepsilon}_{ik} $$
is an idiosyncratic error term. The inclusion of the candidate fixed effects means that our estimates use only within-candidate variation to identify the Facebook effect
![]() $$ \gamma $$
.
$$ \gamma $$
.
![]() $$ {CandCovar}_i $$
is a row vector of candidate covariates: an indicator for whether the candidate is a challenger and indicators for the office sought by the candidate. These candidate covariates cannot be directly included in the regression specification because none of these characteristics vary within candidates and we include the candidate-specific fixed effects,
$$ {CandCovar}_i $$
is a row vector of candidate covariates: an indicator for whether the candidate is a challenger and indicators for the office sought by the candidate. These candidate covariates cannot be directly included in the regression specification because none of these characteristics vary within candidates and we include the candidate-specific fixed effects,
![]() $$ {\alpha}_i $$
, in the equation. We can, however, interact these covariates with the
$$ {\alpha}_i $$
, in the equation. We can, however, interact these covariates with the
![]() $$ Facebook $$
indicator to determine how these covariates are associated with the intensity of using Facebook advertisements relative to television advertisements. In this and all regressions reported in the paper, we cluster standard errors at the level of the candidate.
$$ Facebook $$
indicator to determine how these covariates are associated with the intensity of using Facebook advertisements relative to television advertisements. In this and all regressions reported in the paper, we cluster standard errors at the level of the candidate.
The first column of estimates in Table 1 shows that spending on Facebook ads is significantly less than spending on television ads. As the specification includes candidate fixed effects, this is not simply an artifact of differences in financial resources across the pools of candidates who advertise on each medium. The mean within-candidate difference is on the order of $100 thousand. The second column interacts the Facebook indicator with a dummy for incumbency; the point estimate is negative, indicating that the TV–Facebook gap in spending is larger for incumbents than for challengers, but this difference is not statistically different from zero. The final column of estimates reveals a clear gradient from top to bottom of the ballot; Senate and governor candidates spend well over $1 million more on television than on Facebook on average; the gap is closer to $200 thousand for US House and nongovernor statewide candidates, and zero for state house and state senate candidates.
Consistent with the idea of Facebook providing a large effective cost reduction, the most financially constrained candidates rely on Facebook more, relatively speaking, than candidates with typically less binding financial constraints. The existence of online advertising allows down-ballot candidates to make appeals to the voting public that they cannot afford to make on television. The existence of this platform, then, with a wide reach and low cost to entry, has facilitated new means of connecting with potential supporters.
Advertisement Timing and Geographic Targeting
We next examine how candidates differentially time the release of and geographically target their advertising on the two media. On timing, evidence suggests the persuasive effects of advertising are short-lived (Gerber et al. Reference Gerber, Gimpel, Green and Shaw2011), so advertisements whose goal is to persuade voters will have higher electoral returns as the election date approaches. Facebook ads may be used for a more diverse range of goals—such as fundraising—than are TV ads, so they may have higher value earlier in the campaign than TV ads.
Before moving to regression analysis, it is instructive to examine time trends in the raw data. Figure 3b shows the timing of advertising on TV (in dollar terms) between June 1 and Election Day. There is a steady ramp-up of spending as the election approaches.Footnote 22
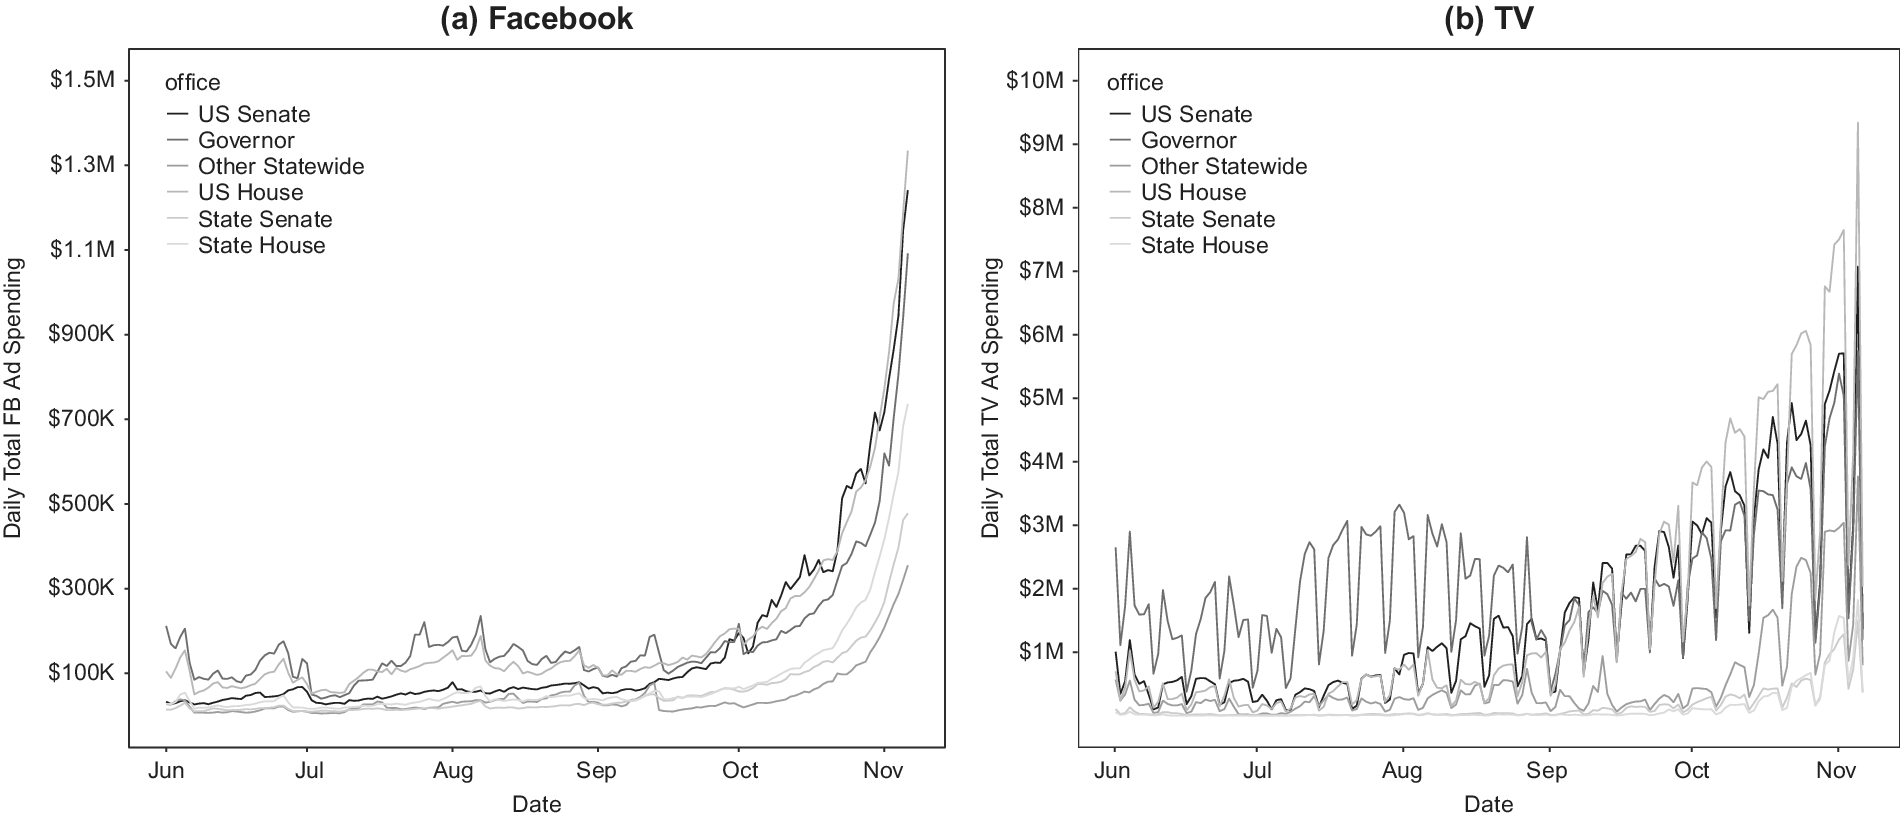
FIGURE 3. Daily Spending by Office over the Course of the Campaign
Figure 3a shows the same time trends on Facebook. The overall level is much lower, with even late campaign spending on Facebook lower than television spending in the summer months of 2018. But the relative pattern is even more skewed toward the end of the campaign than that on television. Across all offices, daily spending is flat from June until the end of September. Only in October does spending accelerate before reaching its peak on Election Day. Television spending, in comparison, begins its rise more than a month earlier.
One possibility is that congestion due to the fixed number of TV ad spots available in the later days of the campaign pushes TV spending earlier; congestion on Facebook is much less binding because the online platform does not have the requirement that all viewers on the platform at a given time see the same content. Another possibility is that the apparent pattern is due to compositional changes over time; perhaps the kind of campaigns that engage in both TV and Facebook advertising indeed use Facebook relatively early and TV relatively late, but there is a large group of Facebook-only advertisers who enter at the end of the campaign.
We address this question with a regression of the timing of campaign spending by medium, controlling for candidate fixed effects. We regress the quantity of spending on candidate fixed effects plus our medium indicator interacted with a full set of time-to-election dummy variables, defined weekly. The regression specification is described by the following equation:
The two sets of week fixed effects
![]() $$ {\eta}^{FB} $$
and
$$ {\eta}^{FB} $$
and
![]() $$ {\eta}^{TV} $$
correspond to advertising on Facebook and television respectively, and allow for general time patterns that flexibly differ between the two modes. This specification allows us to determine how online advertising’s relative intensity varies as the general election date approaches. Results are displayed graphically in Figure 4 and demonstrate that the TV/Facebook ratio is indeed increasing over time, as predicted; however, TV advertising dominates at all stages of the campaign. In other words, within candidate, TV advertising accelerates in the final months of the campaign at a faster rate than spending on Facebook.Footnote
23 This result suggests that the pattern in Figure 3 is less a function of differences in congestion across medium and more the result of over-time changes in the set of candidates advertising on each. Facebook-only advertisers also tend to be relatively light advertisers, and candidates with relatively low advertising budgets focus their spending (on all modes) toward the end of the campaign.
$$ {\eta}^{TV} $$
correspond to advertising on Facebook and television respectively, and allow for general time patterns that flexibly differ between the two modes. This specification allows us to determine how online advertising’s relative intensity varies as the general election date approaches. Results are displayed graphically in Figure 4 and demonstrate that the TV/Facebook ratio is indeed increasing over time, as predicted; however, TV advertising dominates at all stages of the campaign. In other words, within candidate, TV advertising accelerates in the final months of the campaign at a faster rate than spending on Facebook.Footnote
23 This result suggests that the pattern in Figure 3 is less a function of differences in congestion across medium and more the result of over-time changes in the set of candidates advertising on each. Facebook-only advertisers also tend to be relatively light advertisers, and candidates with relatively low advertising budgets focus their spending (on all modes) toward the end of the campaign.
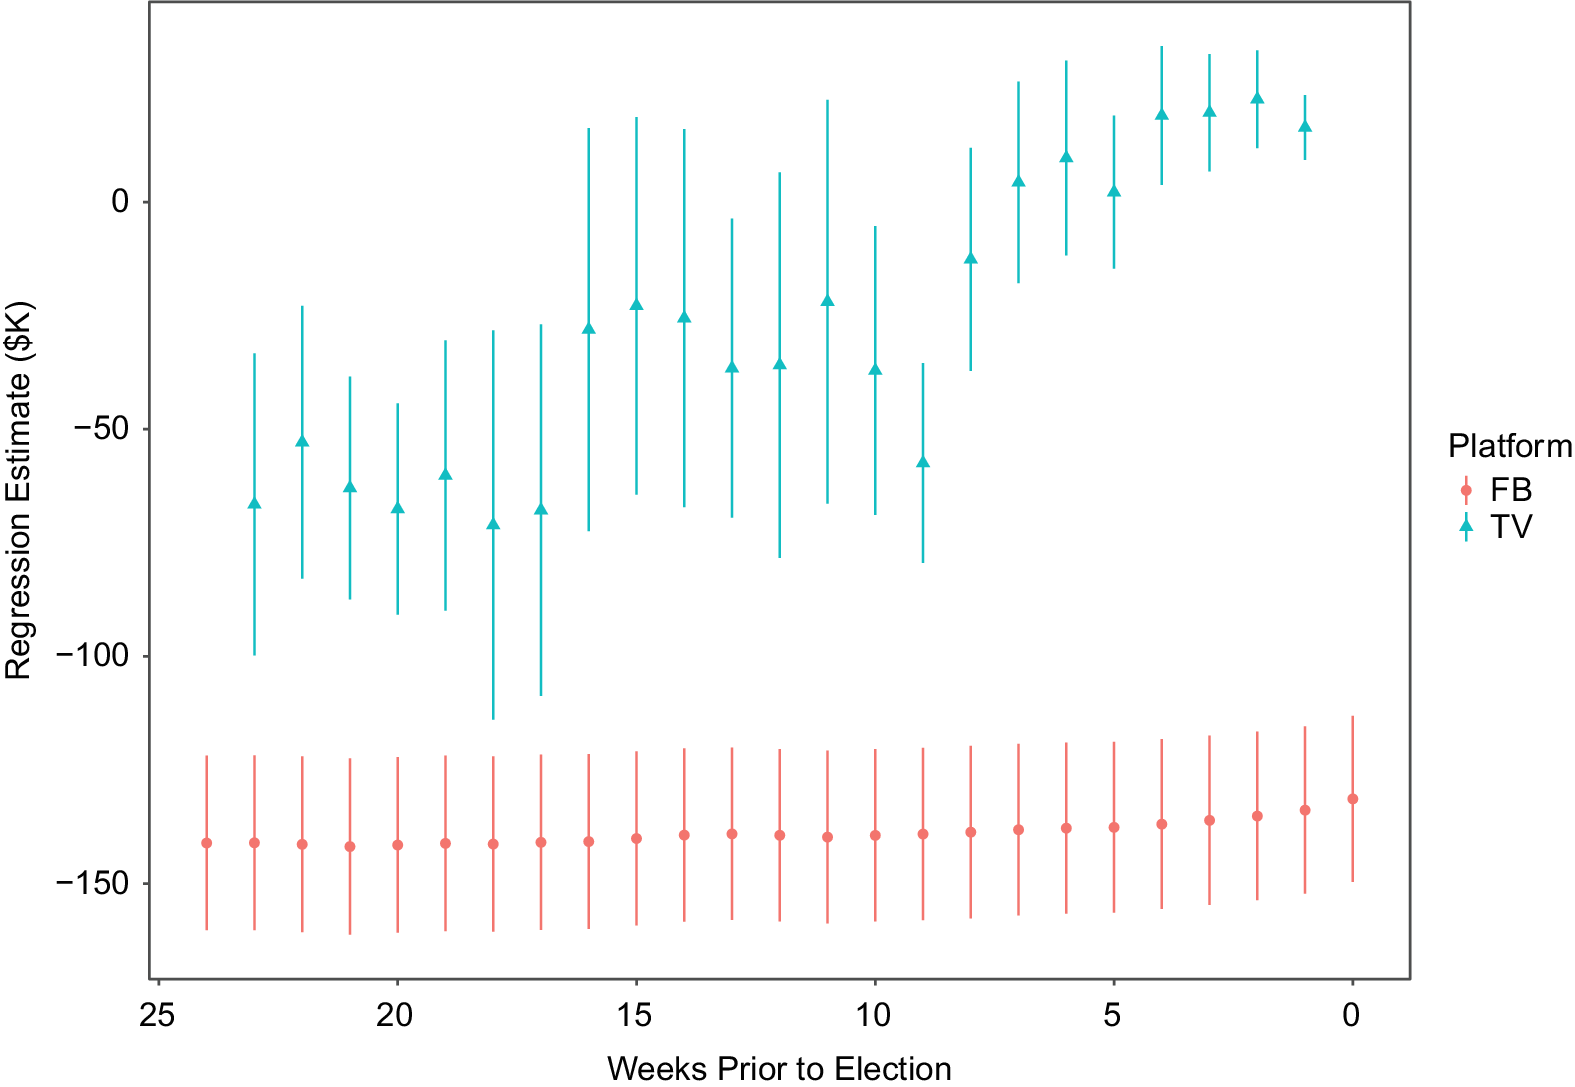
FIGURE 4. Regression Estimates of Weeks-to-Election Effects, by Medium
Next, we examine the spatial distribution of political advertisements, specifically the proportion of each candidate’s ads that are viewed by out-of-state residents. If Facebook ads are used for purposes other than voter persuasion or mobilization, then candidates may be more likely to use Facebook ads to target out-of-state voters, who cannot vote for the candidate but can contribute in other ways. At the ad level, we compute the fraction of impressions seen by users in the state in which the candidate is running for office.Footnote 24 We then aggregate to the candidate level by computing a weighted average, weighting by expenditures. Our estimating equation is:
The timing and spatial targeting effects might interact with one another. Campaigns may deploy their advertisements early and outside of their electoral constituencies in order to generate campaign resources. To investigate this possibility we estimate the following regression:
 $$ {\displaystyle \begin{array}{l}{PropOutState}_{itk}={\alpha}_i+{\beta}_1{DaysUntilGeneralElection}_t+\\ {}\kern7.12em {\beta}_2{DaysUntilGeneralElection}_t{Facebook}_k+\\ {}\kern7em \gamma {Facebook}_k+{\varepsilon}_{itk}.\end{array}} $$
Results, in Table 2, show that in fact Facebook ads are less likely to be seen by viewers outside the candidate’s state. This is true throughout the campaign, as the days-to-election trend is tiny and statistically insignificant.Footnote 25 Although some candidates are certainly using Facebook to appeal for donations from out of state residents, it appears that such candidates are a relatively small minority. The dominant effect of Facebook is that, by providing finer-grained geographic targeting than television media markets allow, candidates can waste fewer impressions over state lines.
TABLE 2. Within-Candidate Regressions of In-State Proportion on Medium
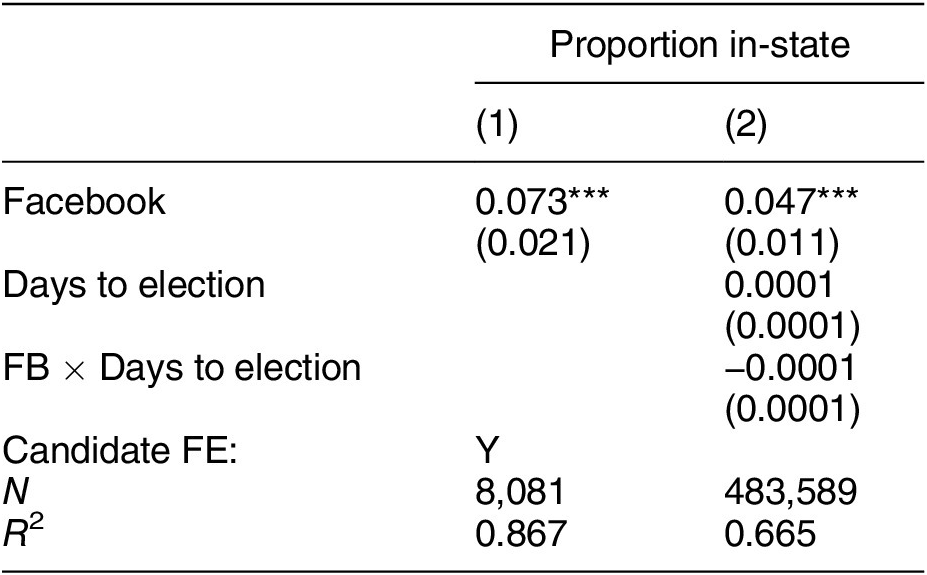
Note: Robust standard errors (clustered by candidate) in parentheses. An observation is a candidate × medium in column (1) and a candidate × medium × day in column (2). Proportion in-state is the expenditure-weighted average fraction of impressions reaching viewers in the state of the election. *** p < 0.01.
Finally, we examine how the level of congruence between a candidate’s electoral constituency and DMA influences the allocation of advertising across television and Facebook. Candidates who run in low congruence districts waste a larger portion of their television impressions when they advertise to audience members who cannot vote in the election than candidates who run in high congruence districts. As a result, we expect that candidates in low congruence districts will allocate more of their advertising expenditures to Facebook.Footnote 26 Because of the difficulty of calculating congruence at the state legislative district level, we restrict the analyses here to the sample of congressional and gubernatorial candidates.
The estimates in Table 3 indicate that the greater the congruence between the media market and the candidate’s electoral district, the less the candidate spends on Facebook, which is consistent with our expectations. Magnitudes are such that DMA congruence explains essentially all of the TV–Facebook differential estimated in Table 1 for congressional candidates: a congressional candidate running in a zero-congruence district would be predicted to spend about the same on both modes, whereas a candidate running in a perfectly congruent district would be expected to spend about $890 thousand less on Facebook. The large effect of congruence on spending suggests that television and Facebook advertising are close substitutes, as the effective price differential that candidates face explains a large amount of the variation in usage.
TABLE 3. Within-Candidate Regressions of Spending Levels on DMA Congruence
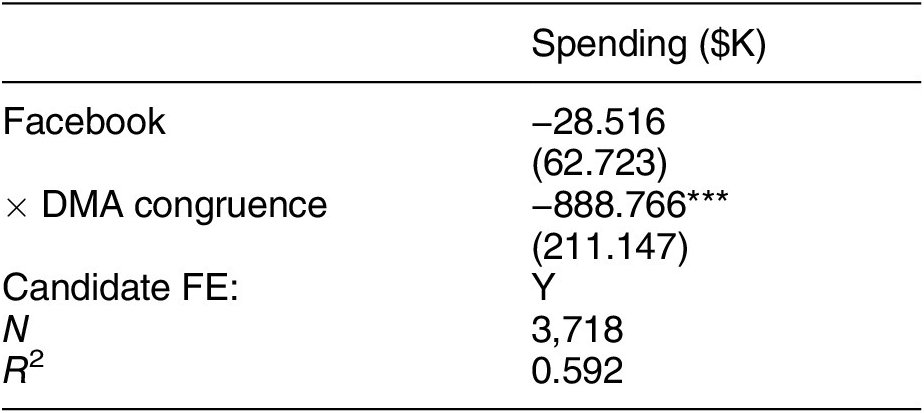
Note: Robust standard errors (clustered by candidate) in parentheses. An observation is a candidate × medium. Sample is restricted to US House, Senate, and statewide candidates. ***p < 0.01.
Advertisement Content
In this section, we move from utilization of advertising, in dollar terms, to the actual content of ads. We investigate the effects of the lower production costs and greater precision in audience targeting on the message that candidates present to voters. Our general expectations are that the first will allow for more experimentation and variation in messaging; the second will allow candidates to offer more polarizing messages.
Tone
As we noted earlier, scholars have long noted the potential of negative television advertisements to harm the sponsor through backlash effects (Roese and Sande Reference Roese and Sande1993). One reason why this might be the case is that the negative advertisements are viewed by citizens who are favorably disposed toward the candidate who is attacked in the advertisement. The differential ability to target online and offline advertisements raises the possibility that candidates may allocate their negative messaging to online platforms where they can more precisely control the audience for their messages.
To examine the tone of advertisements across television and online, we operationalize negativity through references to an opponent where ads that solely mention an opponent save for the sponsor name are classified as attack, ads that solely reference the favored candidate are positive, and ads that mention both candidates are contrast (Goldstein and Freedman Reference Goldstein and Freedman2002b). We estimate the following regression, with dependent variable,
![]() $$ {Tone}_{ik} $$
, equal to the candidate-medium average tone from the predictive model detailed in Appendix B:
$$ {Tone}_{ik} $$
, equal to the candidate-medium average tone from the predictive model detailed in Appendix B:
Again, the inclusion of candidate fixed effects (
![]() $$ {\alpha}_i $$
) eliminates differences in message content due to candidate-level fixed attributes such as district partisanship and demographics or race competitiveness, partisanship, and so on, any of which might correlate with the candidate’s propensity to use Facebook advertising. Because, as Figure 4 shows, the relative usage of the media also differs over the campaign and message content may evolve secularly over campaign time, we also estimate versions of the specification that control for candidate-week rather than candidate fixed effects, thus eliminating any confounding by within-candidate time trends of general form. We also estimate a version with fixed effects at the candidate-election (where election can be either the 2018 primary or general) level, controlling for possible confounding due to correlation of the primary season with Facebook use.Footnote
27
$$ {\alpha}_i $$
) eliminates differences in message content due to candidate-level fixed attributes such as district partisanship and demographics or race competitiveness, partisanship, and so on, any of which might correlate with the candidate’s propensity to use Facebook advertising. Because, as Figure 4 shows, the relative usage of the media also differs over the campaign and message content may evolve secularly over campaign time, we also estimate versions of the specification that control for candidate-week rather than candidate fixed effects, thus eliminating any confounding by within-candidate time trends of general form. We also estimate a version with fixed effects at the candidate-election (where election can be either the 2018 primary or general) level, controlling for possible confounding due to correlation of the primary season with Facebook use.Footnote
27
We are primarily interested in how the relative intensity of advertising tone differs across Facebook and television advertisements for the same candidate, which is captured by the coefficient
![]() $$ \gamma $$
. The interaction effects (
$$ \gamma $$
. The interaction effects (
![]() $$ \delta $$
) capture how this varies with candidate characteristics such as office or incumbency status.Footnote
28
$$ \delta $$
) capture how this varies with candidate characteristics such as office or incumbency status.Footnote
28
We indeed find differences in tone across media, with Facebook ads being significantly more positive than television ads (Figure 5). The magnitude of the effects are consistent across all three specifications of fixed effects, though standard errors widen as we get to finer-grained specifications. Furthermore, television ads are significantly more likely to be contrast or attack ads than are ads on Facebook. Advertising on Facebook is clearly more positive, even within the same candidate at the same time in the campaign cycle.
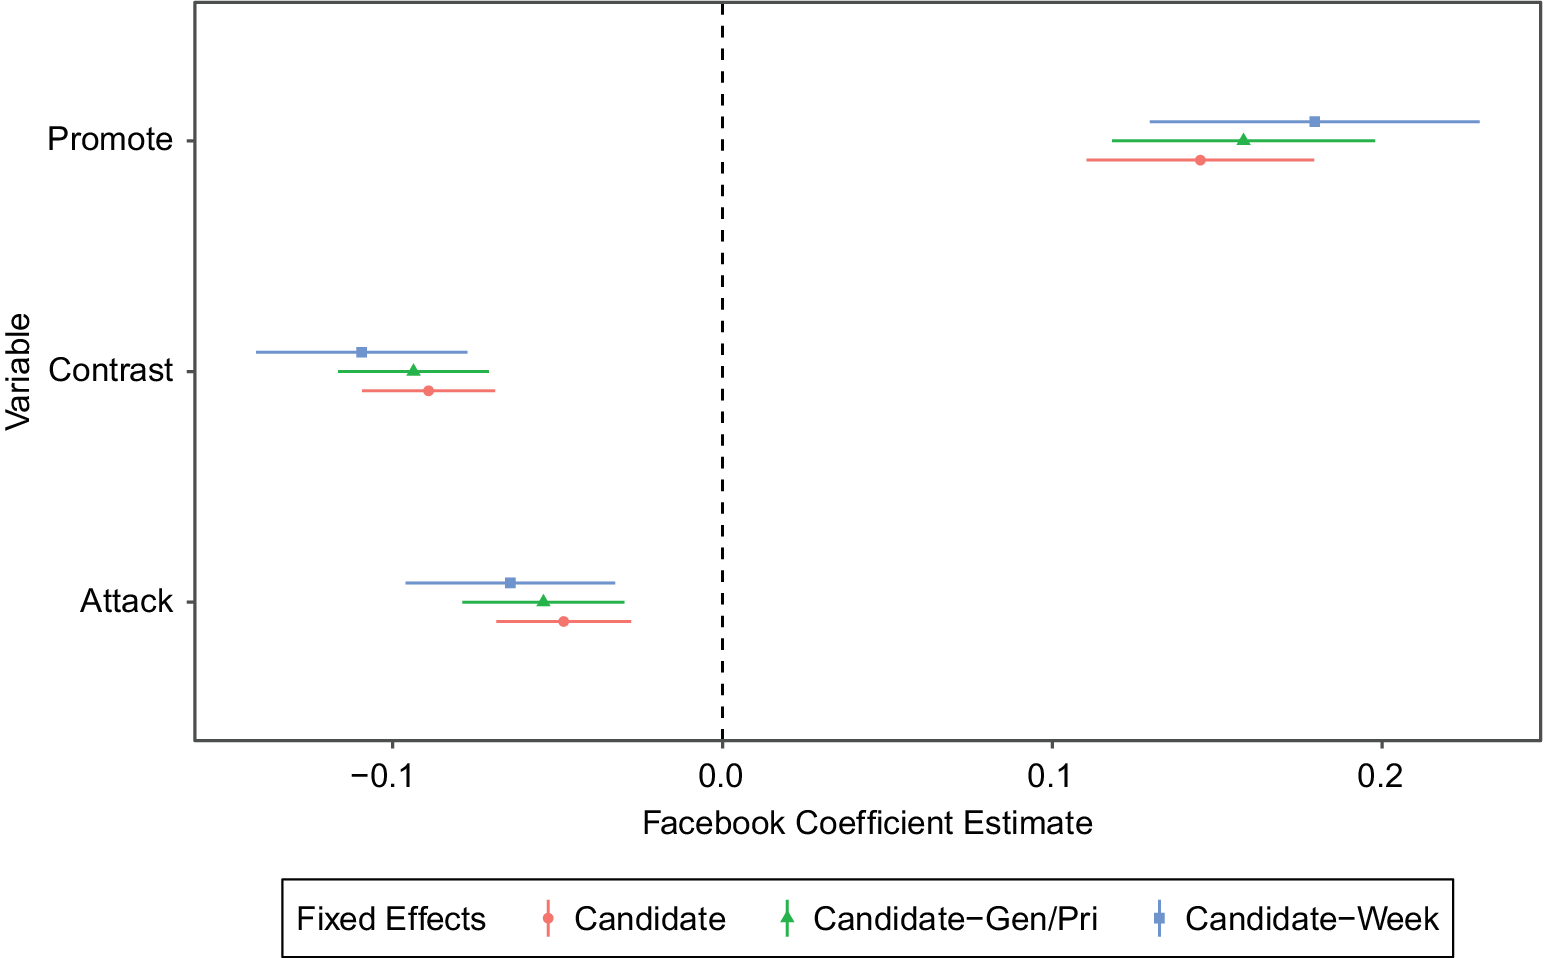
FIGURE 5. Effect of Facebook on Ad Tone, within Candidate
This result is more consistent with an account of negative ads as demobilizing to swing voters or supporters of the opponent (Ansolabehere and Iyengar Reference Ansolabehere and Iyengar1996; Krupnikov Reference Krupnikov2011) than with backlash effects. Because Facebook ads are often run to custom audiences that the campaign generates from their own lists of contributors and volunteers, the audience is likely to be friendlier on average to the candidate than a television audience. The fact that usage of attack ads declines rather than increases in this context implies that candidates prefer to show attack ads to opponents rather than to supporters, which comports with the demobilization but not the backlash account of negative ads.
Issue content
We use the same specifications to analyze the issue content of advertising across media. As detailed in the theory section, we expect that the ability to target ads to a narrower group of viewers than television allows may induce campaigns to message on more niche issue areas that would go unmentioned in a broad-audience ad. We focus on the set of issue areas defined by the WMPFootnote 29 and estimate regressions of the following form:
where
![]() $$ j $$
indexes issue areas, and
$$ j $$
indexes issue areas, and
![]() $$ {IssueScore}_{ik}^j $$
is the (expenditure-weighted) average predicted probability of mention of issue
$$ {IssueScore}_{ik}^j $$
is the (expenditure-weighted) average predicted probability of mention of issue
![]() $$ j $$
for ads sponsored by candidate
$$ j $$
for ads sponsored by candidate
![]() $$ i $$
on medium
$$ i $$
on medium
![]() $$ k $$
. As in the tone regressions, we also run analogous specifications where fixed effects are included at the candidate-week or candidate-election level.
$$ k $$
. As in the tone regressions, we also run analogous specifications where fixed effects are included at the candidate-week or candidate-election level.
Figure 6 shows the impact of medium on the likelihood that a variety of specific issues are mentioned in advertising. Estimates are almost uniformly negative. In any case where we can reject the null hypothesis of no difference at the 5% level, the difference is negative, and point estimates in the baseline specification with candidate fixed effects are positive (but substantively small) for only two issue categories, the environment and abortion. For important issue areas like the economy, health care, immigration, and education, the magnitudes are substantively large, in the range of 3–6 percentage points. This effect size is roughly a third to a half of the baseline predicted mention rate of these categories in the Facebook data (see Appendix A for summary statistics).
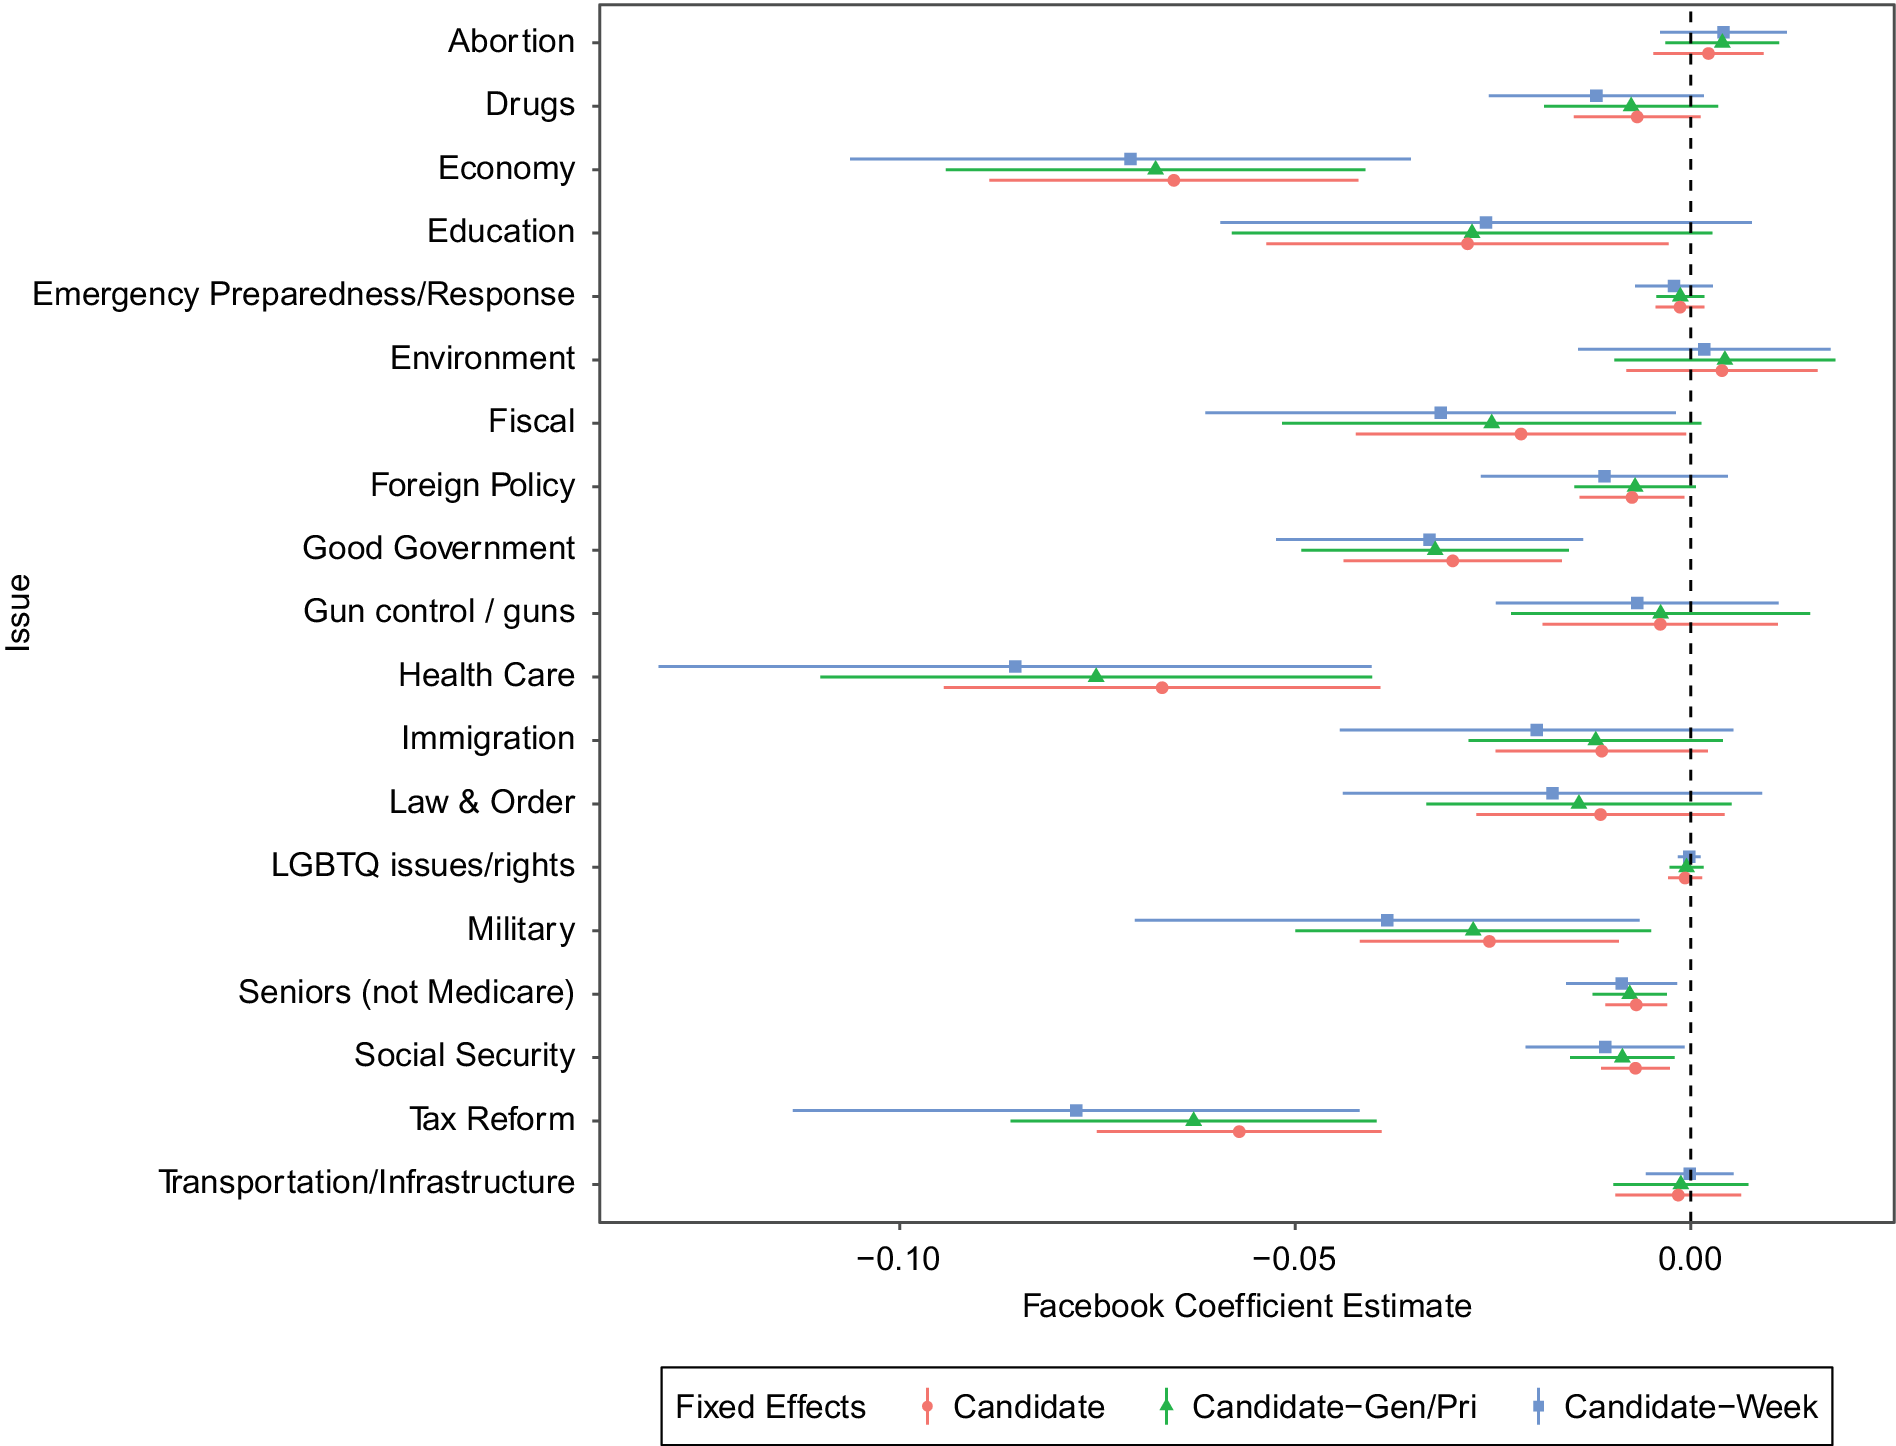
FIGURE 6. Effect of Facebook on Mention of Specific Issues, within Candidate
We also construct summary measures of the “issue diversity” of a candidate’s advertising, and the total share of advertising that references any policy issue (see Equation 7) (as opposed to advertising focused purely on candidate characteristics or experience). To measure issue diversity, we construct the Herfindahl–Hirschman index of a candidate’s advertising, which is the sum of squared shares of a candidate’s advertising devoted to each issue (expressed in Equation 8).
 $$ {AnyIssue}_{ik}=\frac{\sum_l\left({\max}_j{IssueScore}_{ik l}^j\right){Expenditure}_{ik l}}{\sum_l{Expenditure}_{ik l}} $$
 $$ {IssueHHI}_{ik}=\sum \limits_j{\left(\frac{\sum_l{IssueScore}_{ik l}^j{Expenditure}_{ik l}}{\sum_l{Expenditure}_{ik l}}\right)}^2 $$
We regress these measures on the same right-hand side variables described in the issue-specific regressions. We find that Facebook ads are approximately 10 percentage points less likely to mention one of our issue areas than are television ads. However, the within-candidate issue HHI does decline by a small amount, indicating that Facebook ads have lower issue concentration (i.e., greater issue diversity) than do television ads by the same candidate (Figure 7).
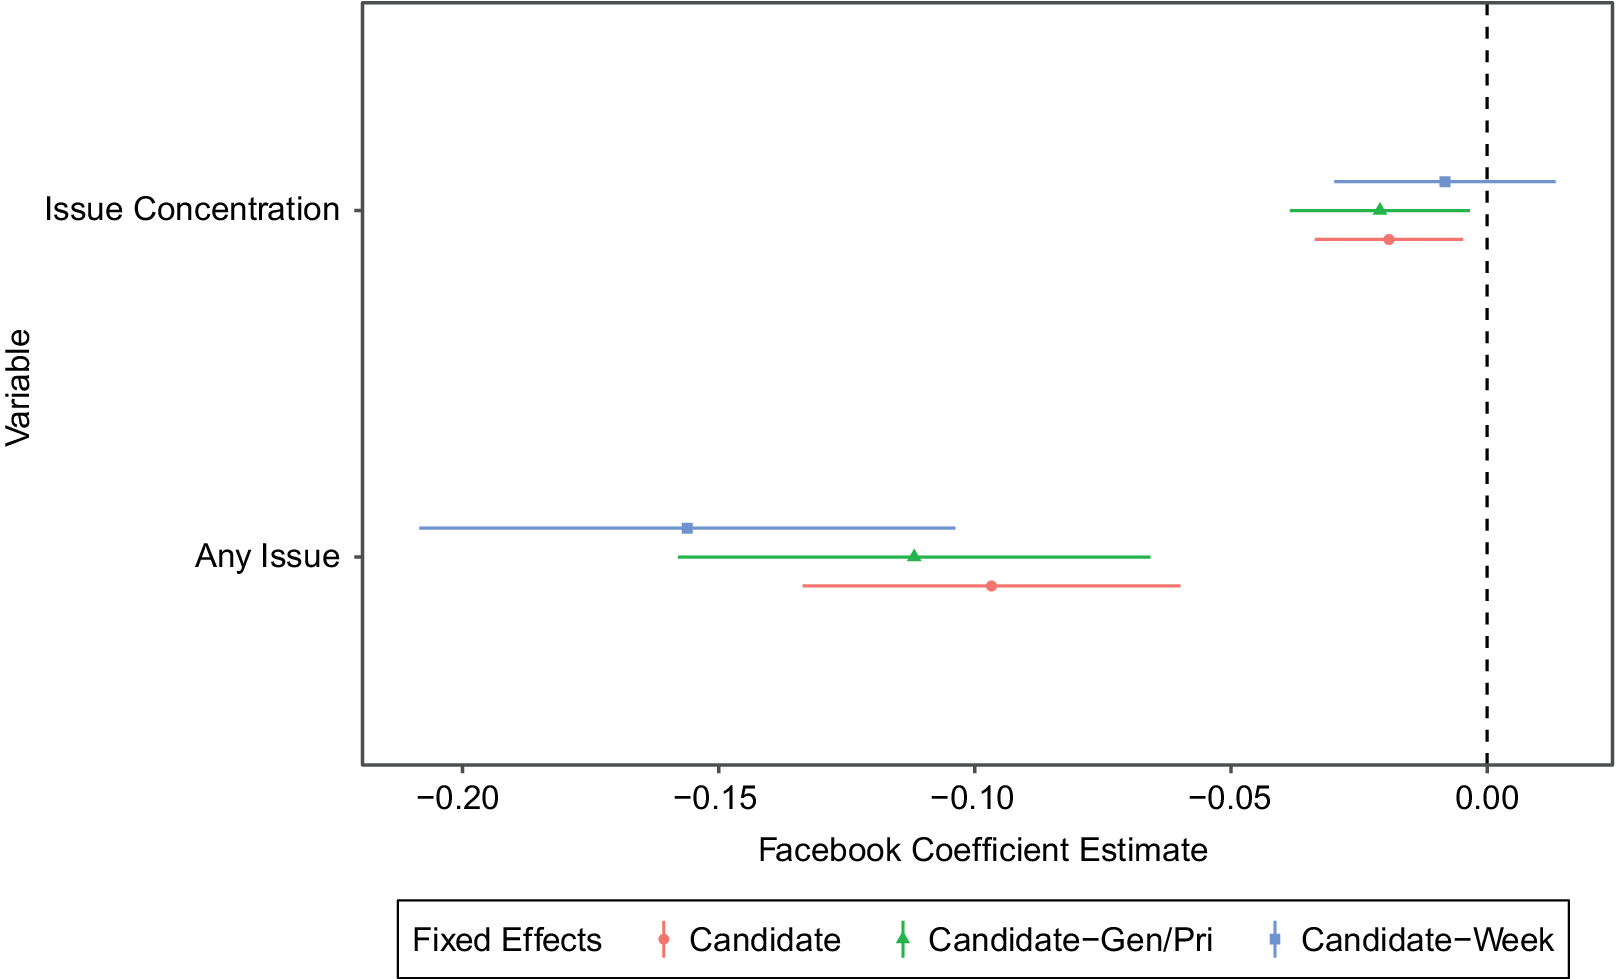
FIGURE 7. Effect of Facebook on Issue Diversity, within Candidate
Taken together, results on issue content suggest that Facebook does allow candidates to broaden the set of issues they touch on in their advertising, but that this effect is swamped by an overall decline in total issue content. As the proportion of attack advertising also declines, this result is consistent with the Geer (Reference Geer2006) result on the greater factual content of negative ads. It appears that candidates use Facebook’s targeting capabilities not to take positions on controversial public policies for narrowly targeted audiences but instead to focus on purely promotional, valence-oriented ads aimed at mobilizing their base of existing supporters.Footnote 30
The reasons for this are unclear, though we can speculate. One possibility is that with TV ads, campaigns get 30 seconds of a viewer’s attention whereas with Facebook ads, which users can easily scroll past, a campaign may only have a few seconds to capture the viewer’s attention, and thus it may be difficult to deliver more complex and issue-focused messages.Footnote 31 It is also possible that the diversity of goals on Facebook (e.g., email acquisition and fundraising) ends up watering down the issue content.
Party and Ideology
We next examine the effect of Facebook on the partisanship and ideological polarization of messages contained in campaign ads, using the same within-candidate design as was used to examine effects on the other content outcomes.Footnote 32 Numerous popular accounts and some scholarly research (Lelkes, Sood, and Iyengar Reference Lelkes, Sood and Iyengar2017) point to internet access and online communication as generative of a more polarized and aggressively partisan political discourse. We have the opportunity to test whether candidate-sponsored messaging is more clearly partisan or polarized on ideological lines online (on Facebook) as compared with TV, holding candidate attributes fixed.
Political ads do not, of course, generally come with an ideological label; the ad’s ideological location must be inferred from its content. Candidates more often than not avoid explicit party labels in advertising (Neiheisel and Niebler Reference Neiheisel and Niebler2013), but voters can use other cues to infer partisanship (Henderson Reference Henderson2019). Analogous to the application in Gentzkow, Shapiro, and Taddy (Reference Gentzkow, Shapiro and Taddy2019) to politicians’ speech in Congress, we seek to measure the distinctiveness of an ad’s content along party lines. Does it use words or phrases that are used disproportionately by elected officials of one party? Do its choices of images and political references make it easy or difficult for viewers to infer the party or left-right positioning of the sponsor?
To operationalize this idea, we fit classification models of the party label of an ad’s sponsor, and the ad’s donation-based ideology score (CFscore), on the same set of ad features we used to predict issue content and tone. This is a much easier problem than predicting issue content, as the party label is observed for all candidates in the case of party, and nearly all federal candidates in the case of CFscore. The predicted value from these models become the basis for outcome variables in within-candidate regressions. The interpretation of these variables is simple: a score of 0.99 on our party measure, for instance, indicates that our model is almost certain that the ad was run by a Republican candidate. A score of 0.5 on our CFscore prediction indicates that the model expects on the basis of the ad’s features that the ad sponsor has CFscore of 0.5.
To measure whether Facebook encourages candidates to take more partisan or ideologically extreme stances in advertising, we take the absolute value of the party and CFscore predictions and average within-candidate medium (again weighting by expenditures). We also compute the standard deviation of the party and CFscore predictions within candidate (also weighted by expenditure) as a measure of the degree of within-candidate heterogeneity in presentation. A candidate with a consistent ideological message throughout all their ads will have low standard deviations of these measures, whereas a candidate offering a liberal-friendly message to liberal audiences and a conservative-friendly message to conservative audiences will have high standard deviations. We estimate the same within candidate (or within candidate-week or candidate-election) specifications as on the other outcome measures to rule out the possibility that the mixture of advertisers differs across media on the ideological dimension.
Our regression results, displayed in Figure 8, show that Facebook increases both the extremism and the variability of ideological positioning within candidates on both measures. The substantive size of the effect on the extremism measures is fairly large. On CFscore, the difference between cochair of the House Progressive Caucus Pramila Jayapal (CFscore = -1.59) and cochair of the House Problem Solvers Caucus Josh Gottheimer (CFScore = -0.94) is about 0.65 points. The estimated Facebook effect in our main specification is about 0.125 points, or roughly 20% of this difference between prominent members of the progressive and moderate wings of the Democratic caucus. We emphasize that this is a within-candidate effect.Footnote 33
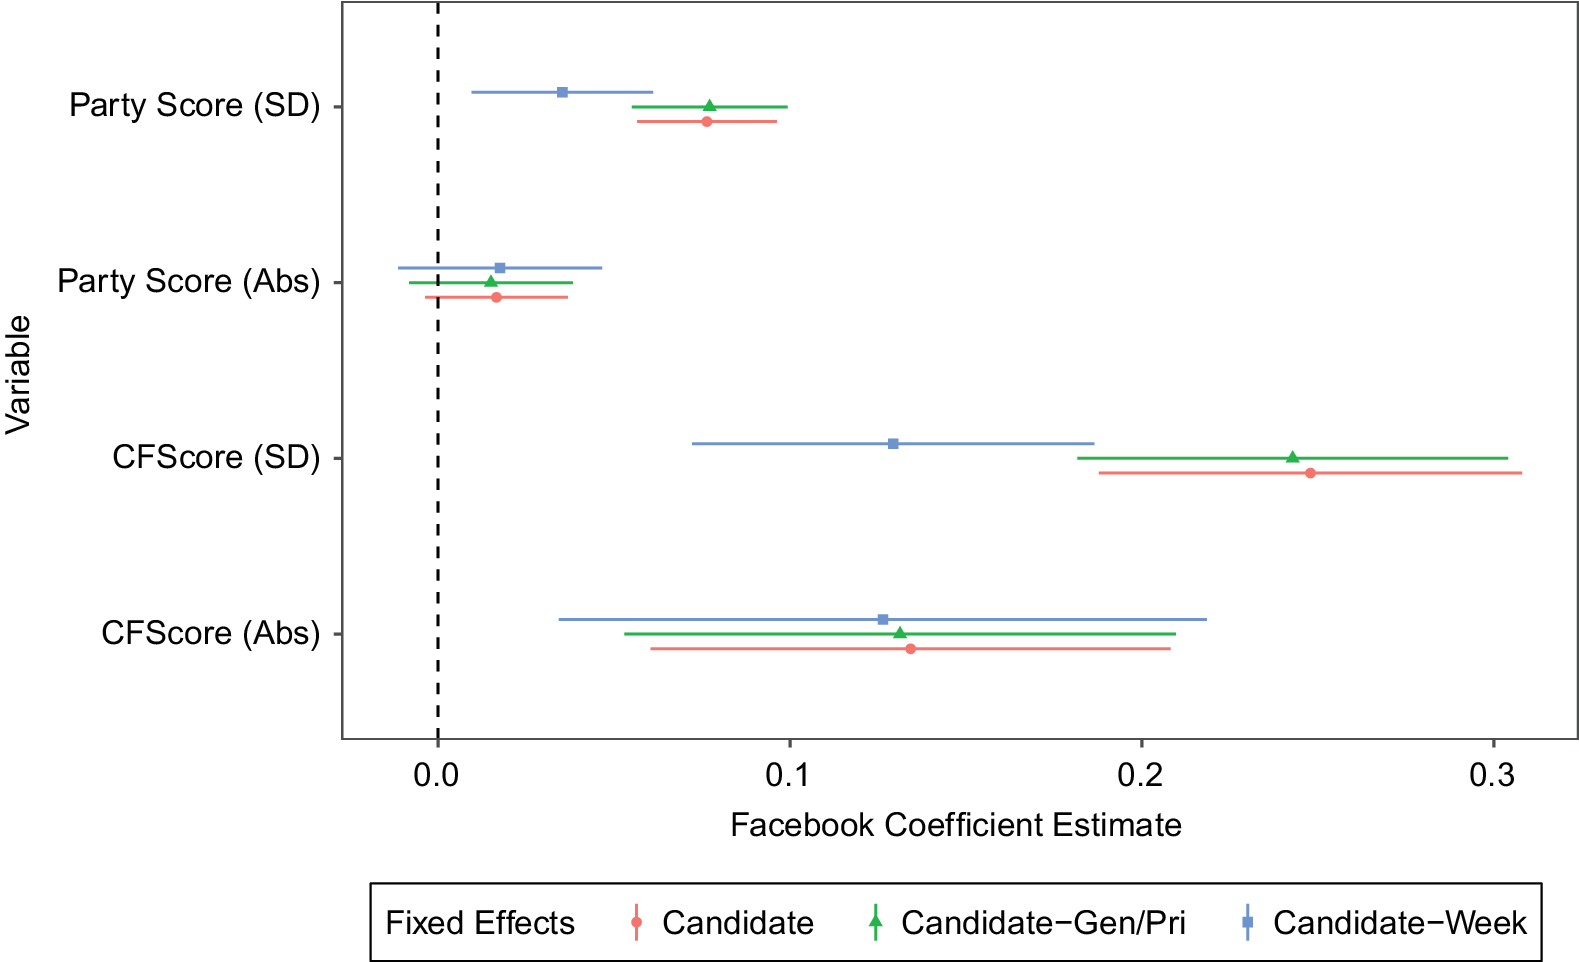
FIGURE 8. Effect of Facebook on Predictions of Party and Campaign-Finance-Based Ideology Score, within Candidate
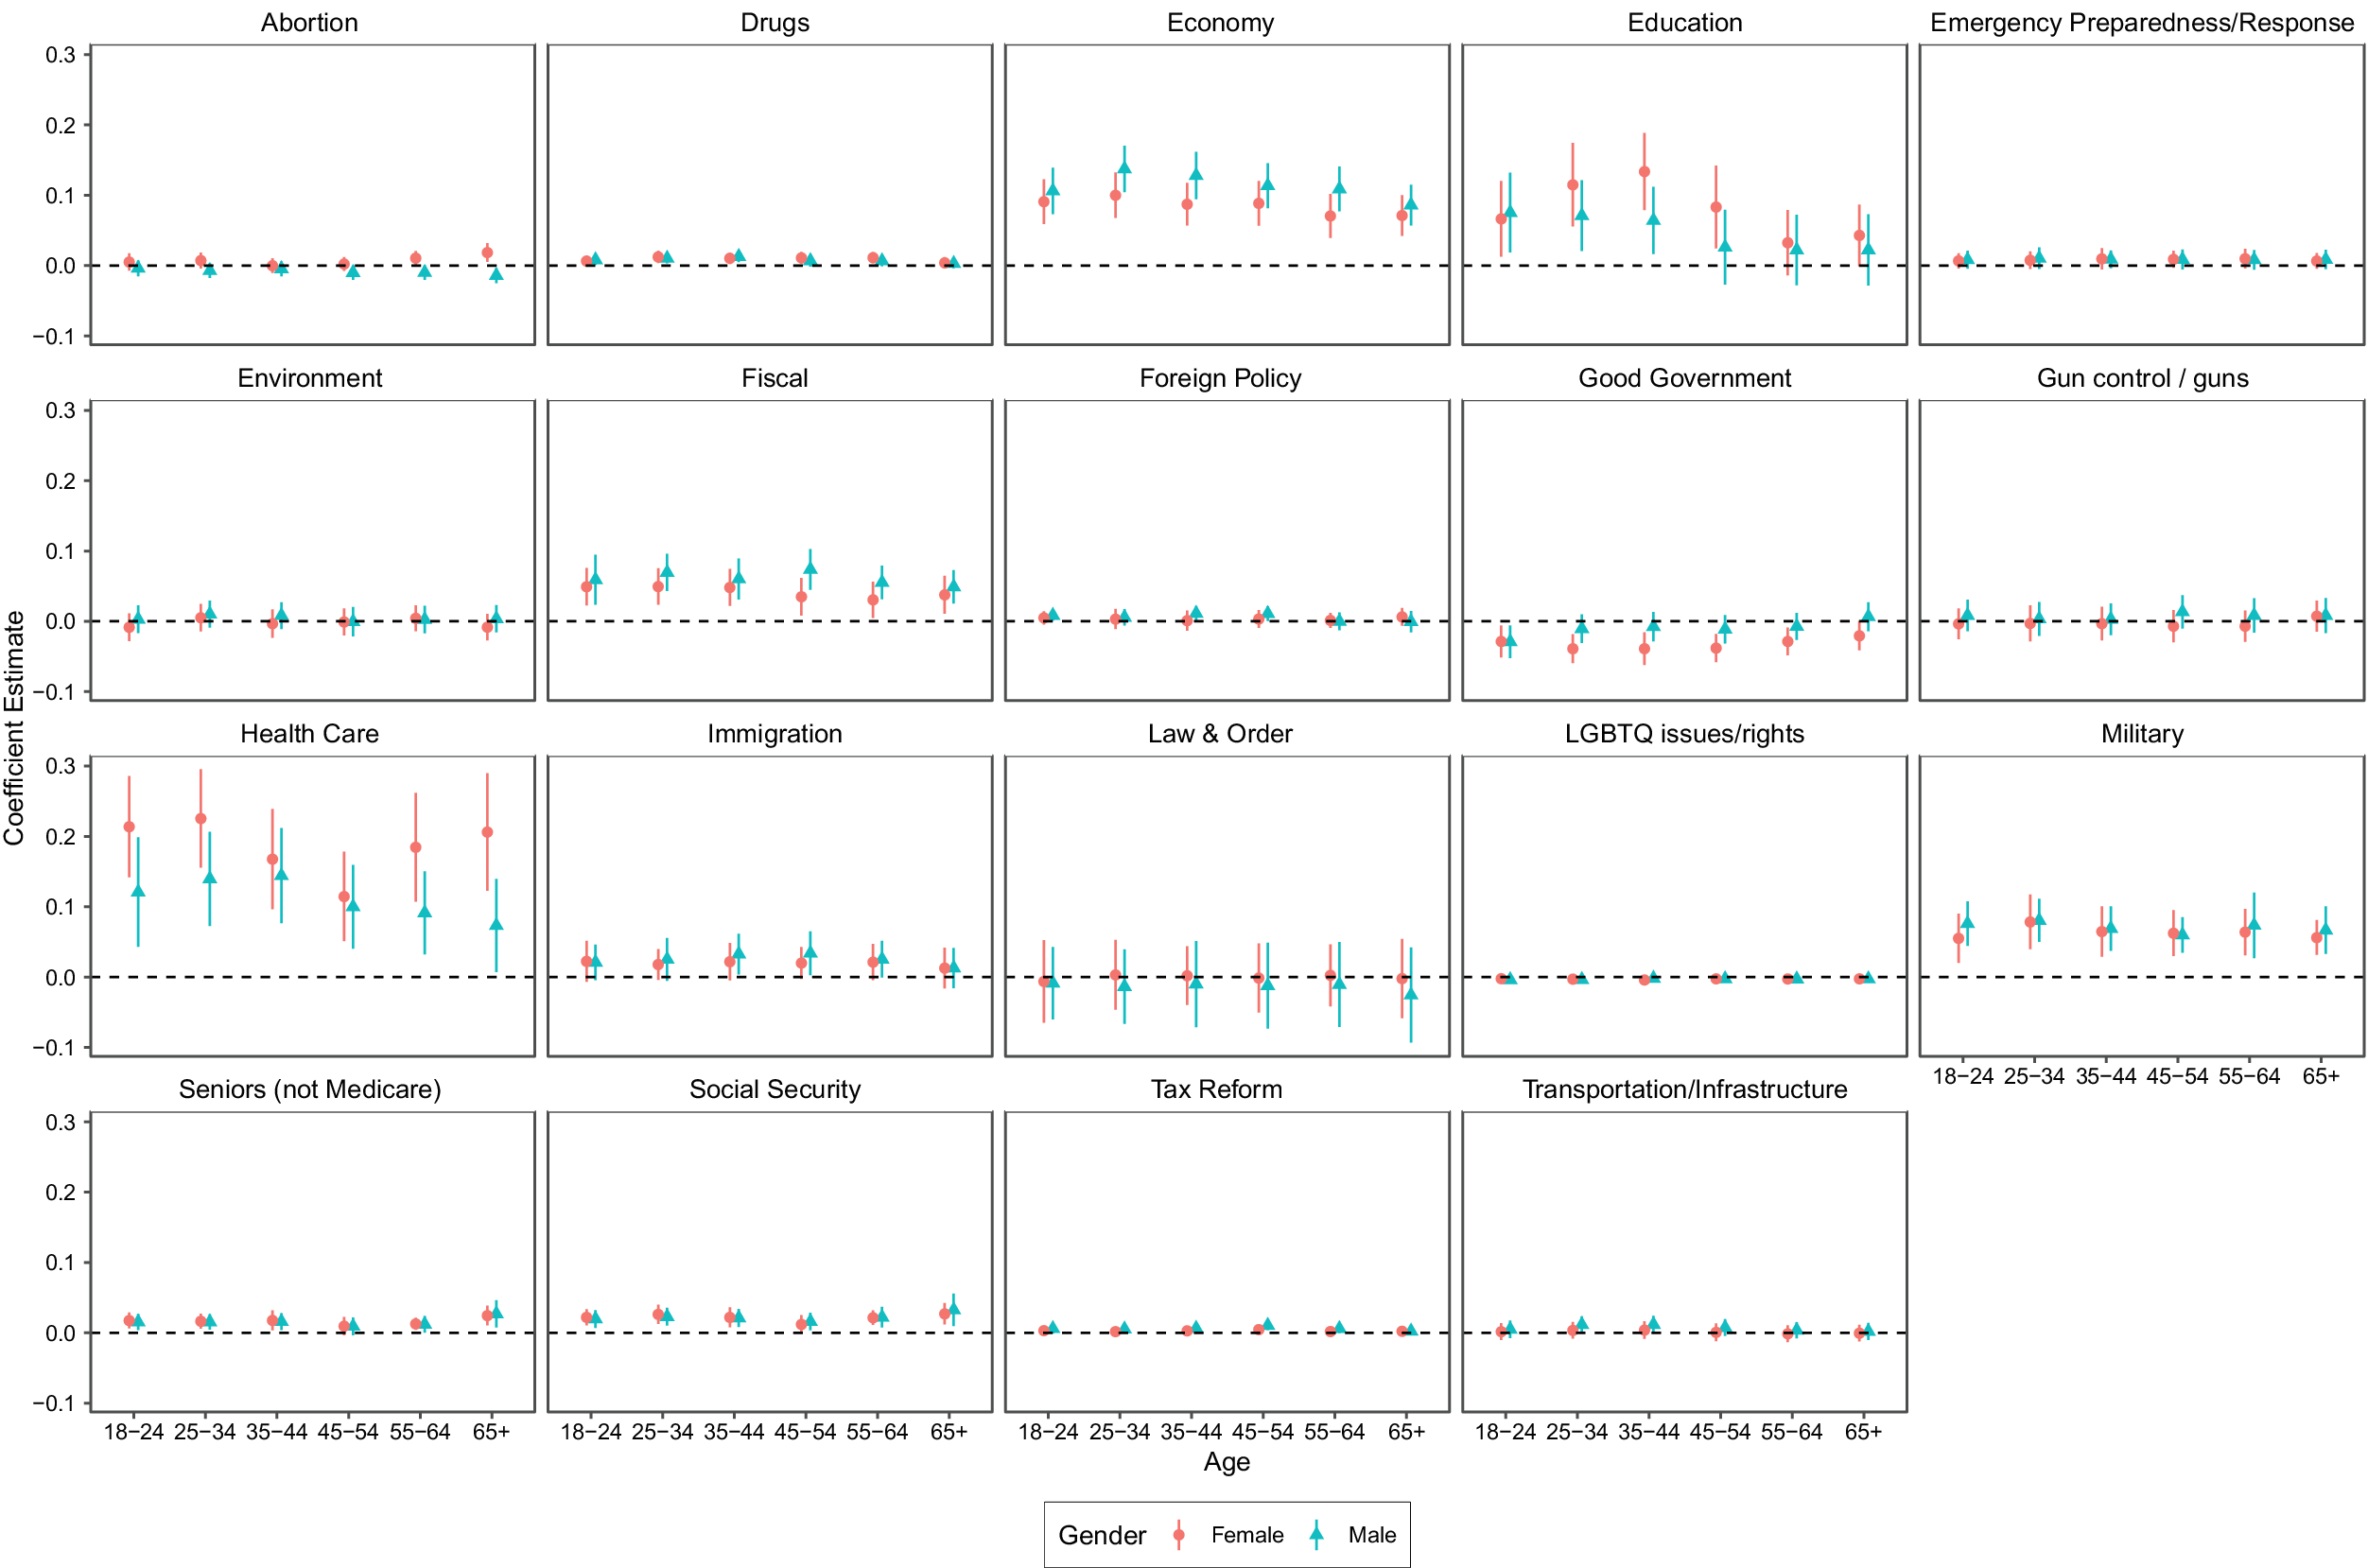
FIGURE 9. Regression Coefficients of Predicted Ad Issue Content on Audience Demographic, within Candidate.
The party score effect is smaller and the confidence interval overlaps zero. For comparison, Jayapal’s Facebook ads have average predicted probability of Republican sponsorship of 0.02, translating to a party extremism score of
![]() $$ \mathrm{abs}\left(0.02-0.5\right)=0.48 $$
. Gottheimer’s Facebook ads have a corresponding probability of 0.21 or extremism score of 0.29,Footnote
34 for a difference of 0.19. Our point estimate of the effect on the party extremism score is about 0.02 or about 10% of the Jayapal-Gottheimer difference.
$$ \mathrm{abs}\left(0.02-0.5\right)=0.48 $$
. Gottheimer’s Facebook ads have a corresponding probability of 0.21 or extremism score of 0.29,Footnote
34 for a difference of 0.19. Our point estimate of the effect on the party extremism score is about 0.02 or about 10% of the Jayapal-Gottheimer difference.
Message Segmentation on Facebook
Finally, we examine how candidates varied with characteristics of the viewing audience on Facebook.Footnote 35 We ask whether, holding the candidate sponsor fixed, issue content, tone, or ideological positioning vary according to the audience receiving the message. Although the Facebook database provides only a fairly crude set of audience characteristics—age, gender, and state of residence—these nonetheless correlate with issue positions, issue interest and attention, and ideological or partisan preferences (Aldrich et al. Reference Aldrich, Carson, Gomez and Rohde2019). We estimate specifications of the following form:
where
![]() $$ y $$
is an outcome variable (one of the issue, tone, or ideological predicted values introduced previously),
$$ y $$
is an outcome variable (one of the issue, tone, or ideological predicted values introduced previously),
![]() $$ l $$
indexes ad spots, and
$$ l $$
indexes ad spots, and
![]() $$ i $$
indexes candidates.
$$ i $$
indexes candidates.
![]() $$ {\alpha}_i $$
is a candidate fixed effect, and
$$ {\alpha}_i $$
is a candidate fixed effect, and
![]() $$ {x}_{il} $$
is a vector of audience impression shares across demographic groups.
$$ {x}_{il} $$
is a vector of audience impression shares across demographic groups.
![]() $$ \beta $$
is the vector of coefficients of interest capturing the correlation between, for example, the share of the audience for an adFootnote
36 that is female and between the ages of 18 and 25, and the ad’s predicted probability of mentioning an education issue. Our specification of
$$ \beta $$
is the vector of coefficients of interest capturing the correlation between, for example, the share of the audience for an adFootnote
36 that is female and between the ages of 18 and 25, and the ad’s predicted probability of mentioning an education issue. Our specification of
![]() $$ x $$
is maximally flexible, given the data available: we allow for separate coefficients for each gender-age cell.
$$ x $$
is maximally flexible, given the data available: we allow for separate coefficients for each gender-age cell.
Several interesting patterns emerge as shown in Figure 9. Education issues are viewed by more users, especially female users, in the 25–44 age range. Health care is more prominent in ads seen by female users and by users in either the two oldest or two youngest age cohorts. Economic and fiscal policy issues get more mention in ads viewed by male users, particularly those in the middle age cohorts. Coefficient magnitudes can be interpreted as predicted change in message for a 0 to 1 change in the audience share of the corresponding demographic cell. That is, an ad whose audience was exclusively men ages 18–25 would be expected to be about 10 percentage points less likely to mention health care than an ad whose audience was exclusively women ages 18–25. These effects are quite large relative to the mean incidence of the issue tags in the data.
Again, these estimates all include candidate fixed effects, so we are not simply picking up differences in constituency characteristics (e.g., that candidates representing older districts might run more ads mentioning Social Security). These are differences in the way that the same candidate’s message is selectively presented to voters. Because we only have impression (not targeting) information and Facebook’s ad delivery mechanisms can result in vast differences between which ads are seen by different audiences (Ali et al. Reference Ali, Sapiezynski, Bogen, Korolova, Mislove and Rieke2019), it is not possible to determine whether these differences are also in part due to the way candidates are targeting particular voters.
We run the same analysis on ad-level estimated partisanship. Results are presented in the same format in Figure 10. Results indicate that male audiences are more likely to see ads where candidates present themselves as more right wing (higher values on either the CFScore or Republican probability scale). Given the gender gap in partisanship (Aldrich et al. Reference Aldrich, Carson, Gomez and Rohde2019), this suggests either that candidates are pandering to audience preferences on this dimension or that Facebook’s algorithms are delivering this content. However, the relationship to audience age, which also correlates with party ID and voting, is weak.
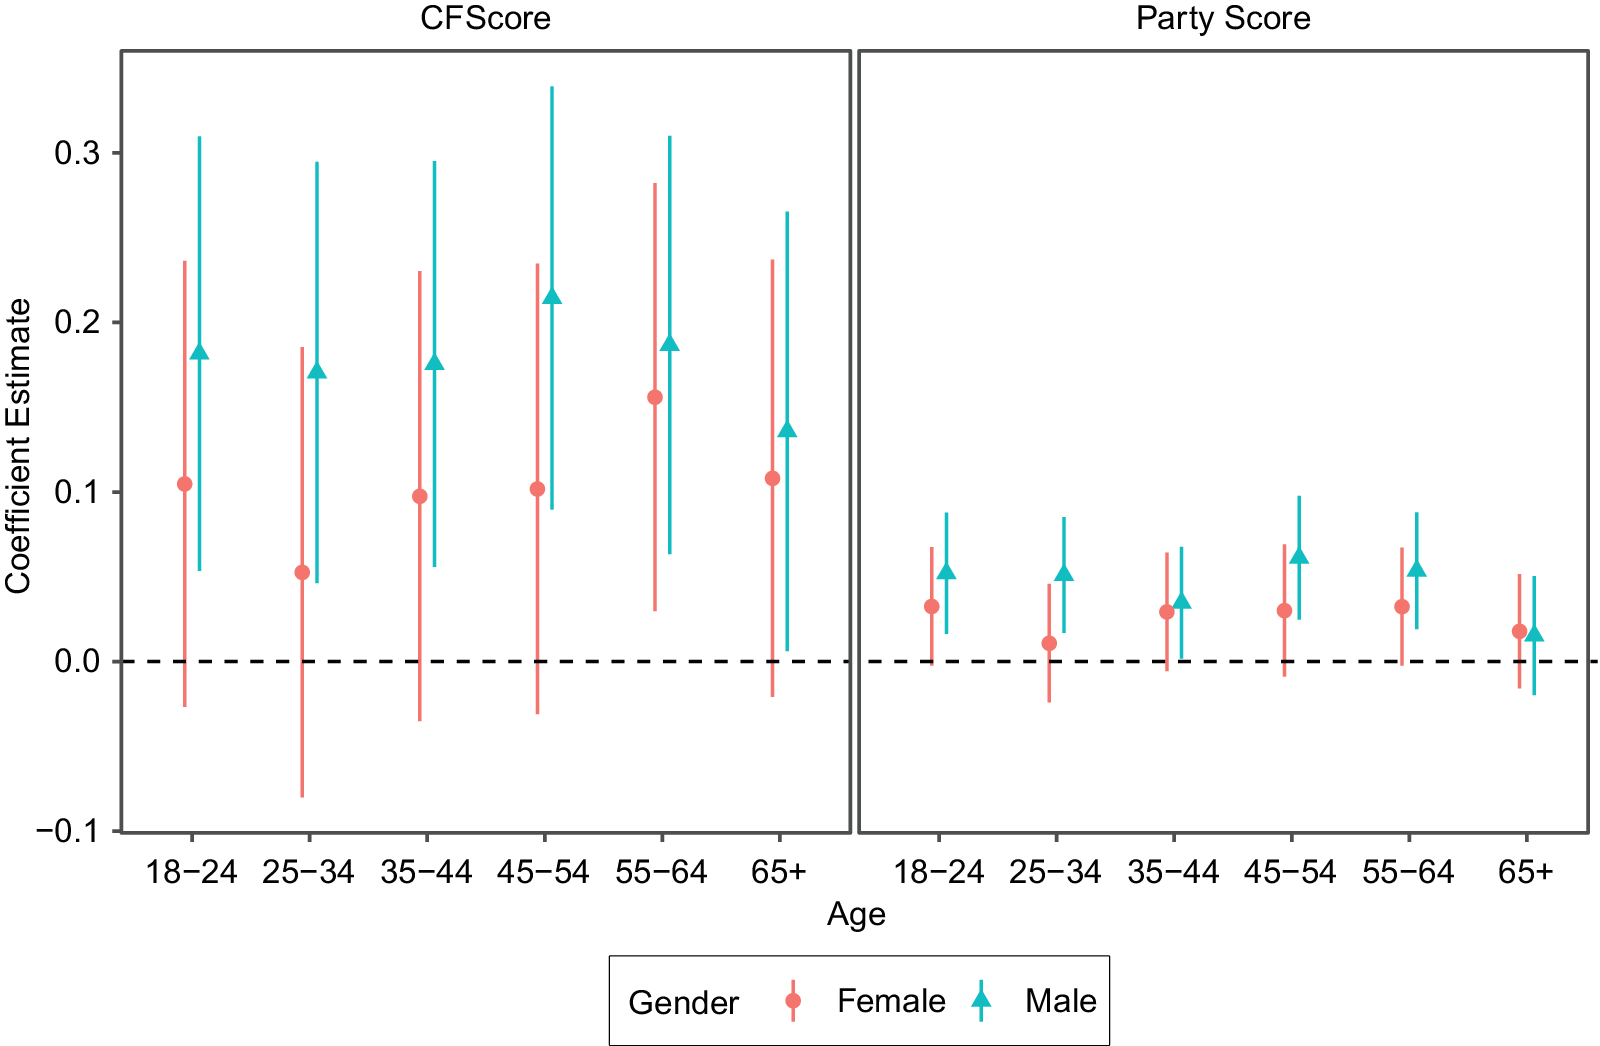
FIGURE 10. Regression Coefficients of Predicted Ad Ideology and Partisanship on Audience Demographic, within Candidate.
IMPLICATIONS
This analysis is the first comprehensive accounting of advertising on Facebook by political candidates up and down the ballot and the first to examine how campaigns use Facebook and television advertising. We examined not only the aggregate differences across candidates but also within-candidate differences in spending and content across online and television media. Our analysis reveals important differences in how campaigns use these media. We conclude by briefly discussing the implications of our main findings for American democracy and articulating an agenda for future research.
The ability to create and deploy advertisements in small cost increments online has a dramatic impact on which candidates use paid advertising. Our findings tend to support the equalization side of the debate over whether new technologies enable less-resourced candidates to compete with those who have traditionally had more resources. Facebook does not enable challengers to compete ad for ad with incumbents, especially in the races at the top of the ballot, but it does seem to create a more even playing field than television. Voters see proportionately more Facebook ads from challengers and down-ballot candidates relative to television. Moreover, the finding that candidates rely on Facebook more when the television media market is incongruent with their district shows that citizens who reside in these districts likely learn more about these candidates than if TV were the only medium available. Our analysis suggests that voters are exposed to advertising from a wider set of candidates than if Facebook did not exist. Facebook appears to foster more intense electoral competition, which may increase citizen awareness of state and local candidates and candidates running for office in electoral constituencies that are incongruent with television markets. These are largely positive developments for American democracy.
Our findings also address the tone of the campaign to which voters are exposed. In spite of the Internet’s reputation as an uncivil cesspool, a world of online advertising does not necessarily mean more negative politics. In fact, advertising on Facebook engages in significantly less attacking of the opponent than advertising on television.Footnote 37 There is a robust scholarly debate about the consequences of negative advertising for citizen knowledge, participation in politics, and attitudes toward the political process. For those who ascribe to the view that negative advertisements demobilize and increase cynicism among voters, the lower level of opponent-attack advertising on Facebook is reassuring. The decrease in negativity, however, comes with a cost: online advertising has less issue discussion than on television. Advertisements are an important tool for increasing citizens’ issue knowledge and holding politicians accountable for their policy choices in office. A shift away from television and towards social media advertising may thus reduce this component of voters’ knowledge.
Less issue discussion does not necessarily rule out different issue discussion, and we suggested initially that Facebook might allow campaigns to emphasize different issues in their online and TV spots. We find little evidence of a “these issues here” and “those issues there” approach to TV and Facebook; across all issues that we examined, discussion is no greater on Facebook than television. For many issues, the difference is strictly negative and substantively large. It might be axiomatic that issue discussion in candidate ads is better for voters than issueless appeals, and so there is some reason for concern that Facebook does not contribute to the information environment in ways that allow voters to make decisions based on candidate policy proposals.
Though less issue-centered, the messages that candidates choose to include in their Facebook ads are more easily identifiable as partisan and more clearly ideological than those they include in TV spots. These three differences—reduced negativity, lower issue content, and increased partisanship—all point toward the use of social media ads for mobilization of existing supporters as opposed to persuasion of marginal voters. Social media can thus be expected to increase the polarization of the information environment that voters experience in campaigns, with Republican-leaning voters seeing mostly pro-Republican ads, with little attempt to engage the opponent’s positions, and vice versa for Democratic voters.
On both the issue coverage and partisanship dimensions, there is more variation in message content within candidate on Facebook than on TV. Although we cannot parse out whether message tailoring is due to Facebook’s delivery algorithms or due to candidate targeting (or both), our data do suggest that the capability of Facebook to tailor messages to different audiences, which is difficult to do on TV, does show up in message segmentation. This increase in within-campaign variation in messages, and the fact that message content correlates fairly strongly with viewer attributes, implies that Facebook contributes to a fragmentation in the information environment across the electorate.
This fragmentation might contribute to increasing affective polarization in the electorate if Facebook ads influence the political behavior and attitudes of viewers. There is some initial evidence that such effects are small (Broockman and Green Reference Broockman and Green2014), but the scale and scope of Facebook advertising has grown dramatically in recent years. We simply do not know enough about the effects of exposure to online ads to dismiss the potential for real effects on behavior and preferences.
It is worth noting that our data cover only Facebook and not other online platforms that allow political advertising. We do, however, expect our findings about Facebook to generalize to those digital platforms that have similar targeting capabilities, such as YouTube and Google search advertising. The content difference between television advertising and online venues that do not allow for targeting, such as campaign websites (Druckman, Kifer, and Parkin Reference Druckman, Kifer and Parkin2009), however, may not be as stark.
Moving forward, we also expect traditional television advertising to matter less to political campaigns, as viewers migrate away from live television and move toward online content or to streaming video options. As this happens, viewers will continue to see political ads that look a lot like they always have, as short spots before or embedded within content, but platforms will allow for the kind of targeting that Facebook currently affords. As such, we expect political advertising broadly to move in the direction of the Facebook data analyzed here.
The normative implications of political advertising on social media, then, are mixed. Social media lowers barriers to entry and thereby exposes voters to information about a broader set of candidates and offices. On the other hand, for already well-funded campaigns, it shifts campaign strategy away from moderation in service of persuading voters on the fence and towards mobilizing the base. Television ads are still by far the dominant mode of communication and are unlikely to disappear in coming campaigns, so the effects of the introduction of social media will not be felt immediately but will take time to play out. As noted, the rise of addressable technologies on television means that TV may become more similar to Facebook over time. Still, scholars should take advantage of the difference in targeting capability while it lasts by continuing to compare how campaigns use paid advertising on social media and on television and by documenting how the use of these tools changes in coming electoral cycles.
As campaigns learn about the capabilities offered by digital campaigning and targeting technology is improved for online platforms and rolled out for television (Bruell Reference Bruell2018), we expect that campaigns will continue to develop new approaches to persuade and mobilize voters. We also believe that researchers will be able to build off our work to better understand the causes and consequences of different advertising strategies for on online and TV modes. Incorporating information on the cost of buying narrowly targeted advertisements and the choice space of targeting options that advertising platforms offer campaigns will help researchers understand how campaigns trade off the electoral benefits of targeting with the increased cost. Comparing how citizens respond to messages delivered online and on television will better inform our understanding of the effects of online advertising platforms on citizen participation, election outcomes, and attitudes toward the political system.
Supplementary Materials
To view supplementary material for this article, please visit http://dx.doi.org/10.1017/S0003055420000696.
Replication materials can be found on Dataverse at: https://doi.org/10.7910/DVN/IR9XGC.




Comments
No Comments have been published for this article.