INTRODUCTION
Since ~1850, glacier coverage in high latitude and altitude regions has continued to decline in response to climate warming (Stocker and others, Reference Stocker, Stocker, Qin, Plattner, Tignor, Allen, Boschung, Nauels, Xia, Bex and Midgley2013). Retreating glaciers progressively expose soil-forming mineral substrates to surface conditions and biotic colonisation (Breen and Lévesque, Reference Breen and Lévesque2008). Thus, glacier forefields are comprised from linear arrays of soil development stages which provide unique opportunities to investigate long-term primary succession and ecosystem development (Bradley and others, Reference Bradley, Singarayer and Anesio2014). As terrestrial primary production and ecosystem functioning are typically limited by the availability of nitrogen (N; Vitousek and others, Reference Vitousek1997), advancing our understanding of how N accumulates with soil formation is crucial to identifying the long-term productivity of these ecosystems (Bradley and others, Reference Bradley, Singarayer and Anesio2014).
The development of soils at high latitudes occurs over relatively long timescales as soil forming processes are highly constrained by low temperatures, short growing seasons and slow weathering rates (Ellis and Mellor, Reference Ellis, Mellor, Ellis and Mellor1995). Using space-for-time substitutions, where distance from the leading edge of a retreating glacier serves as a proxy for soil age (post-incisive chronosequence), it has been shown that soil N typically increases with time since glacial retreat (Bradley and others, Reference Bradley, Singarayer and Anesio2014). Principal inputs which contribute to the accumulation of N in these ecosystems include biological N fixation (BNF) by free-living (asymbiotic) soil bacteria and plant–microbe associations, mineralisation of organic matter previously overridden by the ice, and allochthonous loadings from aerial deposition and glacial runoff (Brankatschk and others, Reference Brankatschk, Towe, Kleineidam, Schloter and Zeyer2011). While the relative contributions of these inputs may vary, asymbiotic BNF is widely considered to be the dominant source of assimilatory N during the initial stages of soil development (Bradley and others, Reference Bradley, Singarayer and Anesio2014).
As primary mineral substrates generally lack N (Vitousek and Farrington, Reference Vitousek and Farrington1997), the initial colonisation of recently deglaciated soils is largely restricted to asymbiotic microorganisms with the capacity to convert atmospheric dinitrogen (N2) into N-containing organic compounds (diazotrophs; Duc and others, Reference Duc, Noll, Meier, Bürgmann and Zeyer2009). This process is mediated by the nitrogenase enzyme which catalases the adenosine triphosphate-dependent reduction of N2 to ammonia (Vitousek and others, Reference Vitousek, Hattenschwiler, Olander and Allison2002). Due to a high phosphorus (P) demand for adenosine triphosphate, it is expected that BNF will down-regulate as the availability of soil N increases relative to bioavailable P (Menge and Hedin, Reference Menge and Hedin2009). However, the factors influencing the extent and distribution of BNF in glacier forefield ecosystems are poorly resolved (Brankatschk and others, Reference Brankatschk, Towe, Kleineidam, Schloter and Zeyer2011).
Inputs of N by asymbiotic BNF to forefield systems facilitate subsequent colonisation by heterotrophic microorganisms capable of mineralising soil organic matter (Bradley and others, Reference Bradley, Singarayer and Anesio2014). As soil organic matter typically contains >90% of all soil N, mineralisation represents a major process controlling the availability of N in many terrestrial ecosystems. Inorganic N, which is defined hereinafter as the sum of ammonium (NH4-N) and nitrate (NO3-N), is either liberated or immobilised by the heterotrophic community during mineralisation when N is in excess or limiting, respectively (Hassink, Reference Hassink1994). Thus, the availability of inorganic N is strongly influenced by the stoichiometry between soil organic carbon (SOC) and total N (Delgado-Baquerizo and others, Reference Delgado-Baquerizo, García-Palacios, Milla, Gallardo and Maestre2015). While previous studies have quantified inorganic N availability in forefield soils (e.g., Duc and others, Reference Duc, Noll, Meier, Bürgmann and Zeyer2009; Töwe and others, Reference Töwe2010; Knelman and others, Reference Knelman2012), knowledge concerning the development of this pool over periods exceeding ~150 years is limited.
The main aim of this study was to assess how time on soil development since glacial retreat in a High Arctic glacier forefield impacts the soil N status and inputs of N by asymbiotic BNF along a 2000-year chronosequence.
MATERIALS AND METHODS
Study site description
The study was conducted in the forefield of the Midtre Lovénbreen alpine-type polythermal valley-glacier (78°55′N, 12°10′E) in northwest Spitsbergen, Svalbard, Norway, at an altitude of ~50 m asl. Comprising an area of ~5.5 km2, the glacier is 1 km wide at its equilibrium line (~365 m asl), exhibits a maximum thickness of 180 m and rises in elevation over 6 km from 50 m asl at the terminus to 600 m asl at the head (Rippin and others, Reference Rippin2003). The glacier has retreated by ~1 km since reaching its Neoglacial maximum extent during the early 20th century, causing predominantly coarse-grained (5–20 cm) mineral soil of metamorphic origin to be exposed to atmospheric conditions (Rippin and others, Reference Rippin2003; Moreau and others, Reference Moreau, Mercier, Laffly and Roussel2008). Vegetation cover in the forefield is sparse, where Saxifraga oppositifolia L., a vascular plant common to Arctic regions, was the most dominant species at each site along the chronosequence (for detailed information on vegetation cover see Hodkinson and others, Reference Hodkinson, Coulson and Webb2003). The mean annual temperature for the years 1981–2010 was −5.2°C. Mean annual precipitation for the same period was 427 mm (Førland and others, Reference Førland, Benestad, Hanssen-Bauer, Haugen and Skaugen2011). The average 1 cm soil temperature during the summer growing season (early July to late August) was 8°C (Bekku and others, Reference Bekku, Nakatsubo, Kume, Adachi and Koizumi2003).
Sample collection and preparation
Surface soil (top 10 cm) samples were collected along a proglacial post-incisive chronosequence between July and August 2013 (Bradley and others, Reference Bradley2016). The chronosequence comprised three parallel transects which were installed perpendicular to the leading edge of the glacier (Fig. 1). At each sampling site along the three transects, a 10 m traverse was installed parallel to the glacier's leading edge, where soil samples were extracted at 0 m, 5 m and 10 m across its length. Sampling sites occur at irregular intervals corresponding to the following soil ages (time since glacial retreat): 0, 3, 5, 29 and 50 years (n = 9). In addition, one of the three transects included 113-year-old and >1900 (2000 hereinafter)-year-old sampling sites (n = 3). Soil ages had previously been determined by Bradley and others (Reference Bradley2016) and Hodkinson and others (Reference Hodkinson, Coulson and Webb2003) using satellite imagery (Landsat TM 7), photographic records and carbon-14 dating techniques. As described by Bradley and others (Reference Bradley2016), the fine earth fraction (≤2000 µm) of the soil samples was separated from coarser material in the field, transferred to high-density polyethylene bags (Whirl-Pak®; Lactun, Australia) and immediately frozen at −20°C. Representative aliquots of frozen sample were freeze-dried for elemental analysis, whereas aliquots for the determination soil texture, soil nutrient concentrations and nitrogenase activity were thawed in the dark at 4°C prior to analysis.
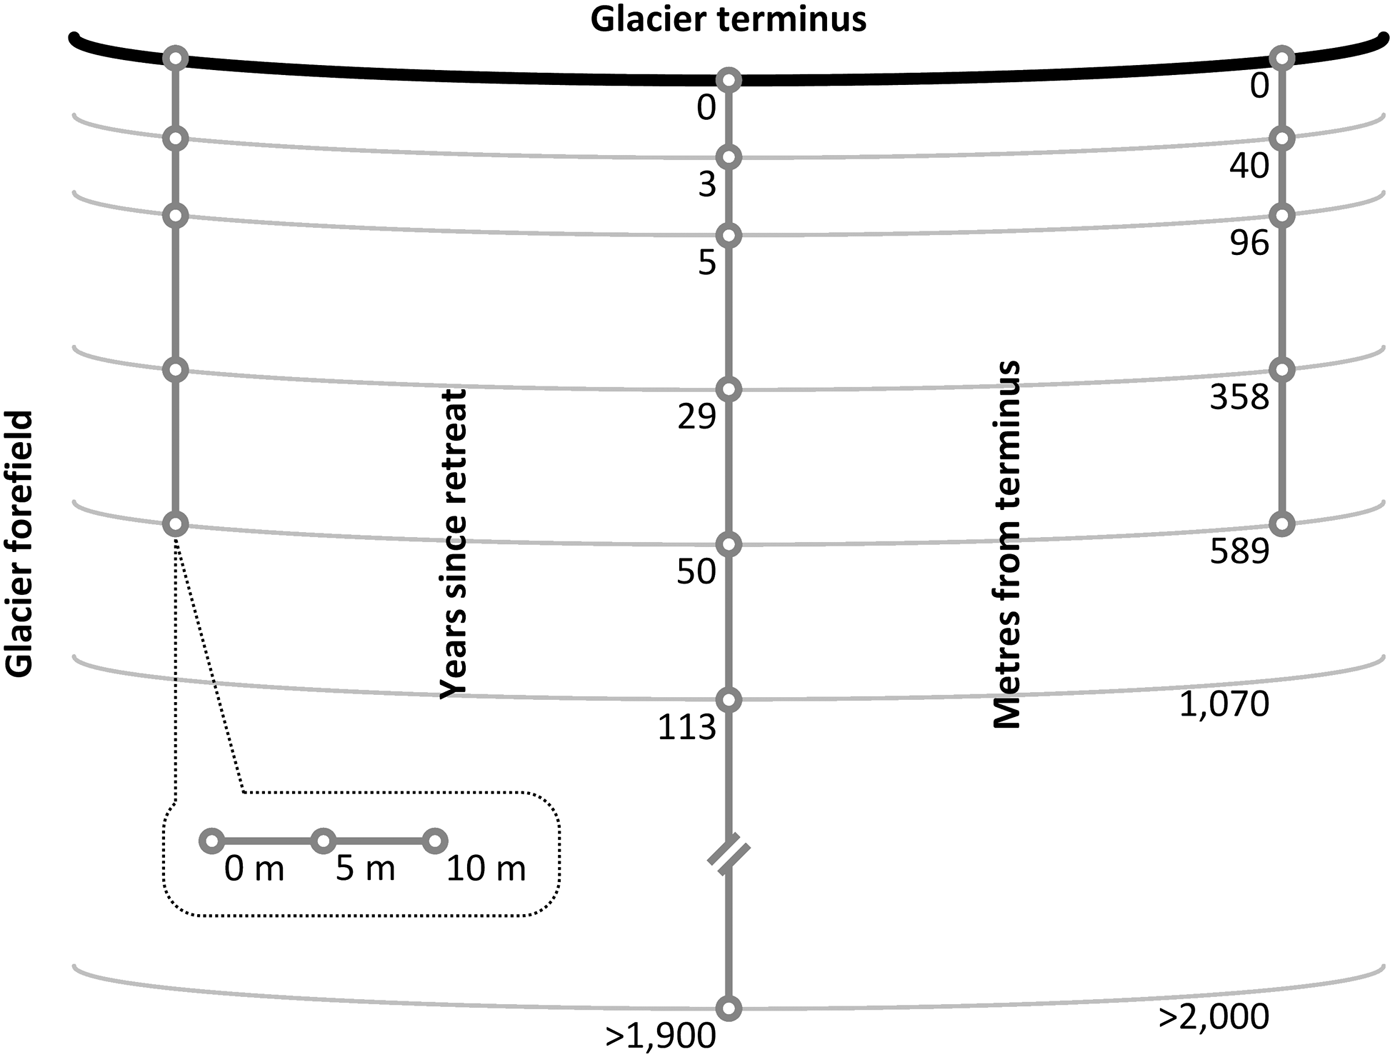
Fig. 1. Plan view of three transects which had been installed ~127 m apart between centres perpendicular to the terminus of a glacier to systematically sample the surface soil (10 cm) of a glacier forefield at irregular intervals corresponding to soil age (not to scale). Three soil samples were collected at 0-, 5- and 10-m intervals along a traverse parallel to the terminus at each sampling point (n = 9 for 0- to 50-year-old soils; n = 3 for 113- to >1900-year-old soils).
Soil texture
A Malvern Mastersizer 3000 laser particle size analyser (Malvern Instruments Ltd., Worcestershire, UK) in the measurement range of 0.02 µm to 2 mm was used to determine the particle-size distribution of the soil fine earth fraction, where samples were dispersed in a solution of sodium hexametaphosphate and sodium carbonate using Hydro EV pump accessory (Lamorski and others, Reference Lamorski2014). Soil texture was subsequently defined according to the USDA-SCS (1982) classification scheme, and the percentage sand and clay content used to estimate water holding capacity (%; Saxton and Rawls, Reference Saxton and Rawls2006).
Soil organic carbon and total nitrogen
An elemental analyser (CHNS-O EA 1108 Elemental Analyzer; Carlo Erba, Milan, Italy) was used to determine the SOC and total N content in ~100 mg aliquots of soil after inorganic C had been removed by HCl vaporisation according to methods described by Hedges and Stern (Reference Hedges and Stern1984). Prior to analysis, freeze-dried samples were embrittled using liquid N2, and ground to a flour using a pestle and mortar. The detection limits were 100 µg g−1 for both elements measured and the coefficient of variation for C and N according to six replicates of a standard reference material (SRM 338 40025, cert. 133317, C = 2.29%, N = 0.21%,) were ± 1.69% and ± 1.36%, respectively. Soil organic matter was in turn estimated from SOC using a conversion factor of 2 (Pribyl, Reference Pribyl2010).
Soil nutrient analyses
Concentrations of exchangeable NH4-N and NO3-N were determined by KCl extraction where aliquots of 0.2 g were amended with 10 mL of 2 M KCl (1:50 w/v soil:extractant), shaken for 30 min at 160 rpm, centrifuged for 5 min at 4500 rpm and filtered to 0.45 µm using Whatman WCN plain cellulose nitrate filtrate papers. Concentrations of NH4-N (QuikChem® Method 31-107-06-1-I) and NO3-N (QuikChem® Method 31-107-04-1-K) within the resulting extracts were quantified colorimetrically using a flow injection analyser (Lachat QuikChem 8500 Series 2 FIA system, Loveland, CO, USA), where the coefficient of variation (six replicate standards) for NH4-N and NO3-N was ±3.7% and ±0.9%, respectively, according to mid-range standards (calibration range: 0–0.5 mg L−1). The respective detection limits for NH4-N and NO3-N were 0.04 µg g−1 and 0.01 µg g−1 for dry sediment. Bioavailable P (sum of loosely sorbed, and iron- and aluminium-bound P) was sequentially extracted from 0.2 g of soil using the SEDEX method (Ruttenberg, Reference Ruttenberg1992; Ruttenberg and others, Reference Ruttenberg2009) and analysed colorimetrically using a segmented flow analyser (SEAL AA3, Norderstedt, Germany). Detection limits for both loosely sorbed, and iron- and aluminium-bound P was 0.05 µg g−1. The coefficient of variation (six replicate standards) for the same fractions were both <0.5%. Samples were blank-corrected when blank concentrations exceeded the detection limits. All results were reported on a dry weight basis, where percentage dry matter content (DMC) was determined gravimetrically using methods described by Rowell (Reference Rowell1994).
Biological nitrogen fixation
Nitrogenase activity was assessed using the acetylene (C2H2) reduction assay technique adapted from Telling and others (Reference Telling2011) as described by Turpin-Jelfs and others (Reference Turpin-Jelfs, Michaelides, Biederman and Anesio2018). The number of samples per soil age was reduced from nine to three by homogenising the three samples obtained from the 10 m traverses at each sampling site along the transects (n = 3). Aliquots from each sample (equivalent to 7.5 g dry weight) were transferred to gas-tight 30 mL serum bottles and incubated 8 ± 0.1°C (mean summer temperature) under 16 W florescent lamps (Sylvania, Garching, Germany) with emission spectra in the range 300–700 nm and irradiance equal to 0.2 ± 0.005 W m−2. Following a 72-h pre-incubation period, 10% of the headspace from each bottle was replaced with 100% C2H2 gas, which had been produced by adding Milli-Q water to technical grade calcium carbide (Sigma, St. Louis, MO, USA). Serum bottles were sampled using a gas-tight syringe at 0-, 3-, 6-, 12-, 20- and 24-h intervals. At the time of sampling, 5 mL of air:C2H2 (9:1) was added to each serum bottle, mixed thoroughly by plunging the syringe six times and subsequently transferred to pre-evacuated 3.7 mL Exetainers (Labco, Lampeter, UK). A 1 mL aliquot of headspace from each Exetainer was then analysed using a Varian 3800 gas chromatograph (GC; Varian, Inc., Palo Alto, CA, USA), where ethylene (C2H4) was separated from C2H2 using a 6′ × 1/8″, 80/100 mesh HayeSep T column at 85°C (He carrier gas). Daily standards of 100 ppm C2H4 (BOC, Guildford, UK) gave precisions of <5%. The precision for 100 ppm standards that had been stored in 3.7 mL for a period of 1 month also gave precisions of <5%. Detection limits were <0.01 nmol C2H4 g−1 for dry sediment. The C2H4 produced in 24 h was converted to N2 using the theoretical molar ratio of 3:1 (BNF day; nmol N g−1 d−1). Potential annual rates asymbiotic BNF per unit area (BNF annual; g N m−2 a−1) were determined using Eqn (1):
where depthsoil was the top 1 cm of the surface soil, ρ was the reference bulk density which was calculated as a function of the soil clay, silt, sand and organic matter content (Keller and Håkansson, Reference Keller and Håkansson2010), and time was the length of the summer melt season (60 days; Hodson and others, Reference Hodson, Mumford, Kohler and Wynn2005). All sample measurements were blank-corrected using corresponding autoclaved soil samples (126°C for 30 min). Controls for natural C2H4 production in the absence of C2H2 and C2H4 consumption were consistently below the limits of detection.
Statistical analysis
Statistical analysis of the data was performed using R version 3.5.0. The Kruskal–Wallis H test (KW) was used to determine if significant differences occurred for data along the forefield chronosequence. When significance was indicated, Dunn's test (DT) of multiple comparisons was applied. Relationships between explanatory and response variables were explored using simple linear regression analysis, where residuals were inspected for evidence of nonnormality using the Shapiro–Wilk test. To reduce leverage by extreme predictors, data pertaining to the 2000-year-old soil samples were not included in regression models. For this study, the alpha level was set to 0.05. All errors reported in the text are one median absolute deviation about the median (Crawley, Reference Crawley2005).
RESULTS
Soil texture
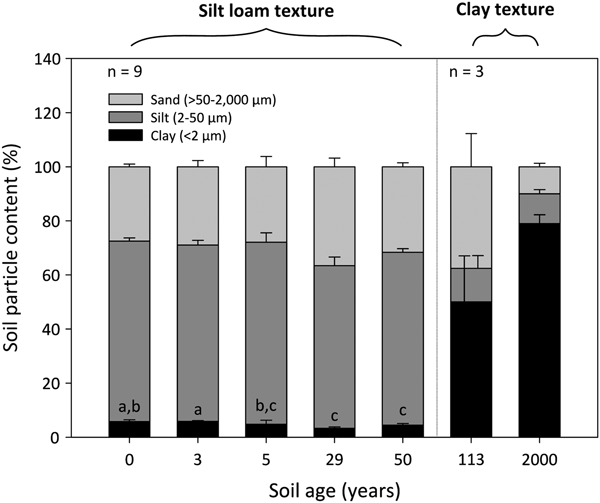
The 0- to 50-year-old soils were silt loams, whereas the 113- to 2000-year-old soils were clays (Fig. 2). Soil clay content was significantly influenced by soil age (DT, p < 0.001), where clay particles decrease from 6 ± 1% to 4 ± 1% between the 0- and 50-year-old soils (DT, p < 0.001). The soil clay content then increases dramatically to 50 ± 17% and 80 ± 3% in the 113- and 2000-year old soils, respectively. Soil silt and sand fractions do not differ between the 0- and 50-year-old soils (p > 0.05). However, the silt fraction decreases from 64 ± 1% in the 50-year-old soil to ~12% in the 113- and 2000-year-old soils. Further, the soil sand content decreases sharply from 38 ± 12% in the 113-year-old soil to 10 ± 1% in the 2000-year-old soil.
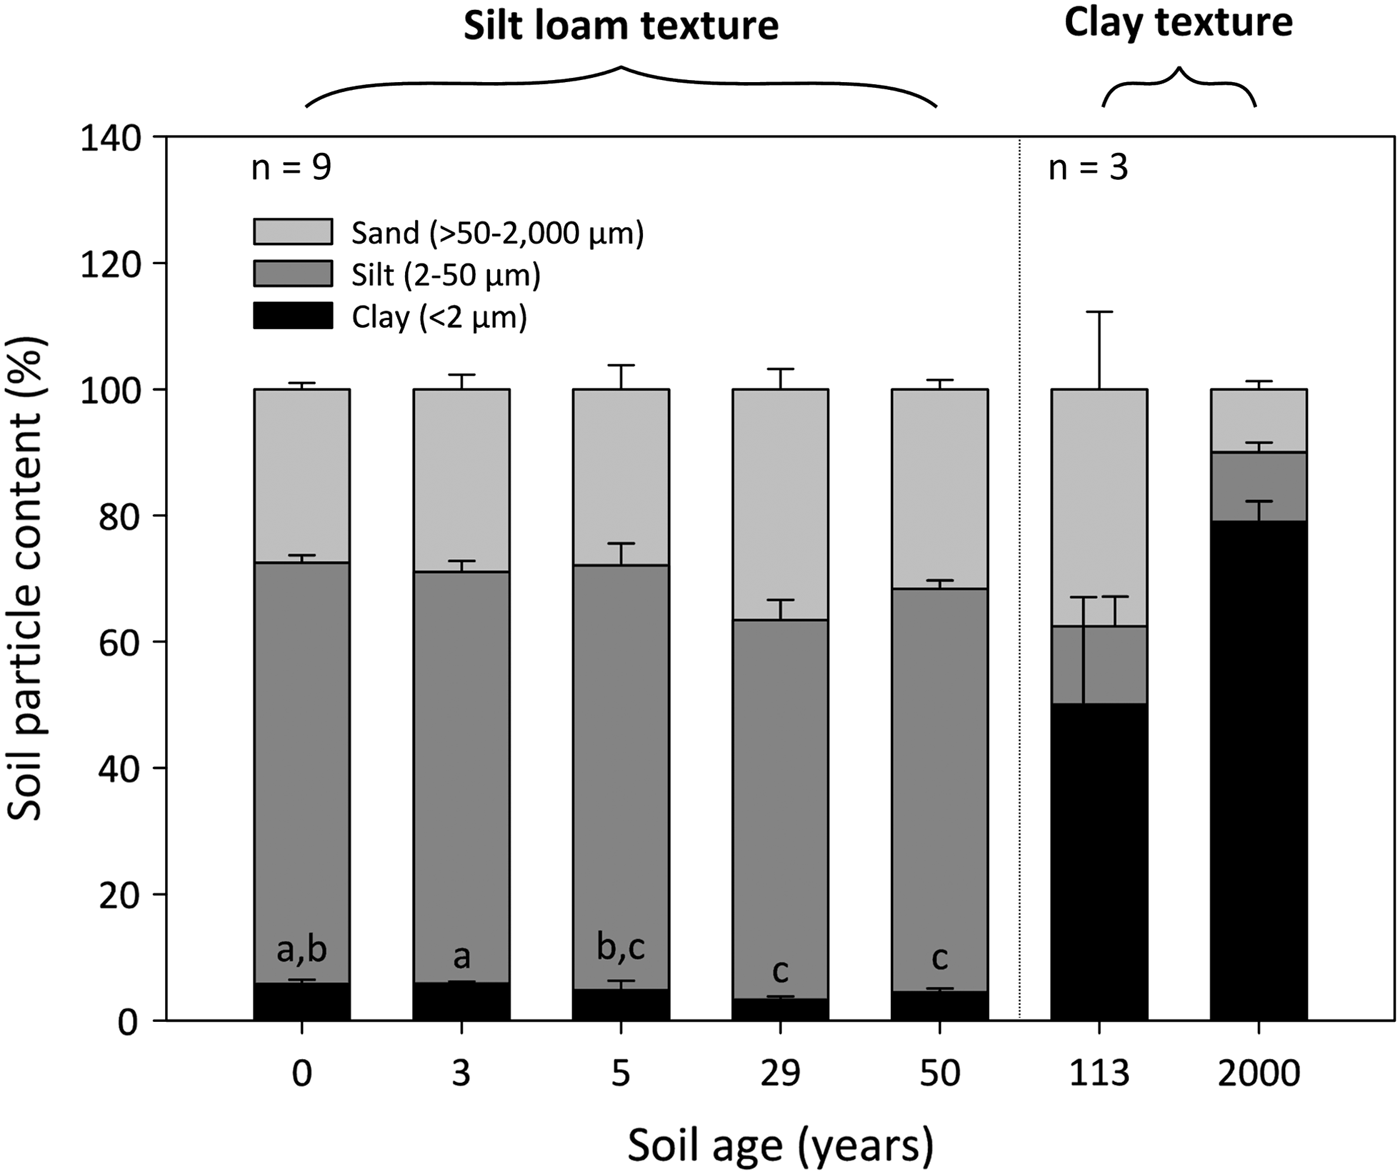
Fig. 2. Median percentage clay, silt and sand content of surface soil (top 10 cm) from a glacier forefield in Svalbard, Norway. Groups denoted with different letters indicate significant differences at p < 0.05 (Dunn's test). Error bars represent median absolute deviation about the median. Soil textural classes are displayed in bold and were defined according to the USDA-SCS (1982) classification scheme.
Distribution and speciation of nitrogen
The total N content of the forefield soils was strongly influenced by soil age (R 2 = 0.92, p < 0.01). Between the 0- and 50-year-old soils, concentrations of total N increase from 84 ± 12 µg g−1 to 215 ± 47 µg g−1 (Fig. 3a). Specifically, the total N content of the 0-year-old soil is lower in comparison with the 3- to 50-year-old soils (DT, p < 0.05), and the total N content of the 3-year-old soil is lower relative to that of the 29- and 50-year-old soils (DT, p < 0.05). In addition, concentrations of total N subsequently rise to 606 ± 70 µg g−1 in the 113-year-old soil and to 4399 ± 498 µg g−1 in the 2000-year-old soil.

Fig. 3. Total N (a), NH4-N (b) and NO3-N (c) concentrations for surface soil (top 10 cm) by dry weight for a glacier forefield chronosequence in Svalbard, Norway. Boxes denoted with different letters indicate significant differences at p < 0.05 (Dunn's test). Results reported on dry matter basis.
The relative contribution of inorganic N to total N decreases from 4% in the 0-year-old soil to 1% in the 2000-year-old soil. Inorganic N within the 0- to 50-year-old soils chiefly comprises NO3-N, where median concentrations of NH4-N are below the limits of detection (Figs 3b and c). Further, NO3-N levels are not influenced by soil age and do not differ between the 0- and 50-year-old soils (KW, p > 0.05). Conversely, the inorganic N content of the 113-year-old soil increases by 55% above that of the 50-year-old soil due to a linear rise in concentrations of NH4-N with soil age (R 2 = 0.80, p < 0.05). Subsequent gains of both NH4-N and NO3-N within the 2000-year-old soil serve to increase inorganic N by 586% above the concentrations observed in the 113-year-old soil, of which only 21% is in the form of NO3-N.
Nutrient ratios
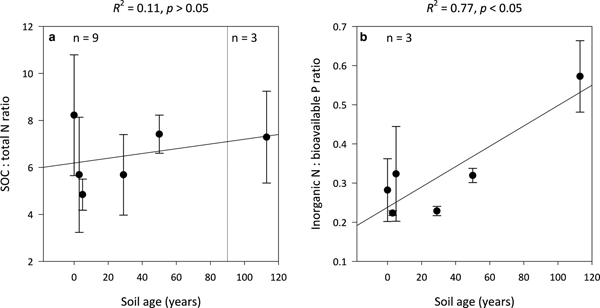
Ratios of SOC:total N (C:N) are not significantly influenced by soil age (R 2 = 0.11, p > 0.05) and remain constant along the encroachment gradient where the median C:N ratios in the 0- and 113-year-old soils are 8 ± 3 and 7 ± 2, respectively (Fig. 4a). However, inorganic N:bioavailable P (N:P) ratios increase linearly with soil age (R 2 = 0.77, p < 0.05) from 0.3 ± 0.1 in the 0-year-old soil to 0.6 ± 0.1 in the 113-year-old soil (Fig. 4b). Further, the N:P ratios of the 0- to 113-year-old soils generally exhibited lower variability than corresponding C:N ratios.
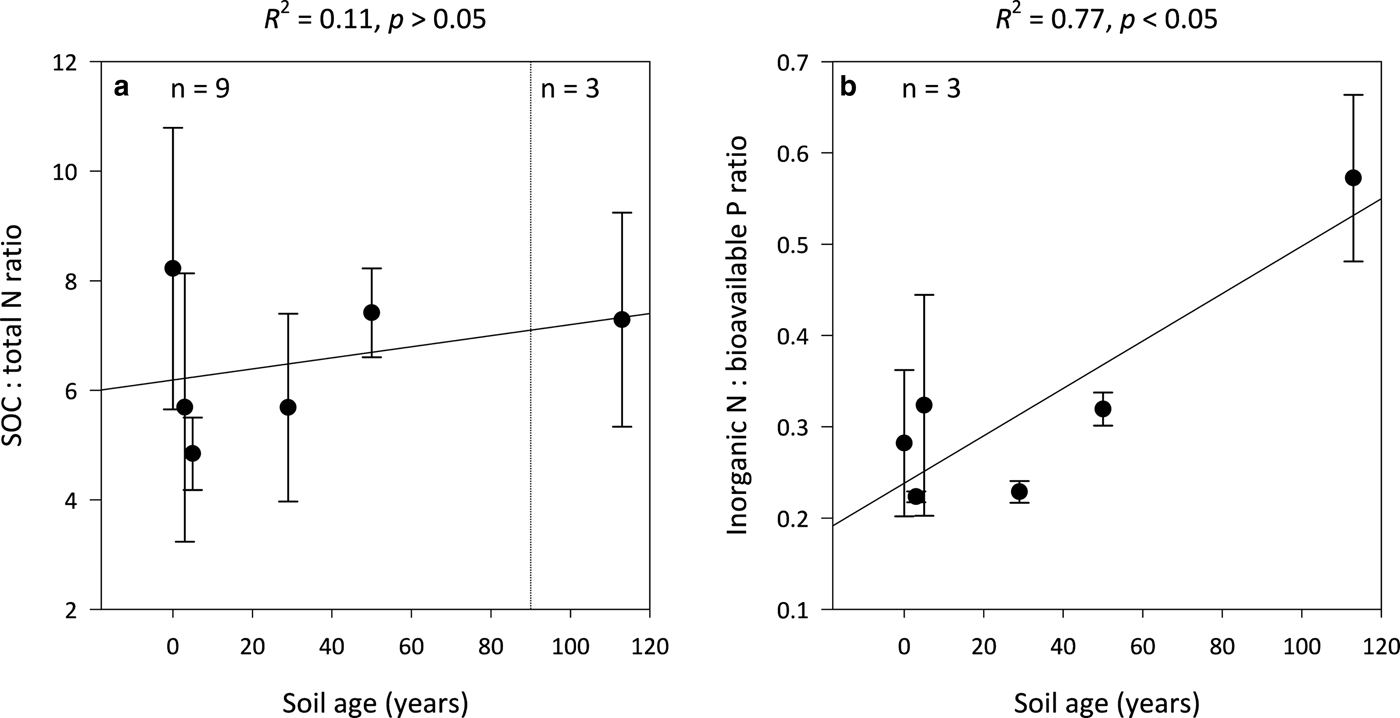
Fig. 4. Median SOC:total N (a) and inorganic N:bioavailable P (b) ratios for surface soil (top 10 cm) for a glacier forefield chronosequence in Svalbard, Norway. Error bars represent median absolute deviation about the median. Results reported on dry matter basis.
Acetylene reduction assay
Potential annual rates of asymbiotic BNF decrease with soil age from 0.16 ± 0.04 g N m−2 a−1 in the 0-year-old soil to below detection limits in the 5-year-old soil. Potential BNF rates were derived from rates of C2H4 production, which were linear over the 24-h period for both the 0- (R 2 = 0.95, p < 0.01) and 3-year-old (R 2 = 0.67, p < 0.05) soils (Figs 5a–c). C2H2 reduction assays of the 29-, 50-, 113- and 2000-year-old soils were not performed as C2H4 production during the preliminary incubations of these samples, as well as the 5-year-old samples, were below the limits of detection (data not shown here). The preliminary incubations, which were also performed in triplicate, adhered to the methods previously outlined (i.e., incubated in the light at 8°C), but were only sampled at 0- and 24-h intervals after the 72-h pre-incubation period. These preliminary incubations were also corrected for background C2H4 levels via blanks containing autoclaved soil samples in the presence of C2H2 and assessed for natural C2H4 production and consumption.
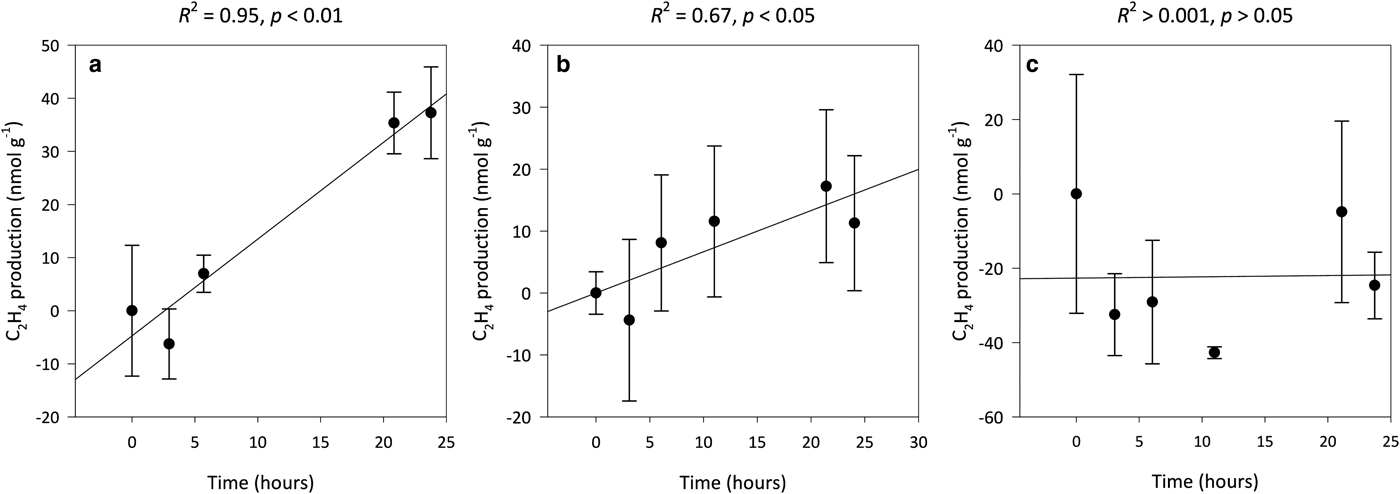
Fig. 5. Median ethylene (C2H4) production for 0- (a), 3- (b) and 5-year-old (c) soils from a glacier forefield in Svalbard, Norway (n = 3). Error bars represent median absolute deviation about the median. Results reported on dry matter basis.
DISCUSSION
Our study revealed that time on soil development since glacial retreat strongly influences the distribution and speciation of N in the surface soil of the Midtre Lovénbreen glacier forefield. Further, we determined that N inputs by asymbiotic diazotrophs represent an important source of bioavailable N to this ecosystem. Here we discuss specifically how the soil N pool, as well as potential rates of asymbiotic BNF, vary along a 2000-year chronosequence of soil development in a High Arctic glacier forefield.
Distribution and speciation of soil nitrogen
Our findings are in agreement with a comprehensive review carried out by Bradley and others (Reference Bradley, Singarayer and Anesio2014) which showed the total N content of glacier forefield soils typically increase with soil age (Fig. 3a). We observed that total N initially increases by ~100 µg g−1 above 84 ± 12 µg g−1 between the 0- and 50-year-old soils, which are dominated by a silt loam texture (Fig. 2). The accumulation of total N subsequently accelerates with the increased colonisation of the surface by plants at sites which have been ice-free for 113 (606 ± 70 µg g−1) and 2000 (4399 ± 498 µg g−1) years (Hodkinson and others, Reference Hodkinson, Coulson and Webb2003), and exhibit a clay texture. Greater concentrations of total N in vegetated soils are to be expected as plants have been shown to increase the soil N pool through inputs of nutrient-rich litter and exudates, as well symbiotically-fixed N resulting from associations with rhizobia (Duc and others, Reference Duc, Noll, Meier, Bürgmann and Zeyer2009). In addition, the soil clay content, which increases substantially between the silt loam- and clay-textured soils is important for stabilising soil organic matter (Egli and others, Reference Egli, Mavris, Mirabella and Giaccai2010), where the percentage of total N which is organically bound (total N minus the sum of NH4-N and NO3-N) ranges from 96 ± 1% in the 0-year-old soil to 99 ± 0.1% in the 2000-year-old soil (Figs 3a–c). Interestingly, increases in total N between the 0- and 50-year-old soils did not share a clear relationship with the soil clay content. This discovery is corroborated by a study of the Damma glacier forefield, Switzerland, by Dümig and others (Reference Dümig, Smittenberg and Kögel-Knabner2011) which also failed to identify a clear trend in the soil clay content with age, and demonstrated that the accumulation of soil organic matter did not share a linear relationship with soil texture.
In contrast to model simulations by Bradley and others (Reference Bradley2016) which showed that inorganic N accumulates at a relatively constant rate within Midtre Lovénbreen forefield, we observed that concentrations of inorganic N remain largely stable at 3–4 µg g−1 between the 0- and 113-year-old soils (Figs 3b and c). As NO3-N was found to constitute 100% of inorganic N in the silt loam-textured soils (ice-free for 0–50 years), it may be reasoned that inputs of NH4-N are rapidly immobilised by the soil microbial biomass (Bradley and others, Reference Bradley2016). Indeed, a study of the Loch Vale Watershed in the Colorado Rocky Mountains, USA, by Baron and others (Reference Baron, Allstott, Newkirk, Tonnessen, Williams and Tranter1995) showed that NH4-N, which comprised ~50% of received inorganic N deposition, was incorporated directly into biomass or oxidised to NO3-N in soil, as well as snow pack and surface waters. Conversely, the increase in NH4-N in the 113- and 2000-year-old soils (Fig. 3b) suggests that mineralisation processes are sufficient to facilitate the accumulation of inorganic N in the clay-textured soils (Bradley and others, Reference Bradley2016). This is supported by studies of the Damma glacier (Switzerland; Töwe and others, Reference Töwe2010), and Ödenwinkelkees and Rotmoosferner glaciers (Austria; Tscherko and others, Reference Tscherko, Rustemeier, Richter, Wanek and Kandeler2003) which showed that functional genes (chiA and aprA) and rates of N mineralisation increase with soil age, respectively. Despite soil C:N ratios remaining constant across the chronosequence (Fig. 4a), the lack of inorganic N accumulation in the silt loam-textured soils is indicative N limitation (Schimel and others, Reference Schimel, Bilbrough and Welker2004). Consequently, the capacity for BNF should represent a selective advantage in the silt loam-textured soils.
Inputs of asymbiotically-fixed nitrogen
We found that linear rates of asymbiotic BNF (C2H4 production) only occur at levels above the limits of detection in the 0- and 3-year-old soils from the Midtre Lovénbreen glacier forefield (Figs 5a–c). These rates of BNF measured in the forefield soils are more than five and ten times greater than those for marine terrace soils ~10 km from the study site (Solheim and others, Reference Solheim, Endal and Vigstad1996) and the Midtre Lovénbreen glacier (Telling and others, Reference Telling2011), respectively, but are in the range reported for soils in polar desert and alpine tundra ecosystems by Cleveland and others (Reference Cleveland1999), as well as cyanobacteria-bryophyte symbioses in Svalbard (Solheim and others, Reference Solheim, Endal and Vigstad1996). Further, if, to facilitate comparisons with Telling and others (Reference Telling2011), the 0- and 3-year-old soils were each conservatively assumed to represent 1% of the Midtre Lovénbreen catchment area, they would collectively provide the system with ~2 kg N km−2 a−1. This is two orders of magnitude greater than N inputs by the cryoconite microbial community on the glacier (Telling and others, Reference Telling2011), and equivalent to 5% of annual N inputs to the catchment by rain and snow during the 1999/2000 melt season (Hodson and others, Reference Hodson, Mumford, Kohler and Wynn2005). Thus, despite constituting an overall lower input of N to the system than rain and snow, our findings suggest the microbially mediated fixation of N by asymbiotic diazotrophs may provide an important source of assimilatory N during the initial stages of soil development in the forefield system. This is supported by studies for the Anvers Island (Antarctica; Strauss and others, Reference Strauss, Garcia-Pichel and Day2012), Damma (Switzerland; Töwe and others, Reference Töwe2010), Puca (Peru; Schmidt and others, Reference Schmidt2008) and Mendenhall (AK, USA; Sattin and others, Reference Sattin2009; Knelman and others, Reference Knelman2012) glaciers which showed that asymbiotic BNF promoted the accumulation of N and successional changes within the microbial community of recently deglaciated soils. However, in contrast to our findings, these studies have shown that nitrogenase activity typically increased in soils between 0 and 10 years of age (Schmidt and others, Reference Schmidt2008; Sattin and others, Reference Sattin2009; Strauss and others, Reference Strauss, Garcia-Pichel and Day2012).
Nitrogenase activity declined with soil age in the Midtre Lovénbreen forefield (Figs 5a–c). As N:P ratios increase linearly with time on soil development (Fig. 4b), these findings support the theory that nitrogenase activity will down-regulate as the availability of N increases relative to P (Smith, Reference Smith1992), and are substantiated by Telling and others (Reference Telling2011) who demonstrated that potential rates of asymbiotic BNF by the cryoconite microbial community on the Midtre Lovénbreen glacier, as well as the neighbouring Austre Brøggerbreen and Vestre Brøggerbreen glaciers, decline with increases in the availability of N. Further, a study by Nash and others (Reference Nash2018) in the same site as ours showed the abundance of the nifH gene, an important marker of diazotrophs, increase as concentrations of total N decline below 1000 µg g−1. In contrast, Brankatschk and others (Reference Brankatschk, Towe, Kleineidam, Schloter and Zeyer2011) found the nifH gene abundance of soils from the Damma glacier forefield in Göscheneralp, Switzerland, increased with gains in total N between soils which had been ice-free 10 and 50 years. However, this increase was attributed to a greater competition for N as plant cover rose from <10% to >70% with the number of years since exposure. As gains in soil N in this study were limited to the organic phase in the silt loam-textured soils, it may be inferred that increases in organic N with soil age are adequate to sustain growth within the microbial biomass.
We caution treating the potential BNF rates presented here as absolutes. Uniform incubation parameters were used to achieve linear rates of C2H2 reduction over a 24-h period, where parameters were chosen to reflect mean summer growth/melt season conditions. As the soil microbial community in the Midtre Lovénbreen forefield is dominated by autotrophic organisms (Hodkinson and others, Reference Hodkinson, Coulson and Webb2003; Bradley and others, Reference Bradley, Anesio and Arndt2017; Nash and others, Reference Nash2018), it was reasoned that nitrogenase activity, which is positively correlated with the soil moisture content (Chapin and others, Reference Chapin, Bliss and Bledsoe1991), would be restricted to a period when water is available to the biota (Logan, Reference Logan and Brown1968). However, despite low temporal variability in the soil N pool during the short summer season in Svalbard (Bardgett and others, Reference Bardgett2007), it may be argued that N inputs released to the soil solution through snowmelt and rainfall may influence potential rates of asymbiotic BNF. Indeed, Telling and others (Reference Telling2011) demonstrated that N fixation by the cryoconite microbial community on the Midtre Lovénbreen glacier was constrained by inputs of N from snowmelt. For this reason, we consider it prudent to present potential rates of BNF as a range based on a conservative 20- and maximum 60-day summer period equal to 0.7–2 kg N km−2 a−1. The lower extremum of this range is similar to potential rates of BNF by cryoconite on the sediment-covered marginal zone on Leverett Glacier in Greenland (0.8 kg N km−2 a−1) which was determined to be important to the colonisation of moraine-derived sediments in that area (Telling and others, Reference Telling2012).
In addition to time, other factors may have introduced uncertainty into the BNF data presented here. As the depth to which autotrophs can colonise is limited by the availability of photosynthetically active radiation (Jeffery and others, Reference Jeffery, Harris, Rickson and Ritz2009), our estimates of fixation per unit area were restricted to the top 1 cm of the surface soil, as light penetration beyond this depth in bare and coarse soils would not be significant (Tester and Morris, Reference Tester and Morris1987). Such an assumption may be insufficient to adequately characterise contributions of N fixation by heterotrophic diazotrophs, which may occur throughout the surface soil matrix and achieve comparable rates of BNF to their autotrophic counterparts (Strauss and others, Reference Strauss, Garcia-Pichel and Day2012). Further, as photosynthesis, which shares a positive relationship with nitrogenase activity, increases with higher irradiance (Rabouille and others, Reference Rabouille, Staal, Stal and Soetaert2006), it is possible that potential rates of BNF were limited by the incubation light source in the laboratory experiments being three orders of magnitude lower than the global average of 198 W m−2 (Le Treut and others, Reference Le Treut, Solomon, Qin, Manning, Chen, Marquis, Averyt, Tignor and Miller2007). Lastly, as C2H4:N2 conversion factors for naturally-occurring cyanobacteria in soil range from 1.9 to 6.1, it is recommended that conversions of C2H4 to N are calibrated using a 15N dilution (Belnap, Reference Belnap, belnap and Lange2001). As conversions from C2H4 to N were not calibrated in this study, it is possible that we may have over- or underestimated potential rates of BNF in this system. Nevertheless, the data serves to illustrate that asymbiotic BNF is an important N input pathway to the Midtre Lovénbreen glacier forefield which declines with time on soil development (i.e., with the accumulation of N).
CONCLUSIONS
Over the past century, glaciers in Arctic regions have undergone significant retreat with rapid changes in climate, exposing new soil-forming substrates to atmospheric conditions. Using a space-for-time substitution approach, we showed that the soil N pool, which is essential to terrestrial primary production, increases with time since exposure in the forefield of a High Arctic glacier. However, the extent to which soil N increases with time is influenced by soil texture, where N accumulates more rapidly in clay-textured (113 and 2000-years-old) than silt loam-textured soils (0–50-years-old). Further, in contrast to the clay-textured soils, we observed that gains in soil N were limited to the organic phase in the silt loam-textured soils. This suggests that inputs of inorganic N to the silt loam-textured soils are immobilised by the microbial biomass due to N-limiting conditions. While N limitation should promote BNF, asymbiotic nitrogenase activity was only detectable in the 0- and 3-year-old soils, where potential annual rates N fixation decline with increases in soil N. Nevertheless, we demonstrated that inputs of N by asymbiotic diazotrophs may represent an important source of assimilatory N during the initial stages of soil development in this glacier forefield. As glacier coverage is projected to decrease with continued climate warming, this study has implications for understanding how ice-free ecosystems develop and become productive over time.
ACKNOWLEDGEMENTS
The research was supported by a University of Bristol Graduate Teaching Studentship to TTJ for laboratory work and a NERC grant NE/J02399X/1 to AMA for fieldwork expenses. We are grateful for the use of the NERC facilities in Ny-Ålesund during field campaigns, and to Katherine Wright and James Bradley for their assistance with field sampling. In addition, we thank Francine Turpin for assisting with the analysis of samples during her work experience placement at the University of Bristol.
DATA AVAILABILITY
All data presented here is available at the following DOI: https://doi.org/10.5523/bris.5itwup6puf972p0tw4s77h9os.
AUTHOR CONTRIBUTIONS
TTJ led the design of the study, assisted by KM and AMA. All laboratory work, excluding P analyses, was performed by TTJ with assistance from JMW. P analyses were conducted by JJB and LGB. TTJ wrote the manuscript with contributions from KM and AMA.
COMPETING INTERESTS
The authors declare that they have no conflict of interest.


