Introduction
Sea ice is capable of exerting a major influence on the Earth’s climate for a number of reasons: cold, dense brine rejected during ice formation, particularly in the Labrador and Greenland Seas, is believed to have a significant effect on the global thermohaline ocean circulation (Reference Aagaard, Swift and CarmarkAagaard and others, 1985); the turbulent transfer of sensible and latent heat between the ocean and atmosphere is reduced by mote than two orders of magnitude in the presence of sea ice (Reference MaykutMaykut, 1978); and the surface albedo of sea ice is an order of magnitude greater than that of open ocean, thus significantly altering the surface-radiation balance. Furthermore, the well-known positive feedback between temperature and surface albedo (Reference Ingram, Wilson and MitchellIngram and others, 1989) is likely to amplify greenhouse-induced climate change. It is therefore essential that sea ice, and its interaction with the atmosphere and oceans, is properly represented in global climate models (GCMs).
This paper presents a preliminary evaluation of present-day Aictic sea ice predicted by the control run of the UK Hadley Centre GCM. The cause of significant errors in the modelled winter sea-ice distribution is identified by examining the components of the surface-energy budget governing ice formation, and implications for climate modelling are discussed.
Hadley GCM
The Hadley GCM is a fully-coupled ice–atmosphere–ocean model with a resolution of 2.5° latitude by 3.75° longitude, 19 levels in the atmosphere, 2) layers in the ocean and 4 soil layers (Reference JohnsJohns and others, 1997). This model is derived from that used in earlier siudies (Reference MurphyMurphy, 1995), but features completely revised atmospheric dynamics based on a different grid type, and significant changes to the ocean and sea-ice components.
In order to prevent climate drift arising from systematic model errors, the sea-surface temperature and salinity are relaxed back to climatological values. This is achieved by adding flux adjustments to the energy and fresh-water fluxes of the ocean (Reference Sausen, Barthel and HasselmannSausen and others, 1988). Mouthly mean flux adjustments were calculated at the end of the 510 year coupled spin-up as Newtonian-relaxation terms proportional to the differences between modelled sea-surface temperatures and salinities, and climatological values from Reference LevitusLevitus (1982). These flux adjustments remained fixed in subsequent runs. Although the model would still reach, an equilibrium state without flux adjustment, it would have an unrealistic climate, casting doubt on conclusions from climate-change experiments.
Sea-ice thermodynamics is based on the zero-layer model of Reference SemtnerSemtner (1976), with ice concentration parameterised according to Reference HiblerHibler (1979). Sea-ice dynamics is based on the simple scheme of Reference BryanBryan (1969), in which ice thickness and concentration and snow depth are advected using the surface currents from the ocean model. Ice rheology is crudely parameterised by preventing convergence of ice once the depth reaches 4 m.
Climatological model data used in this study were averaged over 15 years of the control run.
Validation Data
Sea-ice concentration
Passive-microwave data from the Scanning Multichannel Microwave Radiometer (SMMR) and Special Sensor Microwave Imager (SSM/I) (National Snow and Ice Data Center, 1989) over a 15 year period from 1979 to 1994 were used to calculate monthly mean sea-ice concentration using the NASA/Team algorithm (Reference Cavalieri, Gloersen and CampbellCavalieri and others, 1984).
Data assimilation office (DAO)
The DAO dataset (Reference Schubert, Rood and PfaendtnerSchubert and others, 1993) was produced by assimilating rawinsonde reports, satellite retrievals of geopotential thickness, cloud-motion winds, and aircraft, ship and buoy reports with short-term model forcasts from the Goddard Earth Observing System (GEOS) GCM. This GCM was constrained at the surface by observed sea-surface temperature and soil moisture. Climatological monthly mean values were obtained by averaging eight years of data from 1986 to 1993, and used in this study to evaluate the Hadley GCM surface-energy budget.
Shortwave and longwave radiation
In addition to the DAO fluxes, shortwave- and longwave-radiative fluxes at the surface (calculated by the Goddard Institute of Space Sciences (GISS) radiative-transfer model incorporating measurements from the International Satellite Cloud Cilimatology Project (ISCCP) (Reference Zhang, Rossow and LacisZhang and others, 1995) were obtained from GISS. Preliminary validation against surface measurements at Barrow, Alaska, and the South Pole indicates uncertainties of about 25 Wm−2 in this dataset in polar regions (Reference Rossow and ZhangRossow and Zhang, 1995). Comparison with the measurements by Reference FletcherFletcher (1965) of incoming longwave radiation over the central Arctic indicates an annual root mean-squared (rms) error calculated as the (rms) difference of monthly means) of 23 Wm−2 for the GISS/ISCCP data and 53 Wm −2 for the DAO data.
Sensible heat flux
Sensible heat flux (F s) towards the surface was calculated in this study from the bulk aerodynamic formula
where ρ (1.2 kgm−3) and c p (3930 J kg−1 K−1) are the density and specific-heat capacity of air, V is the surface wind speed, T a is the surface-air temperature, T s is the surface temperature, and C H is the sensible-heat transfer coefficient. In the Hadley model, C H is calculated as a function of the atmospheric stability using the Monin-Obukhov similarity theory. In the absence of observed-stability information, however, C H was taken in this study as a constant 0.00175 following Reference Parkinson and WashingtonParkinson and Washington (1979).
In addition 10 the DAO output, the following data were used to calculate sensible heat fluxes. Monthly mean SSM/I wind speeds over the ocean were obtained from the Jet Propulsion Laboratory (Reference HalpernHalpern and others, 1995) for the years 1989–92. Monthly mean surface-air temperatures from land stations, ship observations, Soviet North Pole drifting-ice stations and Arctic drifting buoys from 1979 to 1992 were obtained from the Polar Exchange at the Sea Surface (POLLS) program, University of Washington, Seattle. Monthly mean sea-surface temperatures (SSTs) from the Along-Track Scanning Radiometer (ATSR) (Reference Zavordy, Mutlow and Llewellyn-JonesZavody and others, 1995; Reference Jones, Saunders and GuymerJones and others, 1996) between 1991 and 1995 were obtained from the Rutherford Appleton Laboratory.
Mean, minimum and maximum fluxes using the whole range of data sources were calculated in order to represent the uncertainly in the validation data. DAO air and sea-ice surface temperatures, however, appear to be too low compared with the POLES surface-air temperatures, resulting in anomalously large fluxes of sensible heat calculated using a mixture of the two. In the absence of accurate sea-ice surface temperatures, therefore, only the self-consistent DAO information was used to calculate sensible heat fluxes over consolidated sea ice. Comparison with the measurements by Reference FletcherFletcher (1965) indicate an annual rms error of 13 W m−2 for the sensible heal flux over consolidated ice in the central Arctic.
Latent heat flux
Latent heal flux (F 1) towards the surface was calculated from the bulk aerodynamic formula
where L is the lateni heat of vaporisation (2.5 × 10⁶ J kg−1 or of sublimation (2.834 × 10⁶ J kg−1) depending on whether an ice cover exists, C E is the latent heat exchange coefficient taken as 0.00175 following Reference Parkinson and WashingtonParkinson and Washington (1979), and q a is the surface-air specific humidity (from DAO). The surface-specific humidity q s is related to the saturation vapour pressure e s through the equation

where ϵ = 0.622 is the ratio of the molecular weight of water vapour to that of dry air, p (1.014 × 10⁵ Pa) is the surface pressure, and e s is given by (Reference Parkinson and WashingtonParkinson and Washington, 1979)
when the coefficients (a, b) = (9.5, 7.66) if an ice cover exists, or (7.5, 35.86) for open water. As with the sensible heat flux calculations. T s, was obtained from both DAO and ATSR. Comparison with the measurements by Reference FletcherFletcher (1965) indicate an annual rms error of 9 Wm−2 for the latent heat flux over consolidated ice in the central Arctic.
Sea Ice Comparison
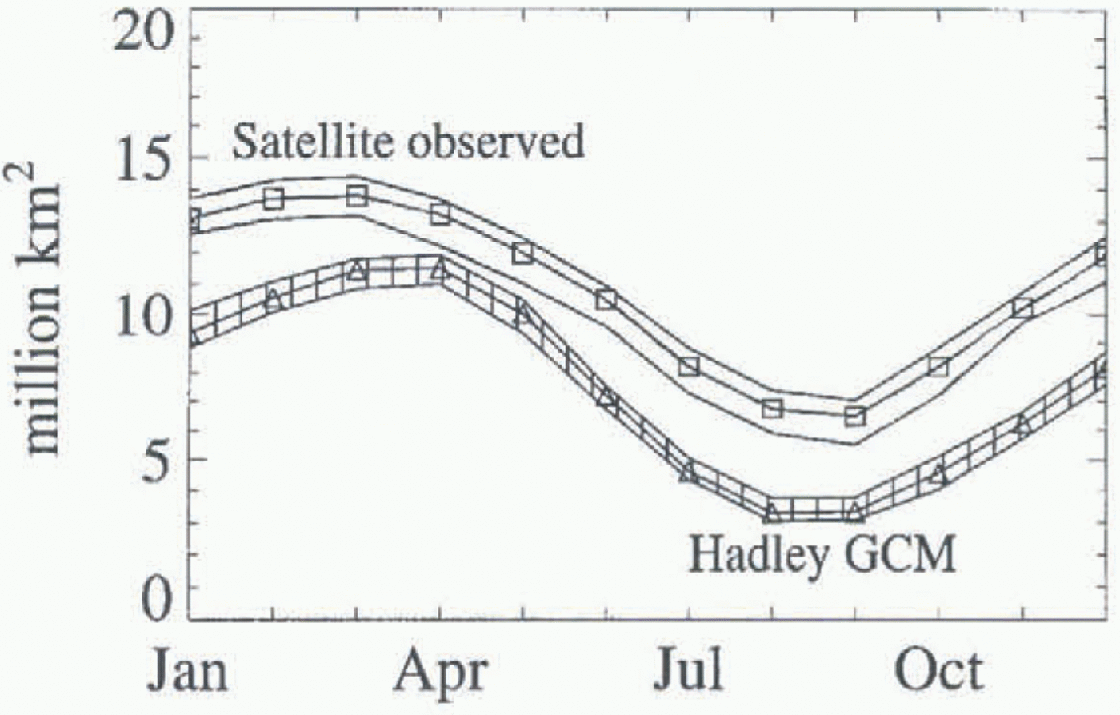
Figure 1 shows the 15 year mean, minimum and maximum annual cycle of total Arctic sea-ice area predicted by the Hadley GCM, compared with satellite observations. The Hadley GCM reproduces the seasonal cycle reasonably well, but underestimates the Arctic ice area by more than 3 × 10⁶ km2 for most of the year.

Fig. 1. Arcic sen-ice area from the Hadley GCM and SMMR/SSMI observations. Symbols show the 15 rear mean, and shaded regions show the variability
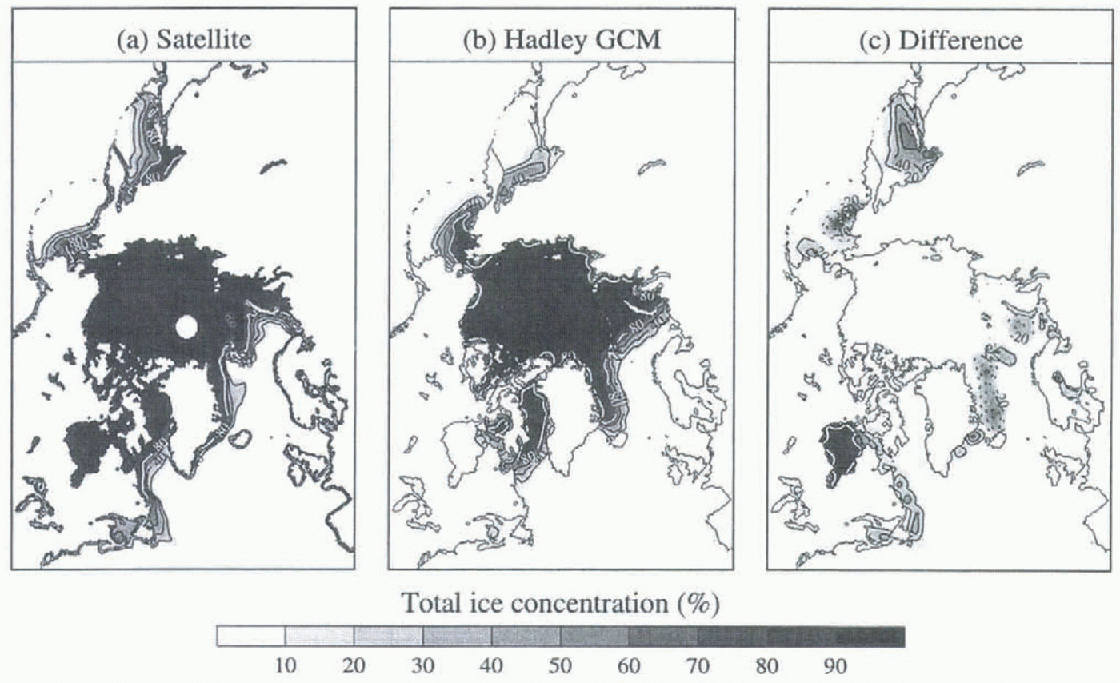
The mean distribution of sea ice for March is shown in Figure 2. The Hadley GCM slightly overestimates the ice concentration in the Greenland Sea, possibly as a result of the crude advection parameterisation, but significantly underestimates the concentration in Hudson Bay, the Sea of Okhotsk and the Labrador Sea. Failure of the model to produce sea ice in Hudson Bay alone results in an excess of heat input to the atmosphere of up to 0.2 PW during the winter.

Fig. 2. Mean Arctic sea-ice distribution for March. The difference is satellite minus Hadley. The contour interval is 20%. Dotted contours represent negative values
In order to establish the cause of the underestimation of sea ice by the model, the surface-energy budget for Hudson Bay is investigated in the next section.
Surface-Energy Budget of Hudson Bay
Parameters relevant to the energy budget of Hudson Bay are shown in Figure 3. There is excellent agreement between the validation dala and the Hadley GCM in August and September, but the failure of the Hadley model to produce sea ice results in overestimated values of surface-air temperature, specific humidity and cloud in the winter months. A comparison of surface fluxes is presented in Figure 4. The Hadley short wave and longwave fluxes are generally within the range of the DAO and GISS/ISCCP fluxes. The Hadley sensible and latent heat fluxes also agree very well with the validation data for the summer and autumn months (June-October). The formation of ice in November, however, rapidly closes the sensible and latent heat loss. Heat loss from leads has not been included in the validation data, but is likely to be small given that the winter-ice concentration in Hudson Bay is typically greater than 95%. Failure of the Hadley model to produce ice results in a net heat loss from the ocean of up to 200 Wm−2 throughout the winter.

Fig. 3. Evaluation of parameters relevant to the surface-energy budget of Hudson Bay

Fig. 4. Evaluation of surface-energy fluxes over Hudson Bay. Fluxes towards the surface are positive
Discussion
In the absence of advection, the ocean-surface temperature is governed by the net surface flux. A simple energy-balance calculation, assuming a mixed-layer depth of 30 m and an oceanic heat flux of 2 Wm −2 (Reference Parkinson and WashingtonParkinson and Washington, 1979), reveals that the net Hadley heal loss from Hudson Bay is easilv large enough to produce sea ice. Sea ice is prevented from forming in the Hadlley model by the flux adjustment (shown in Fig. 4), which, when added to the net flux, results in a heat loss that is far too small during the critical freeze-up period. A similar analysis not shown reveals that large flux adjustments also restrict ice formation in the Sea of Okhotsk.
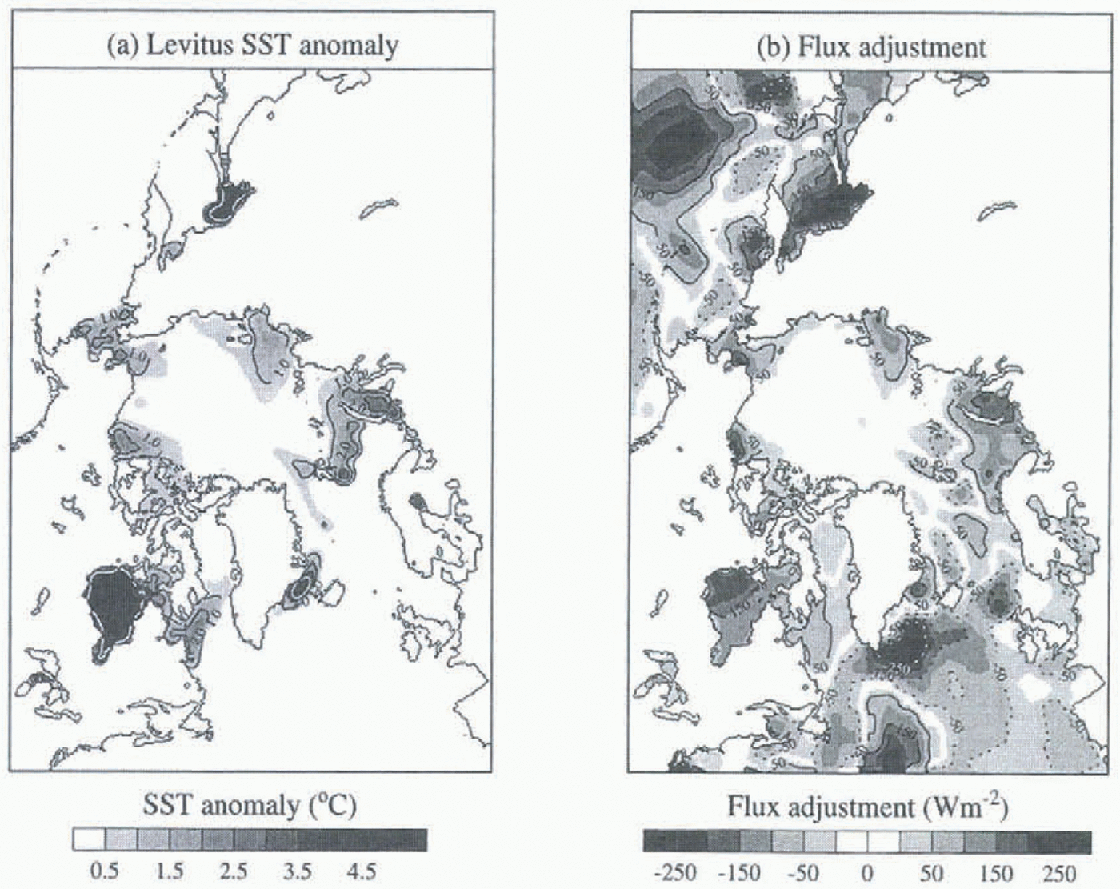
The flux adjustment is intended to prevent modelled SSTs from drilling away from the Reference LevitusLevitus (1982) climatology. Due to a lack of winter observations, however, the Levitus climatology appears to be inaccurate in sea-ice covered regions. For example, Figure 5 shows December Levitus SST anomalies, delined as the temperature above the freezing point of sea ice in the Levitus data in ice-covered regions. SST anomalies as large as 5°C in Hudson Bay and the Sea of Okhotsk translate to flux adjustments of more than 200 Wm−2 (Fig. 5b) and explain the failure of the Hadley model to produce ice in these regions. The Levitus SST climatology has recently been updated (Reference Levitus and BuyerLevitus and Boyer, 1994), but very similar SST anomalies persist in the Arctic regions. In the 1994 climatology (not shown), the magnitude of the SST anomaly is slightly reduced in the Sea of Okhotsk but increased in the Kara Sea in winter compared with the 1982 climatology.

Fig. 5. Levitus SST anomaly (a), defined as temperature above freezing point of sea ice in ice-covered regions, and Hadley GCM flux adjustment (b) in December. Negative values are shown by dotted contours
The results of this study hightlight a problem with the flux-adjustment procedure, arising from inaccuracies in the observed climatology. Even a perfect model will produce erroneous results if the climatology used to calculate flux adjustments is inaccurate. The manner in which errors in the climatology influence the final solution, however, depends on the way in which the model spin-up and flux adjustment is implemented. The Hadley model was spun-up with the atmosphere and ocean coupled, continuously modifying the sea-surface temperature and salinity with restoring terms proportional to the difference between modelled and climatological values. These restoring terms were diagnosed at the end of the spin-up, and used as fixed-flux adjustments in subsequent control and climate-change runs.
Other models (Reference Manabe, Stouffer, Spelman and BryanManabe and others, 1991; Reference CubaschCubasch and others, 1992) spin-up the atmosphere and ocean separately, and calculate flux adjustment as the difference between the surface fluxes diagnosed in the atmosphere and ocean models. If, for example, the atmosphere model was spun-up with the correct sea-ice climatology instead of the Levitus climatology, then it is likely that the flux adjustment would be completely different from that calculated from the Hadley approach. Indeed, it is possible that the flux adjustment in Hudson Bay could be negative, leading to exces sive ice build-up. The point is that the flux adjustment, however implemented, is likely to produce erroneous results if it is based on an inaccurate climatology. Furthermore, while the errors in the Lovitus SST climatology are relatively large in sea-ice covered regions of the Arctic, it is possible that much smaller errors occurring on a global scale might have a significant effect on the predicted climate. Future work should therefore be aimed both at improving the accuracy of global climatologies, and at improving the accuracy of climate models so that flux adjustment may be eliminated.
Failure of the Hadley model to produce enough sea ice in Hudson Bay and the Sea of Okhotsk does not explain the underprediction of the total sea-ice area in the summer (Fig. 1), because these regions are not ice-covered during the summer. The winter ice in the Beaufort Sea is <2 m thick in the Hadley model, compared with measured thicknesses >4 m (Reference Bourke and McLarenBourke and McLaren, 1992). It would appear, therefore, that the winter ice is too thin in the Hadley model, enabling too much to melt away in the summer. Further work is required to establish the extent and cause of this underprediction of ice thickness.
Conclusions
Au evaluation of Arctic sea ice predicted by the Hadley GCM against passive-microwave sea-ice concentrations reveals that, while the seasonal cycle is reasonably well reproduced, the Hadley model underestimates the total area of sea ice by about 3 × 10⁶ km2 throughout most of the year. Most of the error in winter ice area is accounted for by the failure of the Hadley model to produce ice in Hudson Bay and the Sea of Okhotsk. As a consequence, the heat input to the atmosphere from Hudson Bay alone is too large by up to 0.2 PW during the winter. The underestimated ice concentration in Hudson Bay and the Sea of Okhotsk was found to be caused by inaccuracies in the Reference LevitusLevitus (1982) SST climatology on which flux adjustments are based. Although it would be relatively easy to correct climatological SSTs in ice-covered regions (by resetting them to the freezing point of sea ice), and hence overcome some of the problems reported here, it is possible that flux adjustment based on uncertain climatological SSTs in other regions might lead to significant errors in the predicted climate. It is therefore important to develop improved climatologies, and, in the long term, models accurate enough not to require flux adjustment.
Acknowledgements
The authors wish to thank the following for producing and distributing data: the Data Assimilation Office (Code 910.3) and the Distributed Active Archive Centre (DAAC) (Code 902.2) at the Goddard Space Flight Centre, Greenbelt, MD, U.S.A., under the sponsorship of NASA’s Mission to Planet Earth program: the EOSDIMS NSIDC DAAC University of Colorado at Boulder, CO, U.S.A.; the Physical Oceanography DAAC, Jet Propulsion Laboratory, Pasadena, CA, U.S.A.; the ATSR processing team at Rutherford Appleton Laboratory, UK (funded by NERC); the ISCCP and Goddard Institute of Space Studies, MD, U.S.A.; and the POLES team, University of Washington, Seattle, U.S.A. The authors are grateful to colleagues at MSSL and the Hadley Centre, particularly H. Cattle, R. Wood and C. Gordon, for useful suggestions and discussions. The reviewers, particularly M. Morales Maqueda and G. Flato, are thanked for providing comments that improved this paper. The GCM integrations were performed with the aid of funding from DOE contract PECD 7/12/37. This work was funded by NERC, grant number GR3/9600.


