


Introduction
The McMurdo Dry Valleys (MDVs) comprise the largest area of ice-free land in Antarctica, and they are some of the most extreme environments on Earth (e.g. Levy Reference Levy2013). The average annual valley-bottom temperature is −19.6°C (Obryk et al. Reference Obryk, Doran, Fountain, Myers and McKay2020) and precipitation is < 10 cm year−1 water equivalent (Fountain et al. Reference Fountain, Levy, Gooseff and Van Horn2014). Despite the extreme cold and aridity, the area supports a diverse array of inland aquatic habitats, with a recent analysis reporting at least 6000 lentic water bodies, ranging from small, seasonally frozen ponds to large, perennially ice-covered lakes (Hawes et al. Reference Hawes, Howard-Williams, Gilbert and Joy2021). As with all deserts, water is a limiting resource in the MDVs, and its presence ‘produces a cascade of tightly coupled events that ultimately leads to biological production and cycling of elements’ (Priscu Reference Priscu and Priscu1998). Consequently, aquatic habitats are epicentres of biodiversity and ecosystem productivity, most of which being microbial, in an otherwise barren environment (Vincent & James Reference Vincent and James1996, Takacs-Vesbach et al. Reference Takacs-Vesbach, Zeglin, Barrett, Gooseff, Priscu, Doran, Lyons and McKnight2010, Chown et al. Reference Chown, Clarke, Fraser, Cary, Moon and McGeoch2015).
Diversity of habitat within and amongst inland water bodies of the MDVs is substantial and plays a significant role in sustaining a diverse range of microbial assemblages (Glatz et al. Reference Glatz, Lepp, Ward and Francis2006, Dolhi et al. Reference Dolhi, Teufel, Kong and Morgan-Kiss2015, Jungblut et al. Reference Jungblut, Hawes, Mackey, Krusor, Doran and Sumner2016, Ramoneda et al. Reference Ramoneda, Hawes, Pascual-García, Mackey, Sumner and Jungblut2021). A key habitat dichotomy is the split between the small, shallow water bodies that freeze seasonally and the large, deep lakes that maintain liquid water beneath permanent ice cover throughout the year. Different processes affect the habitats in shallow and deep water bodies, the former being structured by stress imposed during winter freezing (see Hawes et al. Reference Hawes, Safi, Sorrell, Webster-Brown and Arscott2011a,Reference Hawes, Safi, Webster-Brown, Sorrell and Arscottb) and varying degrees of salinization from the freeze and evaporative concentration of salts (Jungblut et al. Reference Jungblut, Wood, Hawes, Webster-Brown and Harris2012b, Archer et al. Reference Archer, McDonald, Herbold, Lee and Cary2015, Sakaeva et al. Reference Sakaeva, Sokol, Kohler, Stanish, Spaulding and Howkins2016). Deep lakes provide relatively stable habitats that avoid winter freezing beneath thick perennial ice cover, and the communities within them are strongly influenced by persistently low irradiance below ice cover, falling to zero for 3 months in winter (Neale & Priscu Reference Neale and Priscu1995, Vopel & Hawes Reference Vopel and Hawes2006, Patriarche et al. Reference Patriarche, Priscu, Takacs-Vesbach, Winslow, Myers and Buelow2021), and stable gradients of temperature and salinity with depth (Spigel & Priscu Reference Spigel, Priscu and Priscu1998, Vincent & Laybourn-Parry Reference Vincent and Laybourn-Parry2008, Jungblut et al. Reference Jungblut, Hawes, Mackey, Krusor, Doran and Sumner2016). The consequences of these differences are that microbial populations in shallow ponds that freeze solid are dominated by cyanobacterial mats that exploit abundant summer irradiance to accumulate substantial biomass and fix atmospheric nitrogen (Fernandez-Valiente et al. Reference Fernandez-Valiente, Quesada, Howard-Williams and Hawes2001, Moorhead Reference Moorhead2007) but remain dormant through winter, whereas perennially liquid lake environments contain complex and diverse planktonic communities, often with high prevalences of mixotrophs (Thurman et al. Reference Thurman, Parry, Hill, Priscu, Vick, Chiuchiolo and Laybourn-Parry2012) as well as species-diverse microbial mats that are finely tuned to extreme low irradiance but are slow net accumulators of carbon (Hawes et al. Reference Hawes, Safi, Sorrell, Webster-Brown and Arscott2010, Reference Hawes, Jungblut, Obryk and Doran2016) and rarely contain atmospheric nitrogen fixers (Wharton et al. Reference Wharton, Parker and Simmons1983, Zhang et al. Reference Zhang, Jungblut, Hawes, Andersen, Sumner and Mackey2015, Ramoneda et al. Reference Ramoneda, Hawes, Pascual-García, Mackey, Sumner and Jungblut2021).
The distinction between lake and pond systems neglects that the margins of lakes contain a moat sub-habitat (Wharton et al. Reference Wharton, Parker and Simmons1983) that alternates seasonally between being ice free and completely frozen. The moat habitat and similar dynamic marginal zones are also seen in perennially ice-covered Arctic lakes (Bégin et al. Reference Bégin, Rautio, Tanabe, Uchida, Culley and Vincent2021). From the few studies of MDV moats, they appear to share more functional and structural attributes with pond- and lake-ice habitats than under-ice communities (Wharton et al. Reference Wharton, Parker and Simmons1983, Hawes & Schwarz Reference Hawes and Schwarz1999, Lawson et al. Reference Lawson, Doran, Kenig, Des Marais and Priscu2004, Priscu et al. Reference Priscu, Adams, Pearl, Fristen, Dore, Lisle, Castello and Rogers2005, Ramoneda et al. Reference Ramoneda, Hawes, Pascual-García, Mackey, Sumner and Jungblut2021). To date, however, the extent to which the moat and main lake (‘main lake’ hereafter refers to the body of water that remains unfrozen in winter and perennially covered in ice) compartments of MDV lakes connect and the importance of that coupling in transferring organisms and resources between compartments are unknown. In temperate lakes, littoral to pelagic subsidies are often attributed to migrations of large, mobile predatory fish (e.g. Schindler et al. Reference Schindler, Carpenter, Cottingham, He, Hodgson, Kitchell, Soranno, Polis and Winemiller1996, Stewart et al. Reference Stewart, Hamilton, Baisden, Dedual, Verburg and Duggan2017). While fish are absent from MDV lakes, other organisms and mechanisms may link moat and main lake processes, albeit at a slower pace. In temperate lakes, near-shore lake habitat responses to stressors can be independent of open-water pelagic-zone processes, resulting in differences in biodiversity and ecological function that ultimately may regulate near-shore-open water linkages and fluxes (Vadeboncoeur et al. Reference Vadeboncoeur, Moore, Stewart, Chandra, Atkins and Baron2021). Extreme differences in stress regime between moat and main lake habitats can be expected to generate similar differences in community structure and function in Antarctic lakes.
Most MDV lakes occupy endorheic basins, and, when inflows are less than evaporation and ablation, lake levels drop. A rising trend in the levels of endorheic MDV lakes has been evident since records began in the 1970s, with there being no sign of easing in recent years (Castendyk et al. Reference Castendyk, Obryk, Leidman, Gooseff and Hawes2016, Doran & Gooseff Reference Doran and Gooseff2023). This rising lake-level trend has an immediate and profound effect on the moat environment. As lake level rises, soils on the lake margins are flooded and transition from terrestrial to aquatic moat ecosystems, whereas at the deep end the moat communities convert into the ‘main lake’ habitat (Hawes et al. Reference Hawes, Giles and Doran2014, Ramoneda et al. Reference Ramoneda, Hawes, Pascual-García, Mackey, Sumner and Jungblut2021), effectively increasing the pelagic habitable zone. The shifting moat ecotone is effectively an up-slope migration of the soil-moat and moat-lake boundaries. This migration moves benthic moat communities, and the nutrients that they contain, into the main lake. In addition, hydrodynamic connectivity between the water columns of the moats and the main lake provides another pathway for soil-moat-lake transfers and coupling of spatiotemporally discrete compartments (Bégin et al. Reference Bégin, Rautio, Tanabe, Uchida, Culley and Vincent2021).
In 2016, the Soil-Lake Inundation Moat Experiment (SLIME) was initiated to investigate the consequences of the gradual rise in lake level for MDV lakes by addressing the scale and significance of the coupling of soil, moat and lake processes on fluxes of organisms and materials between these compartments. Here, we describe the physicochemical environment and biological communities across the transition between the moat and pelagic environments in Lake Fryxell in Taylor Valley, southern Victoria Land, Antarctica. Specifically, we address a series of questions that define the nature of the moat habitat: 1) How are moats chemically, physically and biologically distinct from the main lake environment? 2) Where and for how long are moat communities in liquid water? 3) What are the sources of water and ions to the moats? 4) How are the moat and main lake processes connected, if at all?
Study site
Lake Fryxell (77°36 S, 162°6 E) is located near the eastern end of Taylor Valley; an ice-free valley in southern Victoria Land, Antarctica (Fig. 1). At 5.0 × 1.5 km in extent and with a maximum depth of ~20 m, it is one of the larger water bodies within the MDVs. The main lake is covered by ~4.5 m of perennial ice (Green et al. Reference Green and Lyons2009, Obryk et al. Reference Obryk, Doran, Hicks, McKay and Priscu2016). Water is supplied by 13 glacial meltwater streams, with most water coming from the Canada and Commonwealth glaciers (Miller & Aiken Reference Miller and Aiken1996, McKnight et al. Reference McKnight, Niyogi, Alger, Bomblies, Conovitz and Tate1999). Like most lakes of the MDVs, there is no outflow, and water balance is achieved by evaporation and ablation from the surface (Lyons et al. Reference Lyons, Welch, Snyder, Olesik, Graham, Marion and Poreda2005, Dugan et al. Reference Dugan, Obryk and Doran2013). The level of Lake Fryxell has varied over time as this water balance oscillates from positive to negative (Chinn Reference Chinn, Green and Friedmann1993, Myers et al. Reference Myers, Doran, Tulaczyk, Foley, Bording and Auken2021). In recent decades, the lake level has been increasing in a series of cycles of rapid level rise interspersed amongst periods of relative stability or brief decline (Bomblies et al. Reference Bomblies, McKnight and Andrews2001, Gooseff et al. Reference Gooseff, Wlostowski, McKnight and Jaros2017).
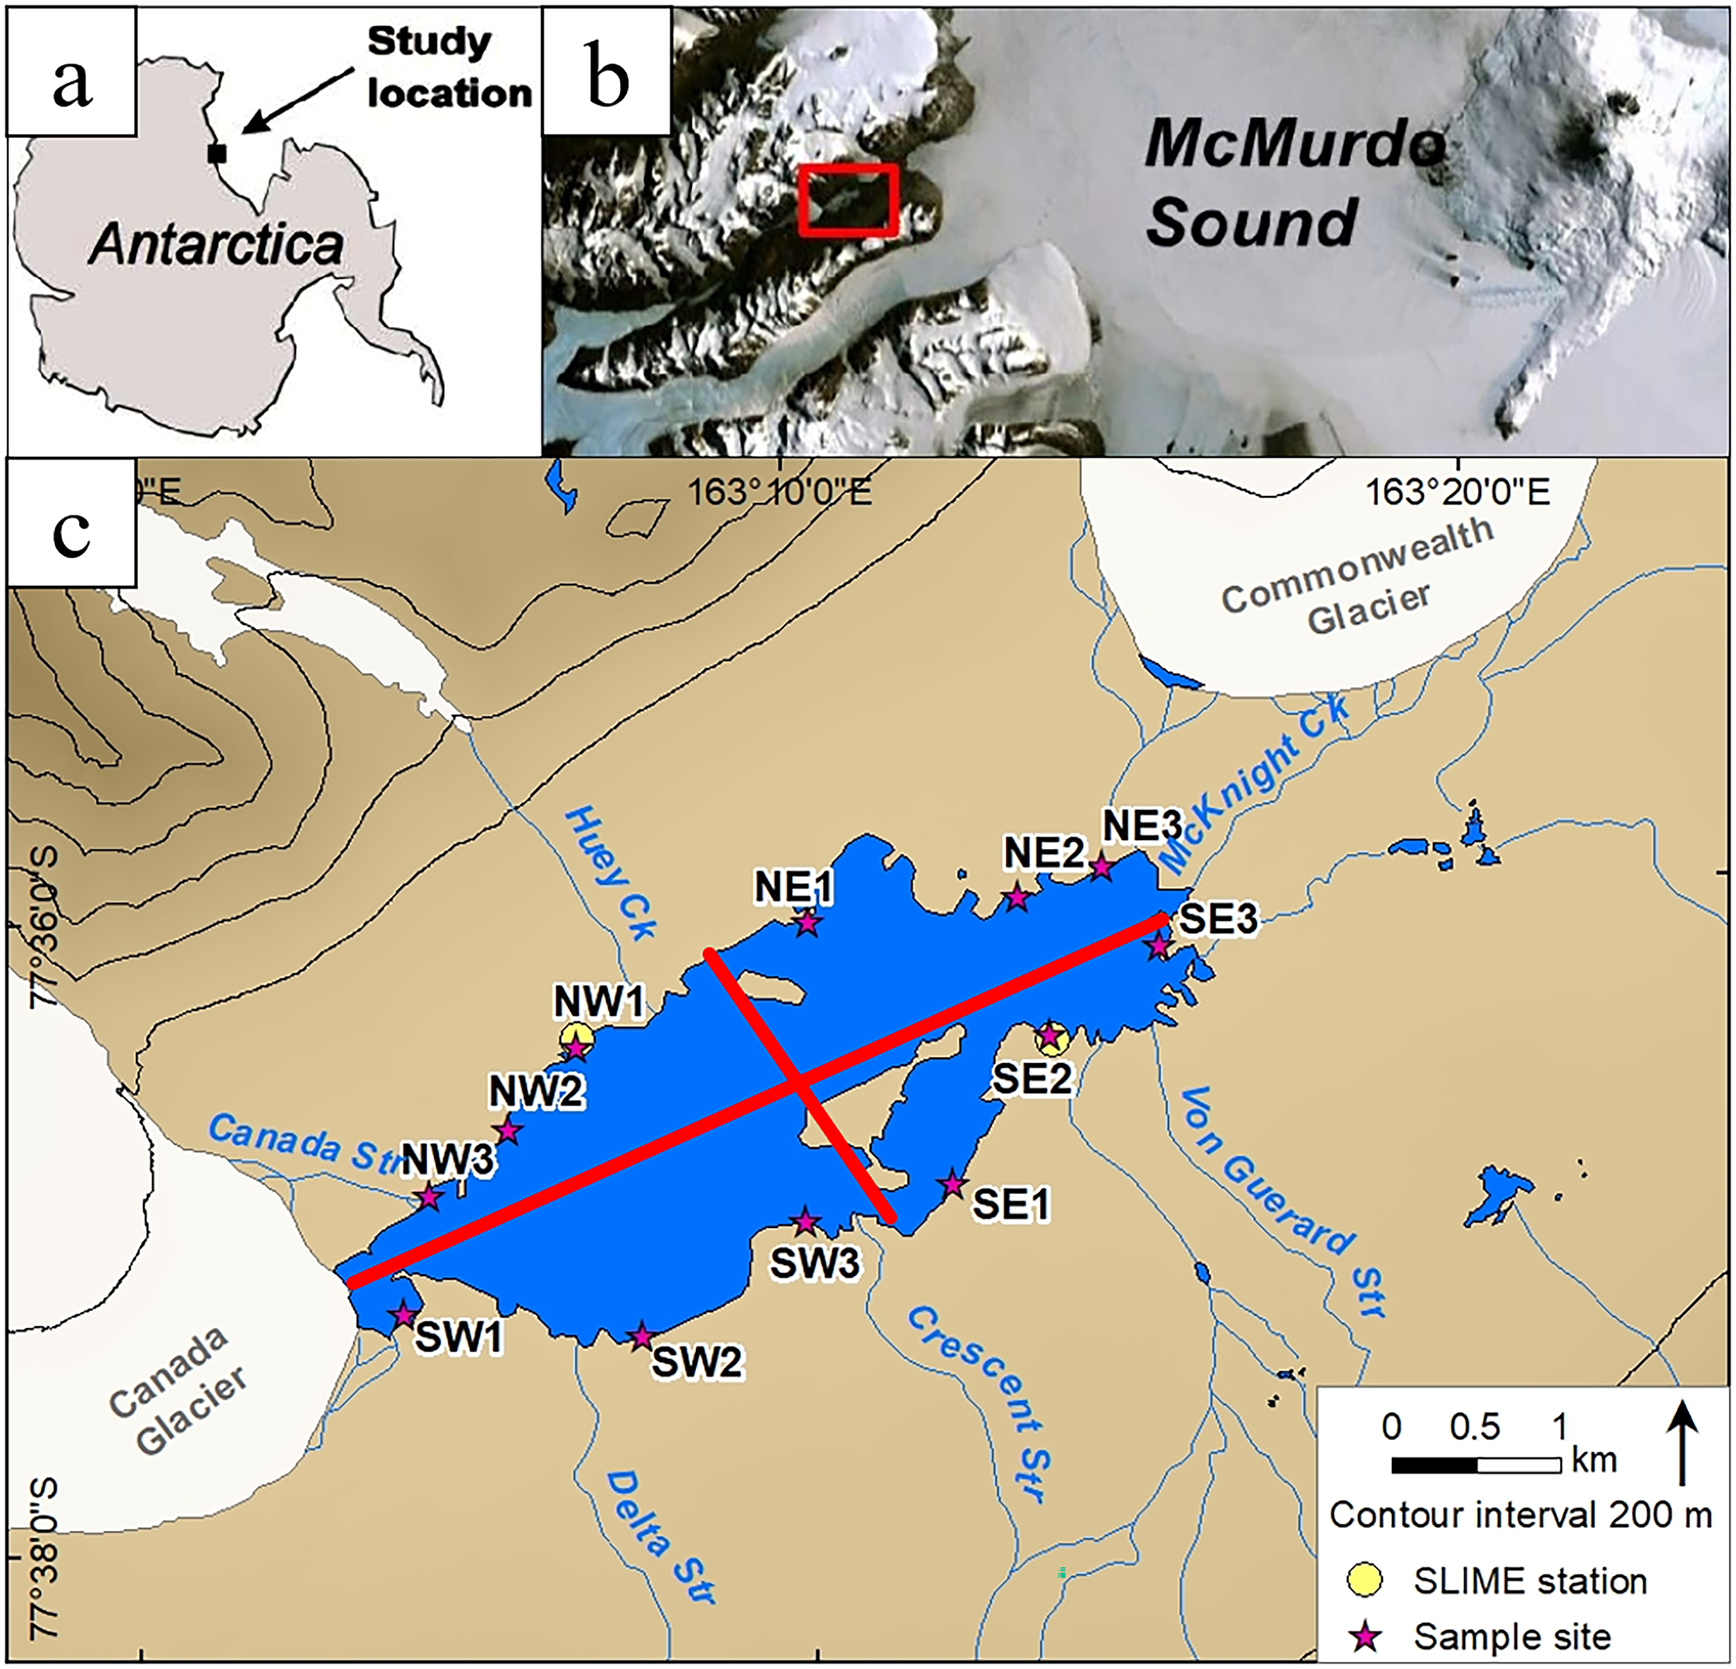
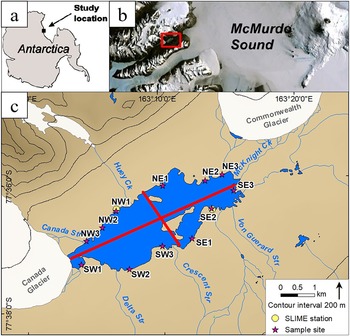
Figure 1. Location map. a. Location of study site on the Antarctic continent. b. Zoomed-in map showing the study site location on the coast of McMurdo Sound (red box shows the location of c.). c. Close-up view of the Lake Fryxell region. Numbers are sample sites for our synoptic ion sampling, divided into four quadrants, as indicated by the red lines. Sample quadrants are designated by their general cardinal direction. Sites SE2 and NW1 correspond to our two Soil-Lake Inundation Moat Experiment (SLIME) sites.
Under the perennial ice cover of Lake Fryxell, the water column is density stabilized (stratified) by increasing salinity with depth (Spigel & Priscu Reference Spigel, Priscu and Priscu1998) - a legacy of the concentration of ions during historical periods of lake-level decline (Lyons et al. Reference Lyons, Welch, Snyder, Olesik, Graham, Marion and Poreda2005). This stratified water column supports diverse microbial communities. An oxygenic phototrophic zone extends to ~10 m depth and is composed of active, vertically stratified microbial planktonic communities, which have been shown to be largely nitrogen deficient in the upper waters (Vincent Reference Vincent1981, Priscu et al. Reference Priscu, Vincent and Howard-Williams1989, Priscu Reference Priscu1995, Teufel et al. Reference Teufel, Li, Kiss and Morgan-Kiss2017), and a complex microbial benthic community forming elaborate mat structures (Jungblut et al. Reference Jungblut, Hawes, Mackey, Krusor, Doran and Sumner2016, Dillon et al. Reference Dillon, Hawes, Jungblut, Mackey, Eisen, Doran and Sumner2020). At ~10 m depth, the lake water column becomes euxinic, and a sulphide-based anoxygenic photosynthetic zone is found in both benthic (Sumner et al. Reference Sumner, Hawes, Mackey, Jungblut and Doran2015, Jungblut et al. Reference Jungblut, Hawes, Mackey, Krusor, Doran and Sumner2016) and planktonic communities (Priscu et al. Reference Priscu, Priscu, Vincent and Howard-Williams1987, Karr et al. Reference Karr, Sattley, Jung, Madigan and Achenbach2003).
A dynamic moat zone exists near the lake shore, where lake ice freezes to the lakebed in winter but during summer gains sufficient heat to melt, forming an area of relatively thin ice or melting completely to create open water (Fig. 2; Wharton et al. Reference Wharton, Parker and Simmons1983). This moat is distinct from the bulk of the lake, receiving much greater light penetration and wind-driven mixing in summer and alternating between frozen and liquid on a seasonal basis (Hawes & Schwarz Reference Hawes and Schwarz1999). The moats of the MDV lakes are known to support dense, perennial microbial mats (Parker et al. Reference Parker, Simmons, Love, Wharton and Seaburg1981, Wharton et al. Reference Wharton, Parker and Simmons1983, Taton et al. Reference Taton, Grubisic, Brambilla, De Wit and Wilmotte2003).
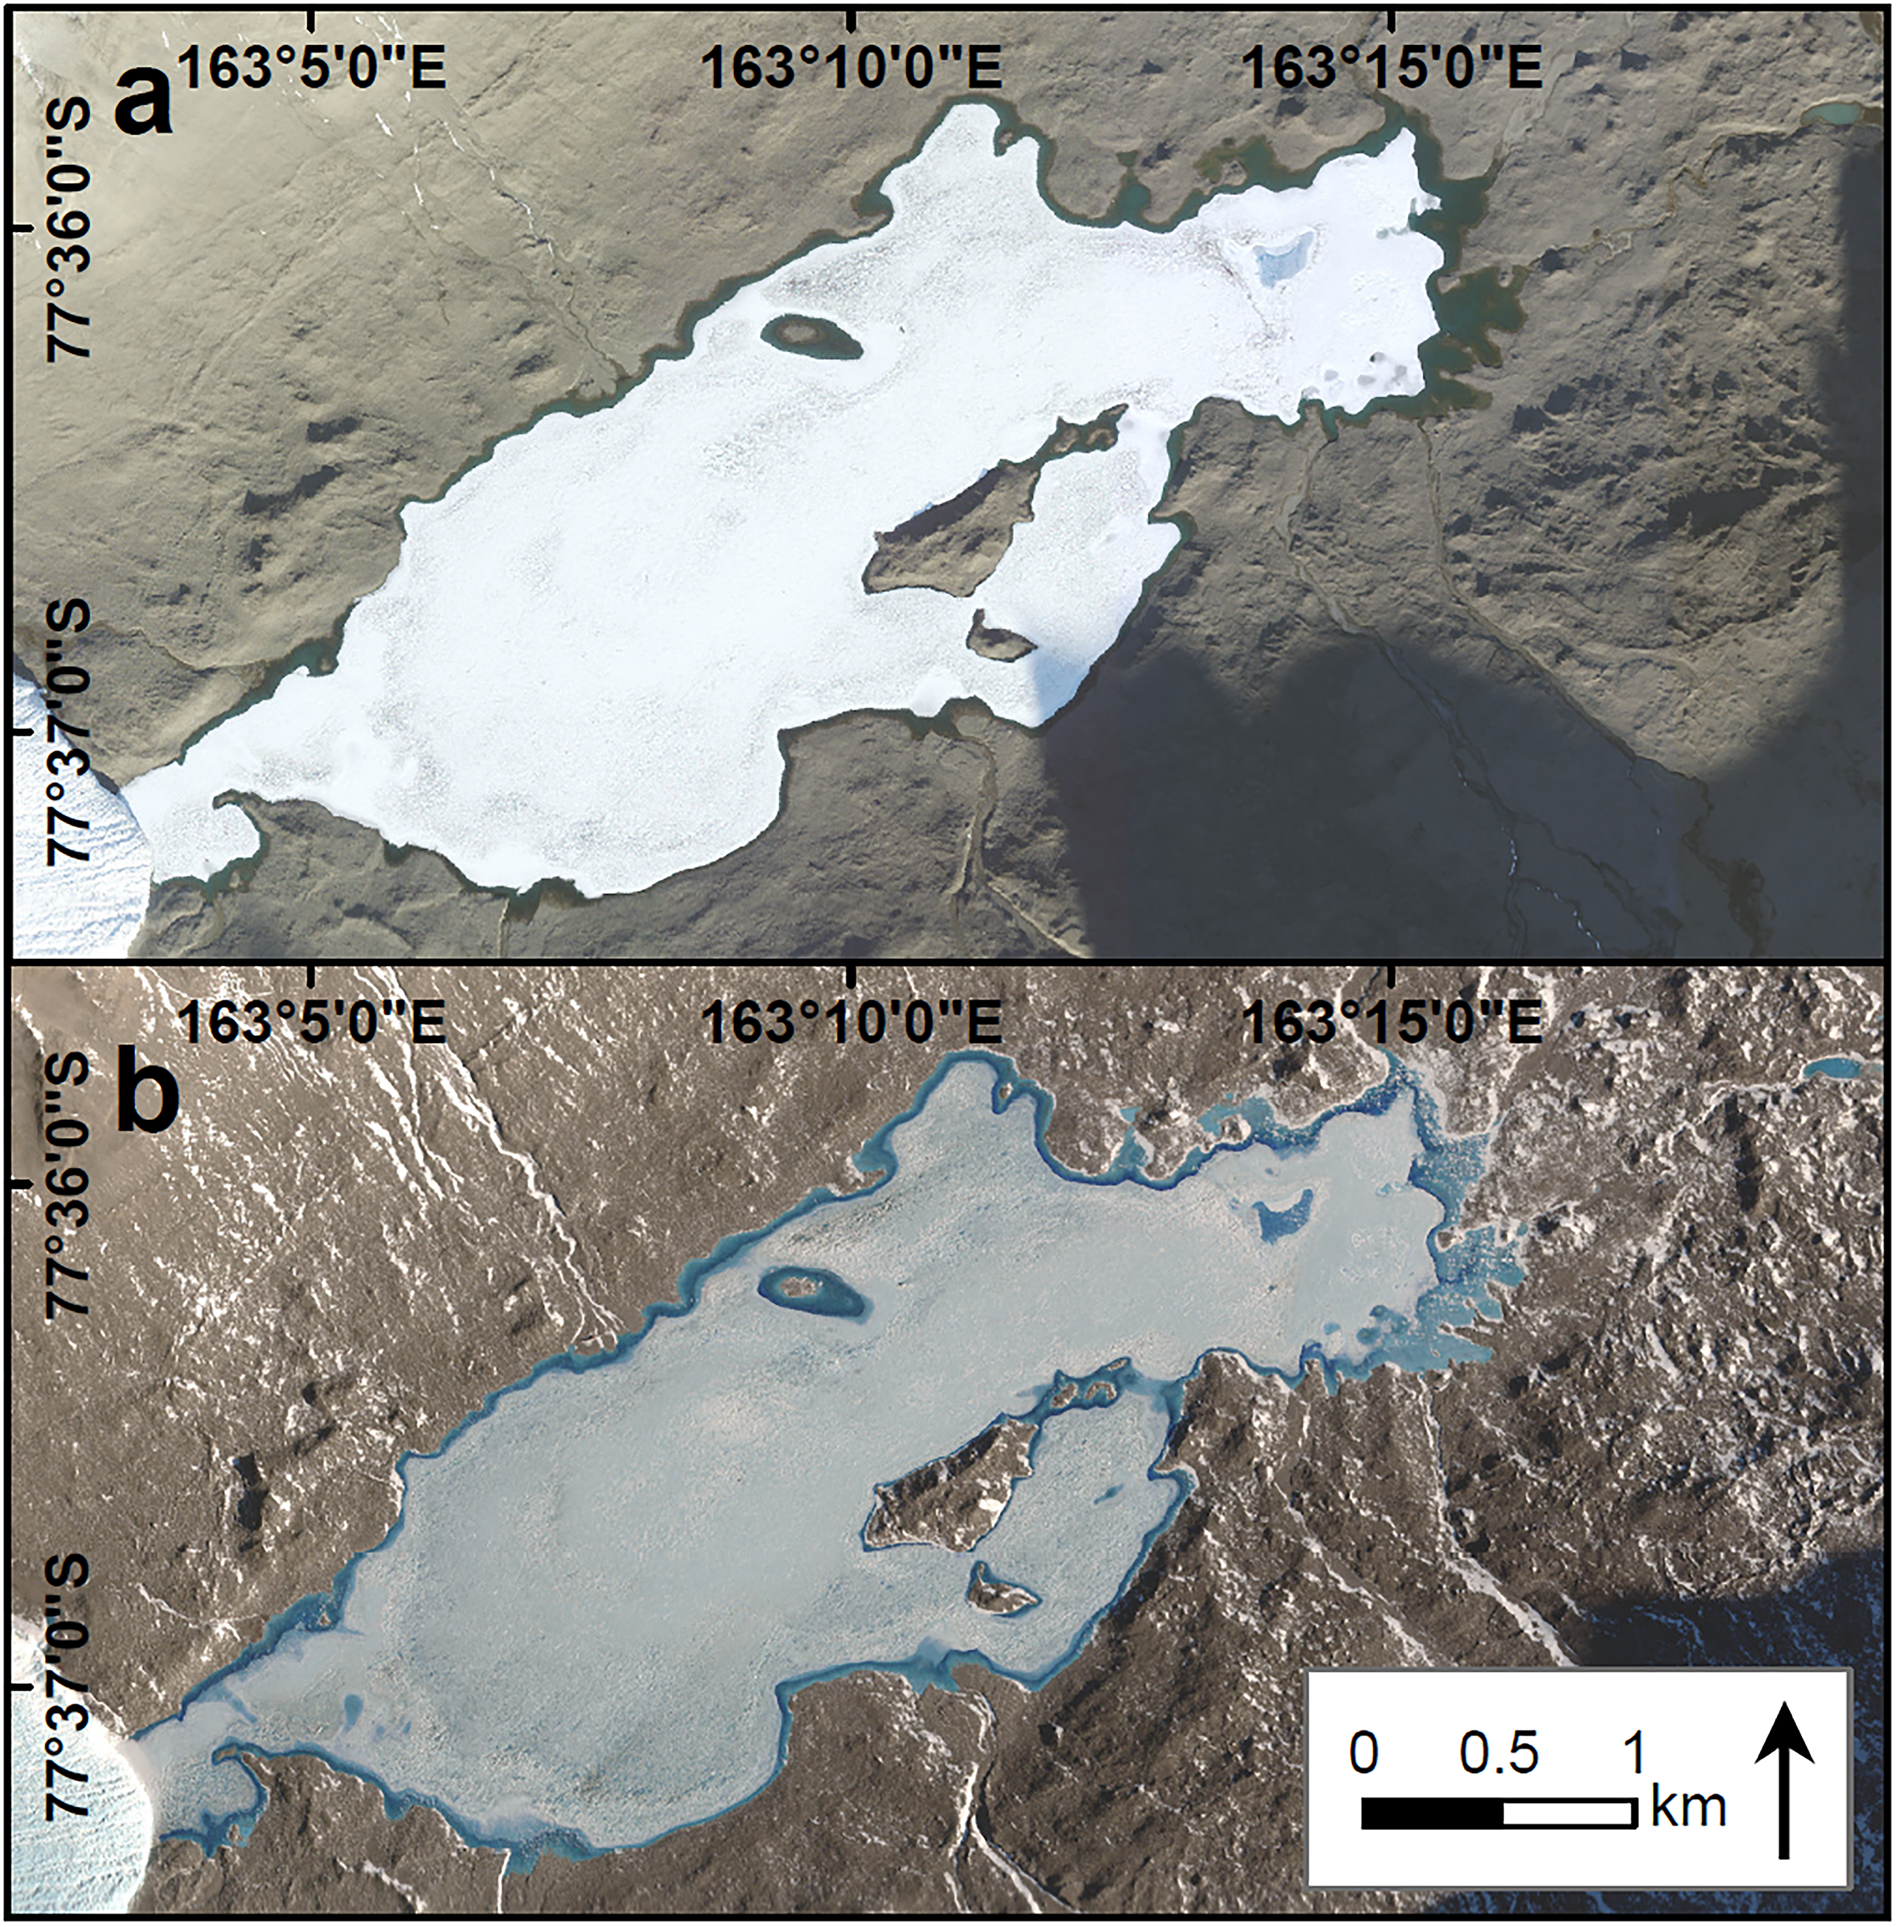
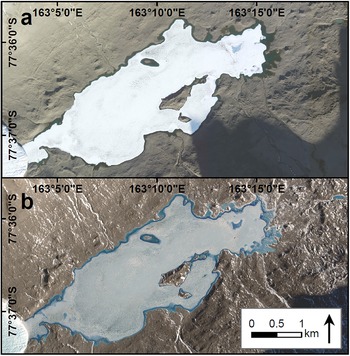
Figure 2. WorldView-2 imagery of Lake Fryxell displaying a. a fully open moat on 15 January 2011 and b. the refrozen moat following the winter on 4 November 2011. A record of maximum annual open moat area at Lake Fryxell has been maintained since the 2009–2010 summer. Images have been brightened and gamma-enhanced to make the features more visible. Differences in lake-ice albedo are a product of image enhancements and the atmospheric conditions and time of day during image acquisition.
Methods
Near-shore morphometric changes
A manual record of lake level has been maintained for Lake Fryxell since 1971 (Barrett et al. Reference Barrett, Virginia, Wall, Doran, Fountain, Welch and Lyons2008, Doran & Gooseff Reference Doran and Gooseff2023). In order to understand the morphometric response of the near-shore environment to changes in lake level, we modelled lake level-driven changes in the shallow-water (≤ 1 m deep) area of the lake. A hypsometric curve for Lake Fryxell (M.S. Stone et al. unpublished data) was used to estimate the area of the lake at each lake level and the corresponding area of the lake at 1 m deep. The latter was subtracted from the former to estimate the area of the lake 1 m deep at the time of each lake-level measurement.
SLIME station data
Two Campbell Scientific CR1000s in enclosures were set up at the north and south shore study sites. Each datalogger was equipped with the following sensors installed to the datalogger according to the manufacturer's instructions: 1) thermocouples constructed from Omega T-Type Thermocouple wire (part number TT-T-10-SLE-1000); stripped (~1.5 cm), twisted and soldered before being taped, enclosed with heat shrink and fixed in custom white PVC shields to shade them from the sun, these thermocouples were secured in the lake at depths of 0, 0.25, 0.50, 0.75 and 1.00 m, 2) a LI-COR spherical photosynthetically active radiation (PAR) sensor (LI193) on a 2222UWB Underwater Cable, secured at 0.5 m depth in the lake and 3) an LI-190 Quantum sensor (south station only) installed on a 3 m mast. Measurements for all of these parameters were made every 60 s and averages logged at 15 min intervals.
Ice-thickness surveys
Ice thickness was assessed at the two sites from late November 2019 through to late January 2020. Methods differed slightly during that time, dictated by the changing ice conditions. Initially, a series of single holes was drilled through the ice cover at set distances from shore (every 5 to 25 m distance, then at 35 and 50 m offshore) using a Kovacs ice drill. At each hole the thickness of the ice and the depth to the lakebed were measured to ±1 cm using a weighted tape. As the summer progressed, the thinning and softening of the ice allowed triplicate holes to be drilled at similar distances from the shore. Finally, late in the summer, the marginal ice could not be used as a platform, but divers were able to swim freely under the moat ice, and a more intensive ice-thickness mapping exercise was undertaken. A diver swam a transect from the shore to under the ice of the main lake basin, measuring the depth of the underside of the ice and the lakebed immediately below that measurement to 0.1 m accuracy with a calibrated pressure gauge.
The variety of methods used in assessing the ice-lake bottom relationships, variability in the exact locations of the holes and irregularity of the lake bottom meant that the relationship between depth and distance from the shore varied or was not known. To allow for representation of the ice-thickness data along a shore-to-lake axis, we used all data where lake depth and distance to the shore were available to construct a fourth-order polynomial that predicted the average depth at a given distance offshore at the north site, where most data were obtained. We used this relationship to link lake depth to distance offshore in all graphical representations.
Specific conductance and temperature
Profiles of under-ice conductance and temperature along the lake floor were measured by a diver swimming with a RBR Concerto conductivity, temperature and pressure (depth; CTD) sensor logging at 1 s intervals. The diver swam a transect perpendicular to the shore from 10 m depth to the lake shallows, placing the CTD on the bed for 30 s at 0.1–0.2 m vertical intervals. The diver was careful to keep the CTD well in front and away from fin turbulence. The data were used to generate a conductivity and temperature vs depth profile that followed the lake bottom from 10 m depth towards the shore rather than a traditional vertical depth profile through the centre-lake under-ice water column.
Water sampling and ion analysis
Water and ice samples for major ion analysis were collected using clean sampling methods, employing a variety of techniques depending on the water depth or state. In November 2017, prior to any surface melting, a 2.26 m core of moat ice was collected from the north shore of Lake Fryxell near the northern SLIME site using a Snow, Ice and Permafrost Research Establishment (SIPRE) ice corer fitted with a power head. The core was frozen to the lakebed. The ice core was put into clean lay-flat high-density polyethylene (HDPE) tubing and stapled shut after collection, and it was later sectioned with a bandsaw into 3–4 cm segments. The resulting ice pucks were rinsed with deionized water (DIW) until almost 1 cm was melted, and the rinse was discarded. The remaining ice was placed into a pre-combusted, DIW-rinsed glass funnel, and the sample was allowed to melt into pre-cleaned HDPE sample bottles.
Stream samples were collected by dip sampling at locations close to where the stream discharges into the lake. For synoptic surveys of moat water at 12 sites around the lake perimeter (Fig. 1), the moat water was sampled from the lake-ice edge by reaching ~30 cm below the water surface. A peristaltic pump was used to collect moat and lake water samples from below the moat and permanent lake ice at depths from 0.5 m down to ~6.0 m. A site-dedicated 5-L Niskin sampler was used for the lake water column samples collected under the permanent lake ice cover.
Samples for ion analysis were filtered through 0.4 μm Whatman Nuclepore polycarbonate membrane filters shortly after collection or melting and collected into acid-washed HDPE bottles (for cations) and DI-rinsed bottles (for anions). Samples for cation analysis were acidified with ultra-clean nitric acid to pH ~2 (0.05–0.50% HNO3). All samples were maintained at +4°C at the field location, in transit to the laboratory and until analysis at Crary Lab, McMurdo Station. Ions were analysed according to methods described in Welch et al. (Reference Welch, Lyons, Whisner, Gardner, Gooseff, McKnight and Priscu2010) using Dionex DX-120 and Thermo Dionex Aquion ion chromatography instruments.
Estimation of water column chlorophyll a
Water samples for the extraction of planktonic chlorophyll a were collected using a peristaltic pump and a weighted silicone rubber hose lowered through a hole drilled through the lake ice or from the edge of moat ice. From each sample, 1 l was filtered through a Whatman glass fibre filter, and the filter was stored frozen (−20°C) before analysis. Analysis was spectrofluorometric after extraction into 90% acetone using the method of Welschmeyer (Reference Welschmeyer1994).
Microbial mat and underlying sediment collection
Microbial mats covered most of the bottom of the lake from the perimeter to at least 8 m depth. For estimation of biomass and composition, five replicate samples were collected from each target depth (0.25, 0.50, 0.75, 1.00, 1.25, 1.50 and 2.00 m in the moat and 4.5, 6.0 and 8.0 m in the main lake). Where possible, corers made from cut-off 60 ml disposable syringes (25 mm diameter) were used. Divers pressed corers through the microbial mat into the underlying sediment to a distance of ~5 cm. On return to the surface, the cores were extruded and separated into three components: a cohesive, pigmented microbial mat (active mat; AM), an unpigmented, flocculant, organic-rich underlayer (organic layer; OL) and the upper 10 mm of the underlying primarily mineral sediment (sediment layer; SL). Each layer was placed into a 15 or 50 ml Falcon tube. Not all samples in shallow waters contained the middle organic layer, and in these cases it was recorded as absent and considered to contribute no biomass. In some shallow samples, coarse underlying sediments precluded coring, and instead a corer was used to delineate the sample area, and the AM, OL (where present) and SL samples were scooped into 50 ml Falcon tubes.
Mat and sediment samples were frozen (−20°C) then lyophilized, homogenized and weighed using sterile techniques prior to subsampling for carbon and nitrogen and molecular analyses.
Carbon and nitrogen composition
Pre-weighed subsamples for organic carbon and nitrogen analysis were first treated with 1 M hydrochloric acid (HCl) for 12 h to remove carbonates. The residues were rinsed thoroughly with ultra-pure (18 MΩ) Milli-Q water until the solution reached neutral pH. The rinsed samples were dried at 60℃ overnight. A known amount (40–60 mg) of acid-washed sample was weighed into clean tin capsules for carbon and nitrogen analysis by combustion and gas chromatography using a Carlo-Erba elemental analyser. Carbon and nitrogen masses were expressed per unit area based on the ratio of subsample to total sample weight and core area.
Community structure
Lyophilized subsamples (0.2–1.0 g) of microbial mat were mixed with an equal mass of sucrose lysis buffer (SLB), frozen and stored at −20°C to −80°C until being analysed. The addition of SLB has been shown to preserve community composition effectively at ambient to low temperatures (Mitchell & Takacs-Vesbach Reference Mitchell and Takacs-Vesbach2008). DNA was extracted from the mat material using a variation of the hexadecyltrimethylammonium bromide (CTAB) method described in Mitchell & Takacs-Vesbach (Reference Mitchell and Takacs-Vesbach2008). Briefly, two volumes of CTAB buffer (1% CTAB, 0.75 M NaCl, 50 mM Tris pH 8, 10 mM EDTA) and proteinase K (final concentration 100 μg/ml) were added to samples and incubated for 1 h at 60°C on a continuous rotator. Sodium dodecyl sulphate was added to a final concentration of 2%, and samples were incubated for another 30 min on the rotator.
DNA was purified by adding an equal volume of phenol:chloroform:isoamyl alcohol (50:49:1) to the samples, followed by two extractions with an equal volume of chloroform. DNA was precipitated by the addition of 0.1 volume of 3 M sodium acetate and two volumes of 95% ethanol, followed by overnight incubation at −20°C. The samples were then centrifuged for 45 min (~21k × g), washed in 70% ethanol and resuspended in 10 mM filter-sterilized Tris buffer pH 8.0.
Samples were prepared for dual-index paired-end amplicon sequencing of the small subunit (SSU) of rRNA genes (16S and 18S rRNA genes) using V6 universal bacterial primers 939F 5'-TTG ACG GGG GCC CGC ACA AG-3' and 1492R 5'-GTT TAC CTT GTT ACG ACT T-3' (16S rRNA gene) and 1391F 5'-GTA CAC ACC GCC CGTC-3' and EukBR 5'-GTA CAC ACC GCC CGTC-3' for eukaryotic 18S rRNA genes (Amaral-Zettler et al. Reference Amaral-Zettler, McCliment, Ducklow and Huse2009, Stoeck et al. Reference Stoeck, Bass, Nebel, Christen, Jones, Breiner and Richards2010, Caporaso et al. Reference Caporaso, Lauber, Walters, Berg-Lyons, Huntley and Fierer2012). Primers included overhang adapter sequences for compatibility with Illumina index and sequencing adapters. Polymerase chain reaction (PCR) was performed in triplicate using 5Prime Hot Master Mix and a 55°C annealing temperature for 30 cycles. Amplicons were cleaned and normalized using the Sequelprep kit (Fisher Science) and indexed using the Nextera XT index kit following the manufacturer's instructions. Indexed amplicons were combined and cleaned using the AMPure XP bead-cleaning kit. The library was run on an Illumina MiSeq using the v3 reagent kit with 18% PhiX sequencing control DNA. DNA sequence data were analysed in QIIME2 (Bolyen et al. Reference Bolyen, Rideout, Dillon, Bokulich, Abnet and Al-Ghalith2019). Data were filtered, trimmed and interleaved using DADA2 (Callahan et al. Reference Callahan, McMurdie, Rosen, Han, Johnson and Holmes2016). Taxonomic assignments were made using the pre-trained naïve Bayesian classifier and the Silva database training set v.138.
For biodiversity analyses, we used square root-transformed, standardized 16S rRNA gene amplicon sequence variant (ASV) data for bacteria and, for eukaryotes, 18S rRNA gene ASVs. All were analysed using Primer 7 (www.primer-e.com). Bray-Curtis resemblance matrices were calculated using non-metric multidimensional scaling (NMDS), with 100 random restarts, plotted in two dimensions. Using moat/lake and north/south site location as factors, groupings within the resemblance matrix were tested for significance using permutational multivariate analysis of variance (PERMANOVA), also within Primer 7.
Results
Lake-level and near-shore morphometry
The level of Lake Fryxell has risen intermittently throughout the lake-level record (Fig. 3a). Total lake surface area increases as lake-level rises, but, due to the topography of the lake basin, these changes are not directly proportional (Fig. 3b). Similarly, the irregularly shaped shoreline and large islands in the lake mean that the surface area of shallow regions of the lake (≤ 1 m deep) does not co-vary with lake level or with lake surface area, and at times the surface area of these shallow regions decreases as lake level rises (Fig. 3b).
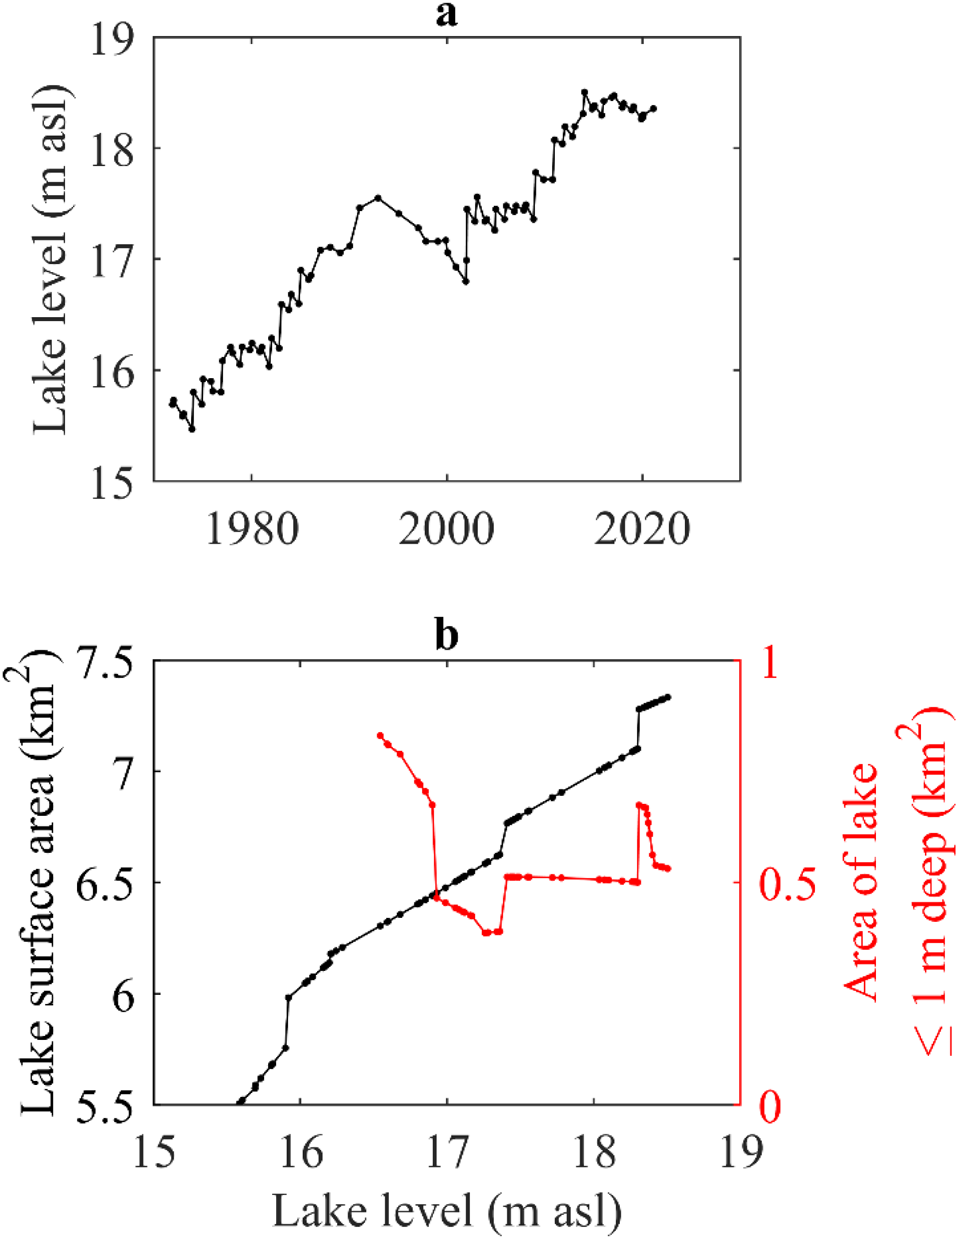
Figure 3. Lake-level and morphometry changes. a. Manually measured level of Lake Fryxell through time. b. Relationship between lake level and the total lake surface area of Lake Fryxell (black line) and between lake level and the surface area of shallow regions of the lake (≤ 1 m deep; red line). The area of the shallow regions is very responsive to the rate of change in lake surface area. When lake surface area changes at a constant rate with lake-level rise, the area of the shallow region does not change. However, when the rate of lake surface-area change varies, the area of the shallow region can change dramatically. m asl = metres above sea level.
Ice dynamics
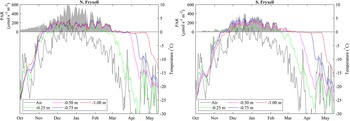
In early October 2018, daily average temperatures of the lake bottom at all depths from 1 m to the shoreline at both SLIME sites were close to −20°C (Fig. 4). There was a steady increase in temperature through October and mid-November, with day-to-day variability tracking that of air temperature, but an increasing damping of temporal variability with depth into the frozen moat. The two sites on the north and south shores of Lake Fryxell exhibited similar warming patterns, and both reached 0°C at all depths in early to mid-November 2018. All thermocouples then remained at or oscillated close to freezing for 5–14 days before rising to consistently positive temperature, a period that we attribute to the need to overcome the latent heat of melting. The order with which depths reached and then exceeded melting point was 1.00, 0.75, 0.50 and 0.25 m. Positive temperatures at the lake bottom indicated the presence of liquid water at all depths before air temperature was > 0°C and before any liquid water was observed at the lake surface. The north site moat became ice free from 7 to 25 January 2019, after which overnight freezing occurred regularly. The south site was not observed to be ice free during this period. Daily oscillations in temperature were evident except during the latent heat period, the amplitude of which decreased with depth (Supplemental Fig. 1). Maximum amplitude over 24 h was 10°C at 0.25 m and 3°C at 1.00 m depth. At both sites, maximum daily average summer temperatures in the moat approached 5°C. In-water PAR at both sites was maximal from December 2018 to January 2019, with daily averages being highest at the ice-free northern site.
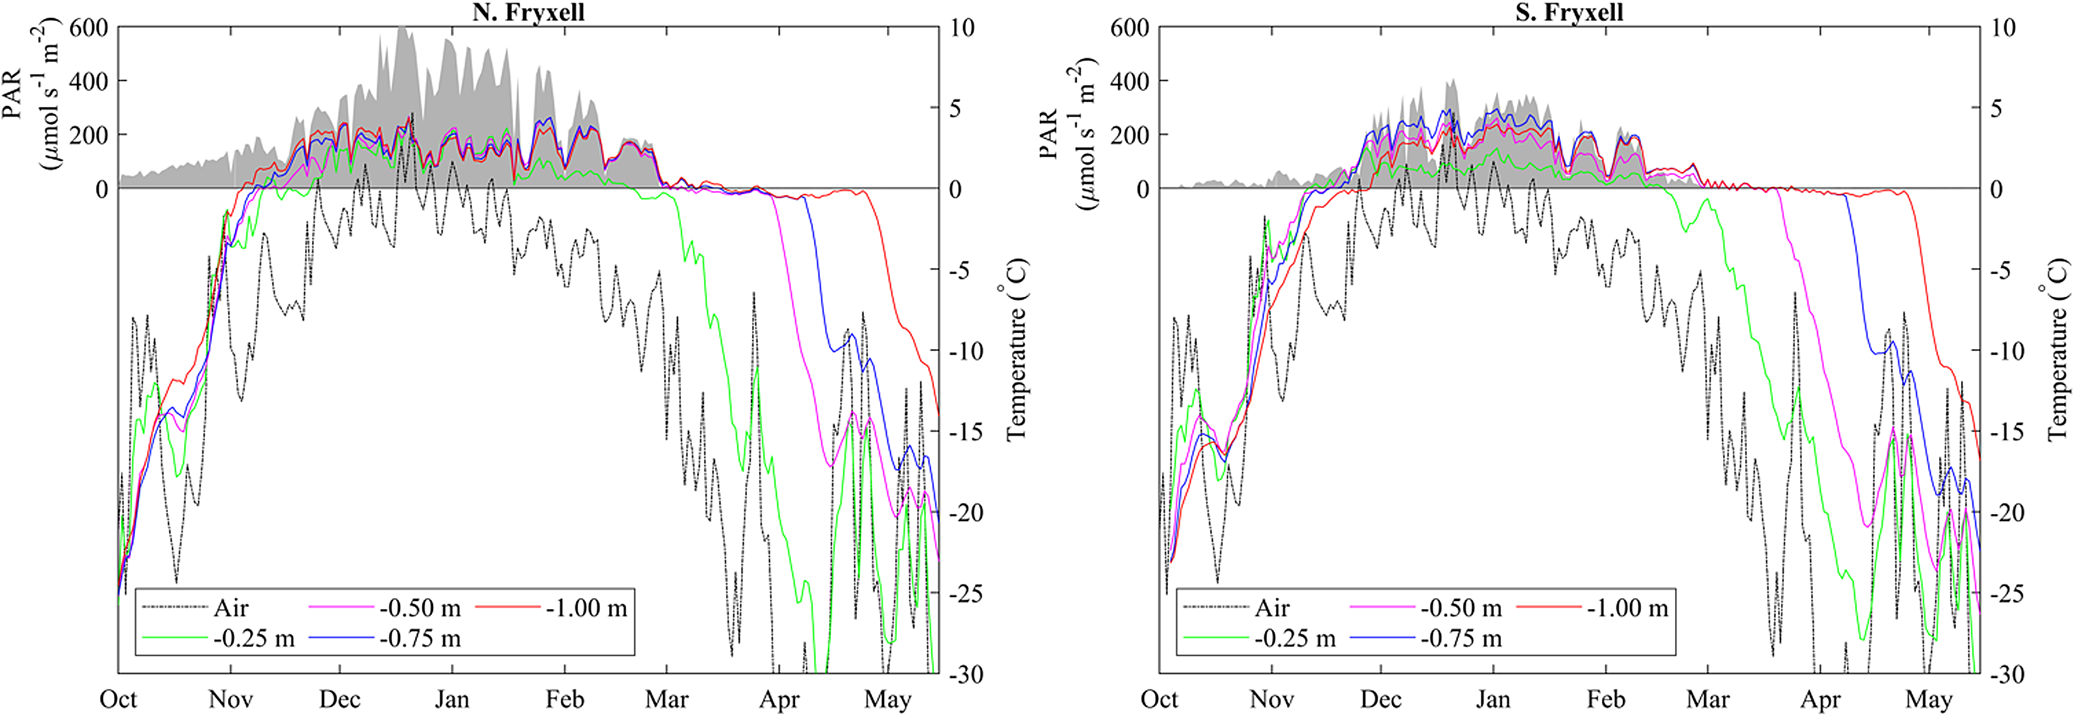
Figure 4. Changes in daily average surface air temperature (dashed lines), daily average lakebed temperature for various depths in the moat (solid lines) and daily average photosynthetically active radiation (PAR) at a depth of ~0.5 m in the moat (shaded region) at the north and south Lake Fryxell Soil-Lake Inundation Moat Experiment (SLIME) sites from October 2018 through May 2019. Note that lakebed temperatures in the moat generally exceed surface air temperatures throughout much of the year, with lakebed temperatures remaining near 0°C well beyond the end of the summer.
Although melt was driven by bottom-up processes, with the shallowest depths being the last to melt, refreezing of the moats was from the top down. The effect of latent heat was evident, with temperature decline pausing at the freezing point for a considerable period prior to a rapid fall, which we infer to indicate ice formation. At both sites, the freezing front passed through 25 cm in late March 2019 and 50 cm in April 2019 but did not reach 1 m until May 2019, by which time the air temperature had fallen below −30°C and PAR at 0.5 m had been undetectable for 2 months (Fig. 4).
Ice-thickness profiles
Bottom-up melting was also evident in the profiles of ice thickness across the moat. First observations were made on 12 December 2019 at the north Fryxell site; this is the site from which the most complete ice-thickness sequence was obtained and thus is described in detail here. At the first sampling, the lake was fully ice covered to the shore, but a layer of liquid water separating the underside of the ice from the lake floor was already evident from 0.5 m downwards (Fig. 5). The thickness of this layer of water increased with depth, until by 3 m depth it was 0.5 m thick.
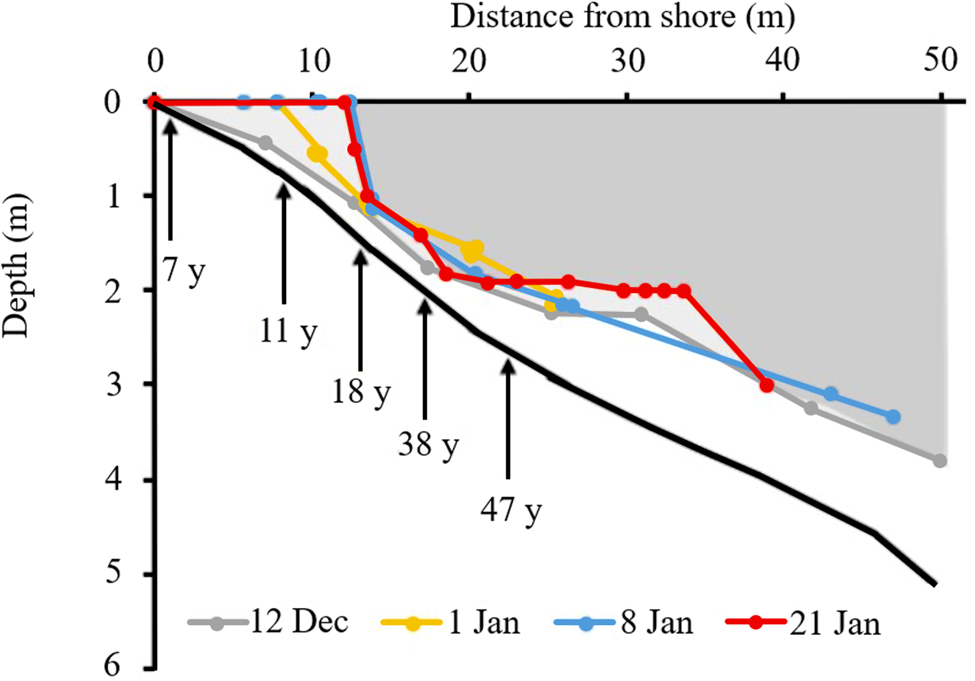
Figure 5. Development of liquid water in the Lake Fryxell moat during summer 2019–2020 from drilling (12 December–8 January) and diver (21 January) surveys. The solid black line is the fourth-order polynomial fit to all distance-depth data. Pale shading indicates ice at the first survey (12 December) and the darker shading represents the final survey (21 January). Annotated arrows indicate the approximate elapsed time since the most recent inundation at specific depths. Note the development of a ‘chamber’ during the 21 January survey.
Ongoing melting through December and January resulted in a rapid loss of ice close to the shore, creating open water along the landward margin, with a near-vertical ice wall to 1.5 m depth some 13 m off-shore. Over the open-water period, thinning of the remaining lake ice cover continued. A feature observed proximal to the main lake within the moat was the development of a ‘chamber’ between 20 and 35 m off-shore, with a near-flat ice ceiling at 2 m depth, below which the lake floor gradually deepened (Fig. 5; 21 January survey). At the shoreward end of this chamber, the gap between ice and lake floor narrowed to < 0.5 m. At the lakeward end, the chamber terminated in a distinct, near-vertical ice wall, beneath which was a wider (~1 m) passageway to the main lake.
Specific conductance and temperature bottom profiling
The temperature profile (Fig. 6) from deep to shallow along the bottom of the lake showed decreased temperature from ~10 to 5 m depth, then warming towards the shore. Conductivity decreased from ~6400 μS cm−1 at 10 m to 150 μS cm−1 in the top 4 m. There was a sharp chemocline between 4 and 5 m, which coincided with the lower surface of the ice cover. When referenced to the ice-thickness profile, all of the water space shown in Fig. 5 (i.e. 0–4 m depth) was filled with low-conductivity ‘moat’ water, with temperature gradually increasing from 1.0°C to 2.5°C between 4 and 1 m depth.
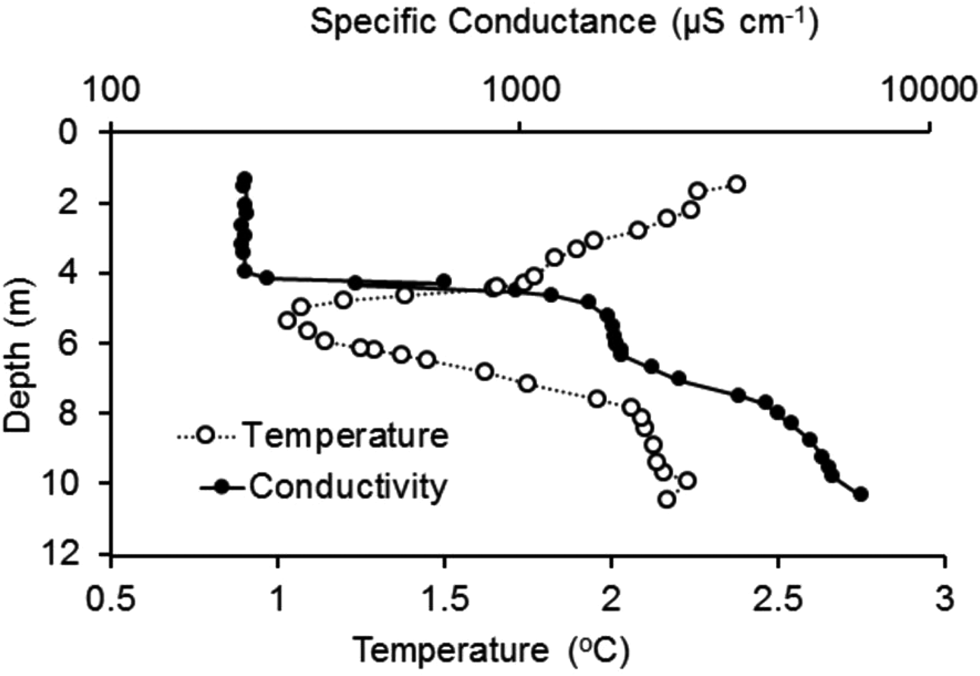
Figure 6. Transect of temperature and specific conductance at the sediment surface with depth in front of the north shore Soil-Lake Inundation Moat Experiment (SLIME) site. Measurements were made on 28 December 2019 by a diver placing a conductivity, temperature and pressure (depth; CTD) sensor on the lake bottom at fixed intervals for 30 s at a time. (Fig. 5 shows the relationship between depth and distance from the shore in the moat region.)
Geochemistry
All sections of the ~2 m core of moat ice collected in November had total dissolved solids (TDSs) < 1 mg l−1 on melting (Fig. 7). As the moat developed through the summer, however, the dissolved ion content increased, with distinct spatial and temporal variability being evident around the lake (Fig. 8). Moat TDS concentrations had increased to 30–50 mg l−1 by the time when open-water sampling began (Fig. 7), with eastern quadrants showing slightly elevated Na concentrations relative to western quadrants (Fig. 8). Na concentrations changed little in the southern quadrants, whereas in the northern quadrants, along with site SE3, Na concentration steadily increased over the course of the summer (Fig. 8 & Supplemental Fig. S2), with the Na:Ca ratio being higher in the north (Figs 7 & 8).
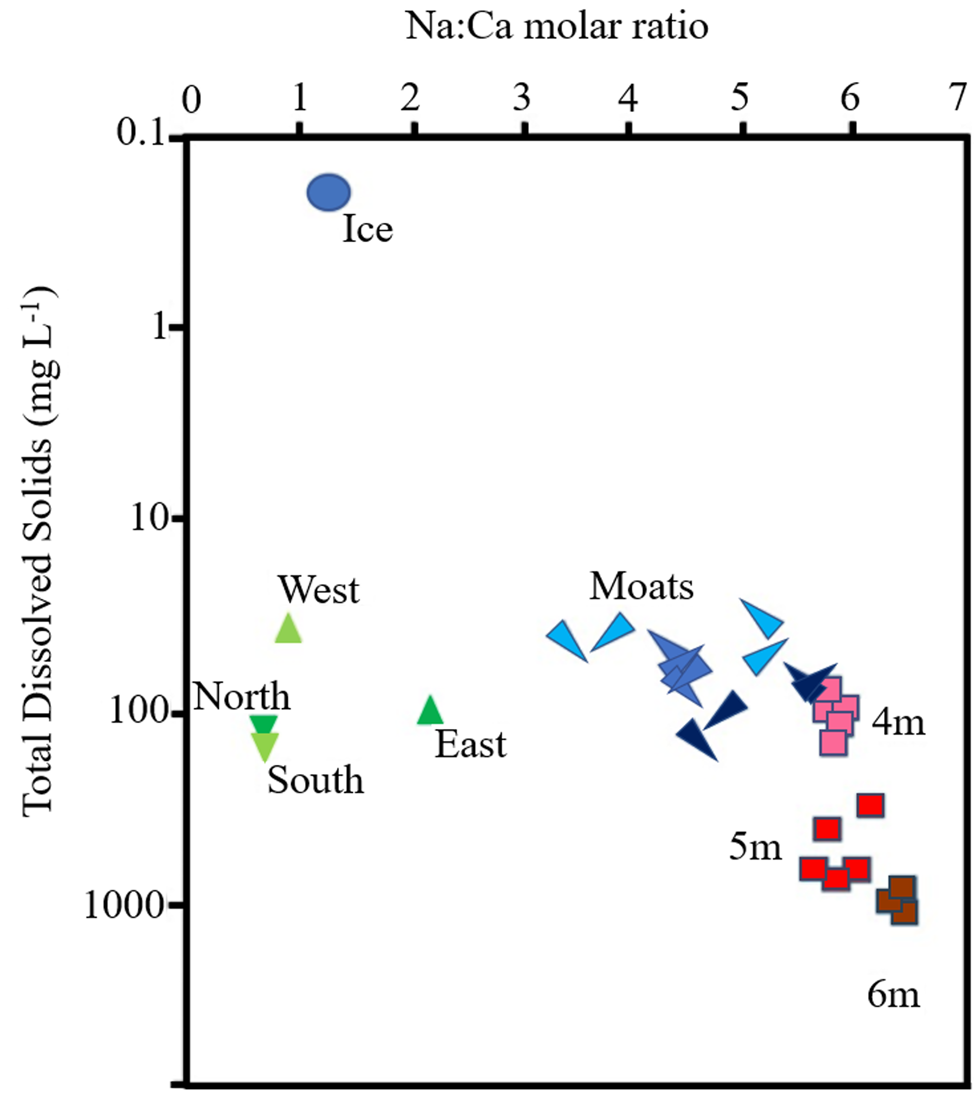
Figure 7. Ratios of sodium to calcium (molar) and total dissolved solids in the waters of the ice, stream, moat and lake system at Lake Fryxell. The blue circle indicates the average composition of the entire 2.26 m melted moat ice core, green triangles indicate streams draining the north, south, east and west catchments and red squares indicate lake water from below the ice at ~4, 5 and 6 m depths. The elongated blue triangles are mean values of the four groups of sites on the three moat synoptic surveys, with the direction of each point indicating which group of sites is represented (south-west, south-east, north-east and north-west). The blue colour is increasingly dark from surveys 1 through 3.
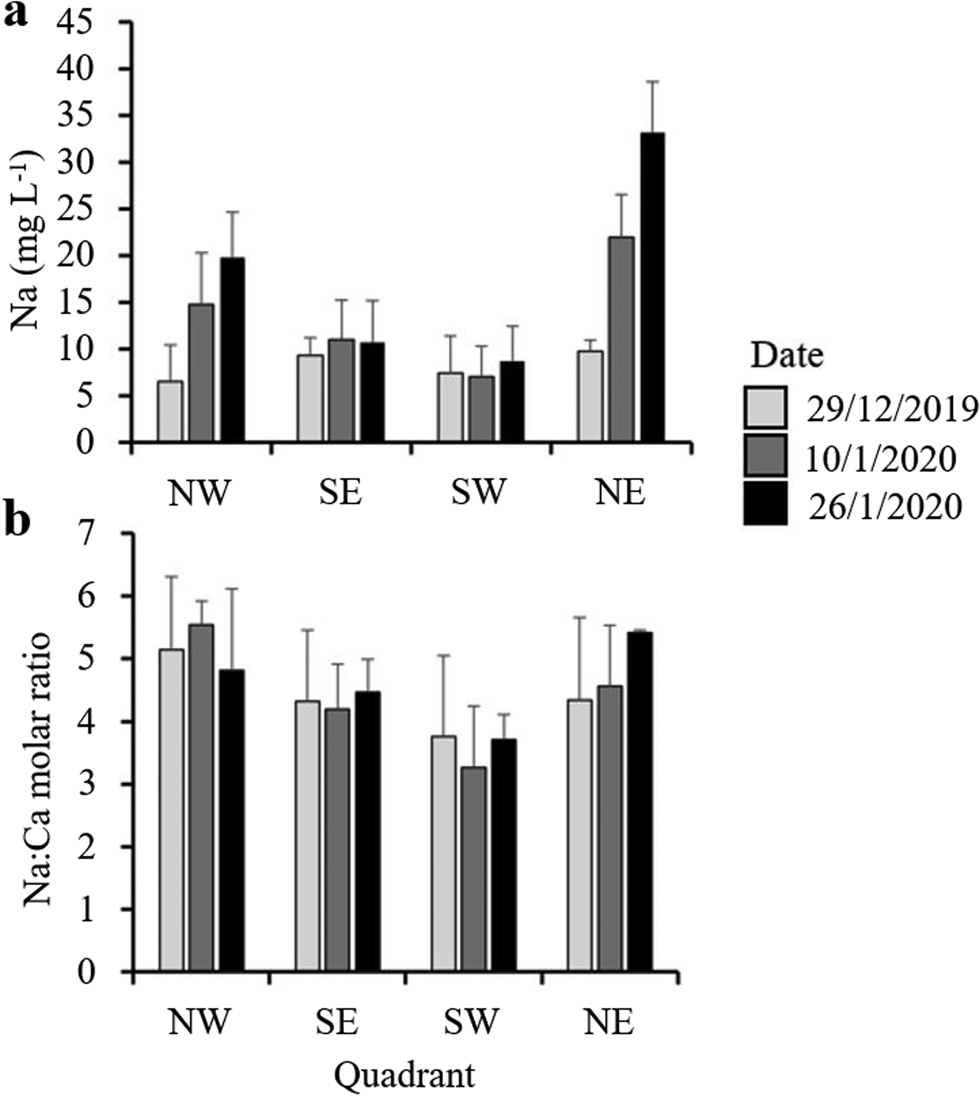
Figure 8. a. Mean sodium concentrations and b. molar ratios of sodium to calcium across lake quadrants collected on three occasions over the course of the 2019–2020 summer season. Water samples were collected from the ice edge at a depth of ~30 cm. Error bars represent standard errors. The locations of the sites are shown in Fig. 1.
Of the possible sources of ions to account for the changes in moat chemistry seen over time, we were able to sample tributary streams and water from immediately beneath the ice of the main lake basin. In general, stream samples had a similar range of TDSs to moats, particularly at sampling 3, when the TDSs of streams, moats and water immediately under the ice (4 m samples in Fig. 7) converged. Ratios of Na:Ca, however, separated stream water from lake and moat waters. Stream Na:Ca ratios ranged from ~0.6 to 2.0, with the highest ratios observed in streams draining the eastern (coastal) part of the catchment (Fig. 7). Lake water Na:Ca ratios were much higher (5–7), whereas moat sample values straddled stream and lake sample values, tending to move towards lake sample values over the three samplings, particularly at northern sites (Fig. 7). The tendency for moat Na:Ca ratios and TDS concentrations to evolve over time towards those of the water immediately below the lake ice could indicate the importance of lake sub-ice water rather than streams in terms of the greatest contribution to moat water chemistry.
Water column chlorophyll a
Average water column chlorophyll a for 14 samples taken from within the moat environment during the January open-water period was 1.1 ± 2.5 mg m−3. Over the same period, the averages of six samples collected from each of two depth intervals under the ice of the main lake (4.5–5.0 and 6.0–7.0 m) were 12.1 ± 2.0 and 27.5 ± 4.0 mg m−3, respectively.
Microbial mats
In the upper part of the moat (0–2 m), both carbon and nitrogen were primarily associated with the active layer of microbial mats. In all cases, ratios of C:N were close to 10:1. Areal concentrations of both elements increased with depth from the lake edge (0 m), peaking at 1.0–1.5 m before declining again (Fig. 9). At depths shallower than 1 m, carbon and nitrogen were almost exclusively associated with the active mat layer rather than an organic layer or in the underlying sediment. The < 1 m deep part of the moat had been inundated for < 11 years (Fig. 5). Organic material below the active layer began to appear at 1.25 m depth. In the samples taken below ice cover (4 m and deeper), the carbon and nitrogen contents were more evenly distributed between the active, organic and sediment layers down to at least 6 m depth. Variance within depths was high for most mat biomass estimates, and the shapes of the biomass profiles at the northern and southern sites were similar.
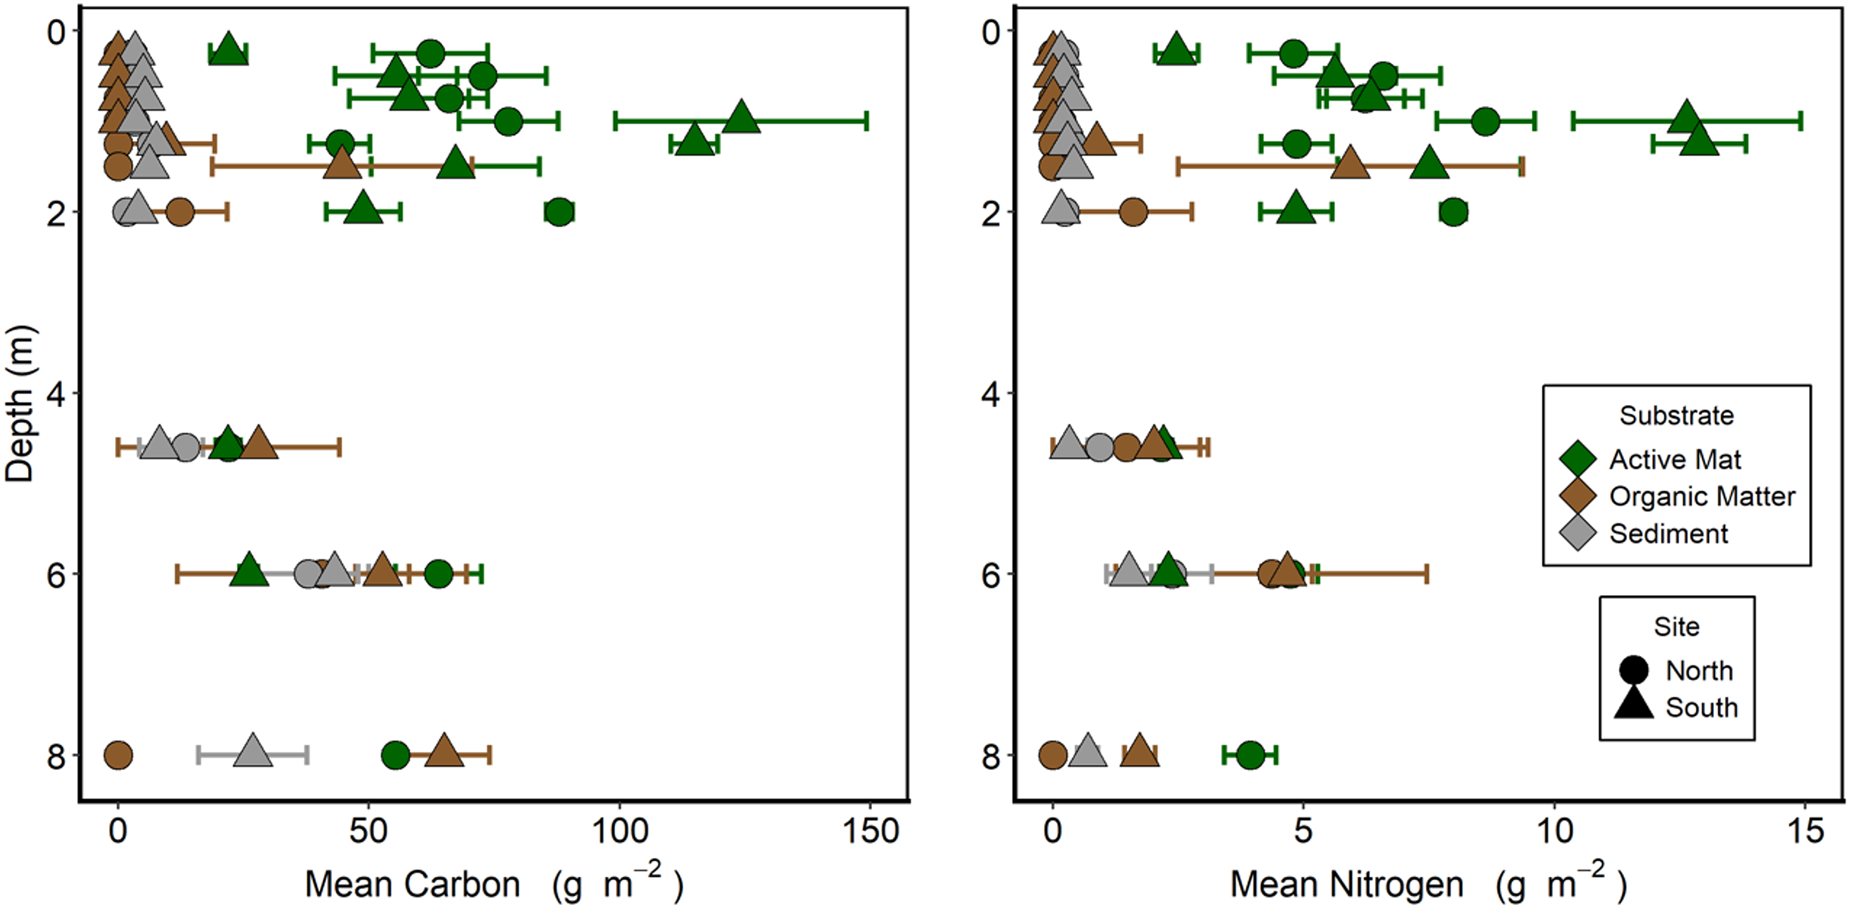
Figure 9. Benthic biomass as carbon and nitrogen along two depth transects in Lake Fryxell. Each sample is divided into the upper, cohesive, pigmented active mat layer, the underlying sediment to 10 mm depth and the organic layer between these. Each point is the mean ± standard error of five replicates.
Mats were composed of diverse bacterial and eukaryotic communities (Fig. 10 & Supplemental Figs S3–S5), although the potential for dead or inactive cells and free DNA to contribute to detected communities cannot be ignored. Bacterial 16S rRNA genes were dominated by the Proteobacteria (26–53%), Cyanobacteria (3–30%), Bacteroidetes (2–24%) and Acidobacteria (2–15%), in addition to minor contributions (9–24% total) from members of the Planctomycetes, Verrucomicrobia, Firmicutes, Gemmatimonadetes, Actinobacteria, Chloroflexi, Chlorobi, Nitrospirae and OP11. Proteobacteria proportions of the community were relatively uniform with depth but dominated by the Betaproteobacteria, then Gammaproteobacteria and Alphaproteobacteria. The proportion of Cyanobacteria 16S rRNA genes decreased with depth; this was the main difference between moat and lake samples at the phylum level. Bacteroidetes peaked at 1 m at the northern site and at 0.4 and 1.3 m at the southern site.

Figure 10. Relative abundance of eukaryotic phyla in the microbial mats along depth transects at the north and south sites at Lake Fryxell in January 2018. Unassigned sequences fall within the domain Eukaryota but could not be identified further.
Superficially, differences between moat and lake bacterial assemblages at the phylum level were relatively minor, but when individual ASVs were examined clear differences became evident. The most frequent Cyanobacteria ASVs detected in both moat and main lake samples were attributed to filamentous, mat matrix-forming species of Leptolyngbya (55% total cyanobacterial ASVs) and Phormidium (8%) and the heterocystous (potentially nitrogen-fixing) Nostoc (24% total cyanobacterial ASVs in moats but 6% in the main lake). A two-way PERMANOVA by site and by lake zone using pooled cyanobacterial ASVs from the two sites (Supplemental Fig. 4) showed no effect of site (north or south, P = 0.109), a highly significant zone effect (moat or lake P = 0.001) and no interaction (P = 0.383).
Eukaryote 18S rRNA gene sequences were dominated by the Ochrophyta (< 2–72%), Rotifera (1–39%), Tardigrada (3–18%), Ciliophora (1–10%) and Nematozoa (< 1–16%), although the greatest proportion of sequences in many samples was unassigned Eukaryota (10–46%; Fig. 10). Phylum-level differences between moat and lake assemblages were more apparent for eukaryotes than prokaryotes, with rotifers being much more frequent in the moats than under perennial ice, whereas ochrophytes were rarely seen in moats but became increasingly dominant with depth under ice. Further examination of the ASVs allocated to Ochrophyta showed that under permanent ice these were overwhelmingly diatoms (92 ± 8% under ice compared to 29 ± 27% in moats). Ochrophyta in moats were more likely to have been attributed to Chrysophyceae or Nannochloropsis. NMDS of ASVs and PERMANOVA were used to examine for clustering of community composition. Within the eukaryotic communities, both the north and south sites showed significant differences between the moat and main lake communities (Fig. 10 & Supplemental Fig. 5). PERMANOVA indicated that the differences between lake zones were highly unlikely to be by chance (P < 0.001).
Discussion
The characteristic feature that distinguishes the moat habitat from the sub-ice-cover pelagic environment of Lake Fryxell is seasonal freeze-thaw cycling. Our data show a strong asymmetry between spring melt, which occurs rapidly under conditions of low but increasing air temperature and increasing incoming solar radiation, and autumnal freeze, which occurs more slowly and in near darkness as air temperature drops precipitously. Melting is from the bottom up, whereas freezing is from the top down. The slow freeze means that at 1 m moat water remains unfrozen, in darkness and potentially connected to the main lake water column for several months after the moat surface has frozen. This asymmetry is probably due to different thermodynamic relationships driven by solar radiation. In spring, the transparency and low albedo of the moat ice (relative to that of permanent ice), evidenced by the penetration of PAR and as evident in Fig. 2b, facilitate melting and allow solar heating of the moat substrate where PAR is effectively absorbed by the dark microbial mats. At the same time, the air temperature is lower than that of the lake floor, and diffusive heat flux lowers moat temperature. Heating and thawing of the moat ice begins when the incoming radiation becomes a net source of heat. This conclusion is supported by the 24 h cycles of temperature at depth along the bottom of the moat. These 24 h cycles parallel PAR before and after the moat ice melts (Supplemental Fig. 1). During autumn, the effective absence of incoming radiation makes the diffusion of heat to the atmosphere through the growing ice cover the primary mechanism of heat loss.
The low concentrations of ions in the moat ice cores relative to the moat water before freezing suggest that, as the ice slowly thickens in autumn, there is an effective exclusion of salts from the ice matrix, resulting in salinization of the water under the ice (Santibáñez et al. Reference Santibáñez, Michaud, Vick-Majors, Andrilli, Chiuchiolo, Hand and Priscu2019). A similar freeze-concentration effect has been observed in ponds on the nearby McMurdo Ice Shelf during the process of winter freezing (Hawes et al. Reference Hawes, Safi, Sorrell, Webster-Brown and Arscott2011a). In the latter study, it was noted that both salts and dissolved gasses were freeze concentrated, and that while microbial respiration did deplete oxygen during the dark, liquid period, this concentration effect prevented anoxia from developing prior to freezing in much of the water column. The primary stresses associated with winter probably result from the physical freezing of the moat in early winter, which leads to changes in temperature and salt concentration, and the season-long exposure to sub-zero temperatures in the dark, frozen state.
Once the liquid water component of the moat reaches freezing, salinization of the water at the ice-water interface can be expected to create a salt-induced density instability, potentially resulting in vertical mixing (Hawes et al. Reference Hawes, Safi, Sorrell, Webster-Brown and Arscott2011a), downslope drainage and pooling of more saline water in bathymetric irregularities. This freeze concentration-driven drainage represents a potential mechanism for moving salts out of the moat shallows. Such mechanisms are supported by the low residual salt even at the base of the moat ice cores at the end of winter.
The net loss of ions from moat waters during freezing requires a return supply of ions in spring and summer. As indicated above, it is possible that some ions remain within the moat in bottom depressions and are returned as moat water begins mixing in spring. Replenishment of salts may also come from other sources, including streams, groundwater and/or wind-induced turbulent mixing of sub-ice and moat water. Temperature profiles within the moat during summer suggest that lake-edge warming towards 4°C could create an instability that would promote downslope flow. The descending, relatively warm waters must be replaced, probably by a return flow under the remaining moat ice, with potential entrainment of lake water. This lateral, downslope movement of warm lake-edge waters could be akin to the thermal siphons that have been previously described in more temperate lakes (e.g. Monismith et al. Reference Monismith, Imberger and Morison1990, Ulloa et al. Reference Ulloa, Ramón, Doda, Wüest and Bouffard2022). In Lake Fryxell, however, the thermal-density gradient is driven by near-shore waters warming, rather than cooling, towards their maximum density at 4°C. The circulation evoked by this thermal-density gradient could explain the evolution of the moat-ice underside into chambers and steep slopes. In addition, wind action on the lake ice and wind-driven surface flow in the open-water areas of the moats might promote mixing of sub-ice lake water into the moats. Tracers have been used to track stream flows into moats with conflicting results. While Castendyk et al. (Reference Castendyk, McKnight, Welch, Niebuhr and Jaros2015) found that stream waters entering Lake Hoare, a MDV lake close to Lake Fryxell, largely remain within the moats, McKnight & Andrews (Reference McKnight and Andrews1993) found that tracer-bearing stream waters entering the moat of Lake Fryxell can be subducted below the lake-ice cover. Density differences are key to the over- and under-flow of tributary water entering lakes. Like moat waters, MDV streams experience diurnal cycles in temperature that are largely controlled by solar radiation, with the daily temperature ranging between 0°C and 15°C in Fryxell basin streams (Cozzetto et al. Reference Cozzetto, McKnight, Nylen and Fountain2006), exceeding the range that we saw in moats during the open-water period. They also noted that specific conductivity varied on a diel cycle and with length of the stream, and that maximum temperature (and discharge) was minimal when conductivity was high. It seems probable that streams entering the moat would, in general, be warmer when both the moat and the stream were > 4°C and would be more dilute than moat waters during the warm, high-flow part of the cycle, inhibiting the development of density-driven underflows of stream discharge beneath moat waters and directly into the main lake. There are, however, phases in the cycle when the temperatures of the stream and moat could be similarly cool, and their ions more concentrated, creating density conditions in which an underflow could occur.
The Na:Ca ratios of the stream, moat and lake waters provide insights into the interactions between stream, moat and sub-ice lake waters. While the TDSs of moat and tributary streams were similar, the stream water samples have a Na:Ca molar ratio of ~1–2, whereas the lake surface water Na:Ca ratio below the ice is ~6. The Na:Ca ratios of the moat water span the range between these end-members, and the simplest explanation may be that, during our study period, mixing of moat and lake waters could have been the primary source of ions, as was shown for the east lobe of Lake Bonney by Moore (Reference Moore2007). Given that the TDS concentration in lake water is an order of magnitude greater than that in the moat water, only a small fraction (< 10%) of lake-water mixing with the moat water would be needed to increase the melted moat-ice TDS to the measured TDS of the moat water. The most pronounced increase in moat TDS was seen at the eastern end of the lake. This is generally the windward side of the lake during the summer, and this is where the lake receives the bulk of its stream inputs and is shallower, and it is also where open water tends to be the most extensive (Fig. 2; Speirs et al. Reference Speirs, McGowan, Steinhoff and Bromwich2012, Fountain et al. Reference Fountain, Levy, Gooseff and Van Horn2014). These conditions might favour density-driven mixing across the lake/moat boundary.
The presence of a conspicuous population of atmospheric nitrogen-fixing cyanobacteria suggests that atmospheric nitrogen fixation could represent a significant component of the nitrogen balance within the moat, and perhaps into the near-shore soils. Cyanobacterial atmospheric nitrogen fixation within microbial mats plays a major part in the nitrogen budget of ponds in Antarctica. However, cyanobacterial atmospheric nitrogen fixation requires relatively high levels of photosynthetically derived energy (Howard-Williams et al. Reference Howard-Williams, Priscu and Vincent1989, Fernandez-Valiente et al. Reference Fernandez-Valiente, Quesada, Howard-Williams and Hawes2001, Howard-Williams & Hawes Reference Howard-Williams and Hawes2007), and nitrogen-fixing cyanobacteria tend to be more abundant in moat than lake communities (Ramoneda et al. Reference Ramoneda, Hawes, Pascual-García, Mackey, Sumner and Jungblut2021). Advection of atmospherically fixed nitrogen from the moat to the main lake could represent a subsidy. It is noteworthy that primary producers in the main body of Lake Fryxell are considered to be nitrogen deficient (Vincent & Vincent Reference Vincent and Vincent1982, Priscu Reference Priscu1995) relative to other lakes in Taylor Valley. Even without moat-to-lake connectivity via advective and convective mixing, the inevitable delivery of a proportion of the biologically fixed nitrogen and carbon from the well-illuminated, productive moat to the main lake under the current regime of gradual lake-level rise points to the potential importance of the moat to whole-lake nutrient dynamics.
Winter freezing is clearly no obstacle to colonization given the prevalence of similar mats in winter-frozen habitats around shallow MDV aquatic habitats (Jungblut et al. Reference Jungblut, Vincent and Lovejoy2012a,b, Archer et al. Reference Archer, McDonald, Herbold, Lee and Cary2015, Hawes et al. Reference Hawes, Howard-Williams, Gilbert and Joy2021). Our sequence data show a clear distinction in composition between the moat and lake microbial mats (Fig. 10). Observations of a paucity of diatoms in mats subject to freezing but their increasing abundance under perennial ice is consistent with the limited previous observations (Wharton et al. Reference Wharton, Parker and Simmons1983, Hawes & Schwarz Reference Hawes and Schwarz2001, Ramoneda et al. Reference Ramoneda, Hawes, Pascual-García, Mackey, Sumner and Jungblut2021). Rotifers are more abundant in the moat than lake mats (Fig. 10). Rotifers are prolific in Antarctic shallow ponds that freeze annually (Velasco-Castrillón et al. Reference Velasco-Castrillón, Gibson and Stevens2014) and have extreme tolerance to adverse conditions, including freezing (Murray Reference Murray1910, Koehler Reference Koehler1967), as well as the ability to survive environmental extremes in a cryptobiotic state (Rahm Reference Rahm1921, Becquerel Reference Becquerel1950). Bégin et al. (Reference Bégin, Rautio, Tanabe, Uchida, Culley and Vincent2021) noted an abundance of rotifers in the moat region of Arctic Ward Hunt Lake, and they also recognized the existence of numerous discontinuities in physical, chemical and biological features between the moat and under-ice zones of that lake. Differences in prokaryotes were also evident, but both sub-habitats supported similar proportions of bacterial phyla, and differences were primarily within-phylum. A more comprehensive analysis of prokaryote and eukaryote distributions in Lake Fryxell and Lake Bonney is currently being prepared for publication. The abrupt shift in composition between the samples from the seasonally frozen to the perennially liquid zones suggests that habitat difference rather than a time series since inundation is responsible for species turnover, a conclusion that was also drawn by Ramoneda et al. (Reference Ramoneda, Hawes, Pascual-García, Mackey, Sumner and Jungblut2021).
Over the long term, the lakes in the MDVs are undergoing a period of lake-level rise, as inflows from melting ice exceed ablation and evaporation from the ice and moat-water surfaces. Consequently, the upper and lower boundaries of moats are rising, probably resulting in material from the moat being subsumed into the main lake compartment as the lake ice effectively moves upwards. In addition to this inundation-based process, the salt content of the moat compartment may require mixing of moat and lake water through an as-yet uncertain mechanism. At the upper moat boundary, rising lake levels inundate marginal ground, probably incorporating ions, organic and inorganic nutrients and organisms from soils to the moat and thence to the lake itself (Barrett et al. Reference Barrett, Gooseff and Takacs-Vesbach2009). The moat and its biological assemblages play a distinct role in controlling these connections. At present, our data, and other previous studies (Hawes et al. Reference Hawes, Giles and Doran2014, Ramoneda et al. Reference Ramoneda, Hawes, Pascual-García, Mackey, Sumner and Jungblut2021), suggest that lake level appears to be rising at a rate whereby moat and shallow lake communities can accommodate this change and maintain the integrity of the moat-lake connection.
Conclusions
The marginal moat represents a poorly understood compartment of Lake Fryxell, one of Antarctica's MDV lakes. Moats are distinct from the freshwater habitats existing under the perennial ice covers of MDV lakes. They melt out rapidly with increasing solar radiation in spring, from the bottom up, and provide a viable sub-ice habitat long before the air temperature reaches freezing point. As air temperatures and solar radiation decline during the transition to autumn and winter, the refreezing of the moats is from the top down. This is a slow process, allowing a liquid habitat to persist for several months after refreezing commences. Moat water is dilute, overlying more saline lake water, but it carries an ion signature that may indicate some exchange of water between the moat and the main lake. During summer, moats support the accrual of organic carbon and nitrogen by microbial mats. The assemblages of prokaryotes and eukaryotes in the moats are distinct from those in the main body of the lake, and the abundance of microbial mats, incorporating nitrogen-fixing cyanobacteria and supporting a variety of eukaryotes, implies that they could contribute to lake productivity and biodiversity. Rising lake level inundates lake-shore soils, creating new habitats in which microbial mats can grow and moving what was moat habitat under the perennial lake ice.
Moats are a biogeophysically distinct habitats within lakes, supporting microbial communities that influence the carbon and nitrogen budgets both within the moats and within the main lake body.
Acknowledgements
We thank Antarctic Support Contractors, Antarctica New Zealand, Petroleum Helicopters and Air Center Helicopters for scientific, logistical and helicopter support. We also thank the Long Term Ecological Research (LTER) personnel and associates involved in generating the data used in this project. Lastly, we thank the reviewers who provided their feedback.
Financial support
This work was supported by the National Science Foundation, Grant #OPP-1637708, for Long Term Ecological Research (LTER) to SPD, MNG, CT-V, RM-K, BJA, JEB, JCP and PTD. Support for IH came from grant ANT1801 from New Zealand's Ministry of Business, Innovation and Employment to the Antarctic Science Platform.
Competing interests
The authors declare none.
Author contributions
SPD, IH, KAW, MNG, CT-V, RM-K, BJA, JEB and PTD conceived the project. MSS, SPD, IH, KAW, MNG, CT-V, RM-K, BJA, JEB, JCP and PTD conducted fieldwork in support of the project. MSS performed the analysis used to create Figs 1–4. MSS, SPD, IH and PTD performed the analysis used to create Fig. 5. SPD, IH and PTD performed the analysis used to create Fig. 6. KAW conducted the major ion analysis used to create Fig. 7. SPD and IH created Fig. 8. SPD and JEB carried out the benthic biomass analysis used to create Fig. 9. CT-V performed the community structure analysis used to create Fig. 10. All authors participated in writing the manuscript.
Supplemental material
To view supplementary material for this article, please visit https://doi.org/10.1017/S0954102024000087.
A supplemental section including five figures is included in the online version of this publication.


 Open access