


Police officers play a crucial role in safety, serving to maintain law and order and protecting members of the public through crime prevention and investigation(1). Due to the high occupational stress, approximately 2 % of the UK police force are currently on long-term sickness leave, the highest it has been in 10 years(2). Furthermore, a substantial amount of research has demonstrated high rates of overweight, obesity and cardiometabolic health conditions in police officers across the world(2–Reference Gibson, Eriksen and Singh5). Alghamdi et al.(Reference Alghamdi, Yahya and Alshammari3) found that among 160 Saudi Arabian police officers, 42·5 % were overweight and 24·4 % were obese. A study on Malaysian police showed a similar prevalence rate with 44·4 % overweight and 22·0 % obese(Reference Nasruddin, Sedek and Zubairi6). In the USA, as part of the Buffalo Cardio-Metabolic Occupational Police Stress study, Gu et al.(Reference Gu, Charles and Burchfiel4) explored the relationship between adiposity measurements and working hours in 408 officers. There was a clear sex difference in obesity prevalence with nearly half of the male participants being obese (48·3 %) compared with only 16·7 % of the females. Although there was no association between BMI and the number of hours worked in the population as a whole, in male midnight shift workers, longer working hours were significantly associated with both a higher BMI and waist circumference. A large study of UK police officers(Reference Gibson, Eriksen and Singh5), similarly, found there to be a significant difference in health parameters depending on sex, with 78·4 % of male police officers being overweight or obese compared with 49·5 % of female officers. Furthermore, 41·4 % of the male participants had at least three cardiometabolic risk factors – this being higher than the estimated general European population prevalence of 20–30 %(Reference Grundy7). With all this considered, it is not surprising that alone, having an occupation as a police officer, serves as a long-term predictor for adverse cardiovascular events(Reference Wright, Barbosa-Leiker and Hoekstra8).
An understanding of the nature of a police officer’s job is vital when considering the causes of such negative health outcomes. To ensure policing services are available around the clock, shift work is a common practice. This, however, is widely associated with a higher risk of obesity(Reference Sun, Feng and Wangs9), diabetes(Reference Gan, Yang and Tong10), hypertension(Reference Manohar, Thongprayoon and Cheungpasitporn11) and CVD(Reference Torquati, Mielke and Brown12). While several physiological, behavioural and environmental factors contribute to these outcomes, the unifying component is the effect that shift work has on the body’s circadian system. This system is based on approximately 24-h rhythms, regulated by a central clock that synchronises the body with the time of day, cued by light exposure(Reference Banks, Dorrian, Yates and Watson13). Aligning regular behaviour cycles such as feeding fasting, sleep wakefulness and rest activity, with the rhythm set by this clock, optimises metabolism(Reference Potter, Cade and Grant14). Disruption to this, as a result of shift work, can impair glucose, lipid and energy metabolism, as well as affect appetite hormones(Reference Antunes, Levandovski and Dantas15). Food consumption, therefore, plays a critical role not only in energy balance but also in the synchronisation of the circadian system. While the impact that shift work has on health outcomes and food choices may be extensively researched, the majority target healthcare professionals(Reference Beebe, Chang and Kress16–Reference Peplonska, Nowak and Trafalska18). A police officer’s job is unique in not only its physical demand, involving periods of high-intensity activity while wearing 7–40 kg of protective gear(Reference Dempsey, Handcock and Rehrer19) but also in its spontaneous nature and lack of designated breaks. These considerations provide additional challenges which need to be recognised.
There has been an underwhelming amount of research exploring the dietary habits of UK police officers. An exception to this, however, was a large cross-sectional study performed on British police personnel, to explore the relationship between diet quality and cardiometabolic risk, as well as determine employee characteristics associated with these factors(Reference Gibson, Eriksen and Singh5). Dietary data from 5527 individuals enrolled in the Airwave Health Monitoring Study were analysed. Diet quality was determined using the Dietary Approaches to Stop Hypertension score. Poor diet quality was associated with increased odds of having at least three markers of cardiometabolic risk. Furthermore, in men, longer working hours (≥49 h/week v. <40 h) and high job strain (v. low) were also associated with poor diet quality (OR 1·53 95 % CI 1·21, 1·92; OR 1·38 95 % CI 1·06, 1·58, respectively), both of which are commonly reported by police officers(Reference Wu, Liu and Li20). When considering the impact of shift patterns on dietary intake of Canadian police offices, it was found that more energy content were consumed relative to individual metabolic requirements on rest days (mean = 183·5 %, (sd 52·8) %) than evening (mean = 129·6 %, (sd 46·4) %) and night (mean = 142·7 %, (sd 41·6) %) shifts(Reference Kosmadopoulos, Kervezee and Boudreau21). Furthermore, food intake occurred significantly later in the day on night shifts (2308 h (sd 3·1) h) compared with rest days (1525 h (sd 0029) h) as well as being dispersed across a longer eating window (13·9 h (sd 3·1) h v. 11·3 h (sd 1·8) h). Only one study on police officers has aimed to identify and understand both the barriers and the influences that this population has towards healthy eating(Reference MacKenzie-Shalders, Matthews and Dulla22). In a sample of 159 US police officers, the authors reported 91 % of participants placed high importance on consuming nutritious foods and 80 % emphasised the importance of eating food high in vitamins and minerals. There were several barriers identified as reasons why such behaviours could not be practised. The most prevalent barriers included having a busy lifestyle (60 % of participants), irregular working hours (40·5 %), lengthy preparation (35 %) and the price of healthy food (32 %). Further research is needed to understand the extent of these barriers and determine if various shift patterns influence the barriers to a healthy diet. The aim of this research, therefore, is to understand the barriers and the impact that different shift types have on the dietary habits of police officers in the UK, using an online cross-sectional survey.
Methods
Study design and ethics
A concurrent mixed-methods design was conducted that included qualitative and quantitative methods through a questionnaire administered via the online platform Jisc online surveys (https://www.jisc.ac.uk/online-surveys) between January 2021 and June 2021. All questions were mandatory, so participants completed all of the questions, including free text questions. Quantitative data were predominantly collected via modified versions of the following validated questionnaires: Perceived Personal, Social and Environmental Barriers to Weight Maintenance(Reference Andajani-Sutjahjo, Ball and Warren23), Rapid Eating Assessment for Participants, short version(Reference Gans, Ross and Barner24) and the Food Choice Questionnaire (FCQ)(Reference Steptoe, Pollard and Wardle25). Dietary practices can be diverse and individualistic; therefore, three open-ended questions were answered in a free text box as a secondary method to allow for a deeper understanding of the respondents’ perspectives(Reference Reja, Manfreda and Hlebec26). This study was conducted according to the guidelines laid down in the Declaration of Helsinki, and all procedures involving human subjects were approved by the University of Westminster School of Life Science Ethics board. Written informed consent was obtained from all participants.
Participants and recruitment process
This study was open to all police forces in the UK. The inclusion criteria were (a) currently working as a police officer in the UK, (b) must work shifts and (c) must provide voluntary consent. Shift work was defined as, ‘a work schedule involving irregular or unusual hours, compared to those of a normal daytime work schedule’(Reference Wang, Armstrong and Cairns27). As this study is concerned with the influence of shift work on dietary patterns, therefore those working only one type of day shift were excluded as circadian misalignment may not be an issue. Snowball sampling was the method of recruitment chosen. The survey was predominantly distributed via social media platforms, including Twitter, Facebook, LinkedIn and Instagram. Similar studies that have previously been published surveyed between 75 and 308(Reference MacKenzie-Shalders, Matthews and Dulla22,Reference Violanti, Burchfiel and Hartley28) , and this was deemed an appropriate sample size range. Furthermore, data saturation of the free text questions was met when no new themes were established in the content analysis.
Dietary habits and diet quality questionnaire development
The survey was predominantly based on three validated questionnaires, of which questions were mandatory. The first one being the perceived personal, social and environmental barriers to weight maintenance questionnaire(Reference Andajani-Sutjahjo, Ball and Warren23). Based on a review of the literature, twenty-two possible personal, social and environmental barriers to weight maintenance in populations at risk of weight gain were established. The barriers were then divided into barriers to healthy eating and barriers to physical activity. Considering this study’s objectives and the time poor nature of police officers, only questions regarding the barriers to healthy eating were asked. To determine police officer’s single most prevalent barrier to healthy eating, which may not have featured in the questionnaire, participants were asked the open question of: ‘In your opinion, what is your main barrier to eating healthily?’
In order to assess whether shift type has an impact on a police officer’s quality of diet, the full validated version of the Rapid Eating Assessment for Participants, short version questionnaire was asked four times to assess typical daily diet quality when undertaking an ‘early/day shift,’ ‘late/evening shift,’ ‘night shift’ and ‘day off’. This survey consists of thirteen questions regarding how often certain foods are consumed or dietary practices are followed(Reference Gans, Ross and Barner24). Based on their answers being, ‘usually/often,’ ‘sometimes,’ ‘rarely/never’ or ‘does not apply to me’ a scoring system from 1 to 3 was applied, with the latter two responses both giving a score of 3. A higher total score represented a higher quality of diet, as validated against nutrient intakes from medical students using the 1998 Block FFQ(Reference Segal-Isaacson, Wylie-Rosett and Gans29) To explore the impact that shift type has on a police officer’s dietary habits, rather than just diet quality, the following closed questions were asked: ‘on what shift type do you find it the most challenging to eat healthily?’ and ‘which of these statements best describes how you manage your eating habits around your varying working hours? a) I try to eat the same each day depending on when I wake up as opposed to the time of day b) I will try to eat the same each day based on the time of day c) I don’t think about it d) Other (please specify)’. Participants were also asked if they thought that working shifts had affected their diet, and if so how?
The FCQ was used to assess the factors that influence the food choice of police officers. With police officers being susceptible to survey fatigue(Reference Nix, Pickett and Baek30) and subsequent high drop-out rates, the usual Likert scale and subsequent 1–4 scoring system used in the FCQ were replaced by a binary tick box format, making the thirty-six-item list less daunting. While the survey’s validity may be reduced, other shortened modifications to the FCQ have been shown to be a useful substitute when time is an issue(Reference Onwezen, Reinders and Verain31).
Furthermore, anthropometric data were collected as part of the questionnaire, specifically the participant’s weight and height. Although not mandatory, these self-reported measures have been found to be accurate within a similar law enforcement population(Reference Dawes, Robert and Filip32). BMI was subsequently calculated using the following formula: weight (kg/(height (m2)) and individuals were categorised according to the WHO(33) cut-off points. Information on occupation was also collected, including shift type, start and end time, frequency and the number of years serving in the police. Estimated weekly working hours (including overtime) were calculated using the following formula: 7 × (total monthly hours/30·4), where 7 represents the number of days in a week and 30·4 is the average number of days in a month. These were then categorised into ≤ 40, 41–48, ≥ 49 h based on previous research on shift workers(Reference Gibson, Eriksen and Singh5,Reference Kivimaki, Jokela and Nyberg34) . Shifts were classified based on the following start times: 04:00–11:59 for an early/day shift, 12:00–19:59 for a late/afternoon shift and 20:00–03·59 for a night shift. These classifications have been used in previous studies on law enforcement personnel(Reference Violanti, Burchfiel and Hartley28,Reference Ma, Andrew and Fekedulegn35,Reference Wirth, Andrew and Burchfiel36) . Two commonly reported day and night shifts patterns were 06.00–18.00 hours; 07.00–19.00 hours and 18.00–06.00 hours; 19.00–07.00 hours. These were classified as day and night shifts despite not fitting into the correct categories when based on start times. The number of years serving in the police was also categorised according to the following: ≤ 5, 6–13, 14–20 and > 20 years. The full questionnaire can be found in the online Supplementary Material. A small pilot of the questionnaire was conducted with two police officers to ensure clarity and understanding of all questions, which help reduce biases that may exist from the misinterpretation of questions(Reference Choi and Pak37). Minor changes were made following the feedback from the two participants.
Statistical analysis
All quantitative data were transferred to Statistical Package for the Social Science (IBM®SPSS® Statistics Version 26 for MacOS) (IBM Corp., 2019), where it was cleaned, categorised and analysed. Continuous variables (age, weight, height, years in the police, total working hours, diet quality) were tested for normality, using the Shapiro–Wilk test and those that were normally distributed were reported as mean values and standard deviations, while skewed data were reported as median (interquartile range (IQR)). Categorical variables were summarised as frequency (n) and total percentage (%) in terms of all the valid data available for that variable. A principal component analysis using SPSS FACTOR was performed on the ten barriers to healthy eating, so that any underlying relationships between the individual items could be identified in order to reduce its dimensionality and hence facilitate simpler subsequent analyses. Cronbach’s α coefficients were calculated for each factor to determine inter-item reliability. Mean standardised factor scores were computed for each item. These were used to investigate the differences in perceived barriers to healthy eating depending on the type of shift worker, the average number of hours worked per week, length of service and BMI. A large positive score represented more important barriers and a large negative score as less important barriers.
A Kruskal Wallis H test was run to determine if there were differences in diet quality depending on shift type. Should a statistically significant difference have been shown, then Dunn’s(Reference Dunn38) post-hoc analysis was performed, with a Bonferroni correlation for multiple comparisons applied. Associations between categorical variables and how participants manage their diet around their shifts were explored using the χ 2 test or the likelihood ratio when results had ≥ 20 % of cells with an expected count less than 5. Should a statistically significant result have been shown, Cramer’s V post-hoc test was performed to determine the strength of association, taking < 0·10 as negligible, 0·10–0·19 as weak, 0·20–0·39 as moderate, 0·40–0·59 as relatively strong, 0·60–0·79 as strong and 0·80–1·00 as very strong(Reference Rea and Parker39).
The thirty-six items in the FCQ were categorised into the following categories, based on a factor analysis that was undertaken by Steptoe, Pollard and Wardle(Reference Steptoe, Pollard and Wardle25): health, mood, convenience, sensory appeal, natural content, price, weight control, familiarity and ethical concern. These categories were then ranked from the highest importance (in terms of percentage of participants) to the lowest importance.
Inductive content analyses of the open-ended questions were undertaken using NVivo (QSR International Pty Ltd, 2020) so that recurring themes could be identified. These were discussed with another researcher to reduce bias and ensure the rigor of findings(Reference Cypress40). Several quotes were selected for each respective theme, to aid interpretation.
Results
Population characteristics
One hundred and thirty individuals completed the survey. However, three were excluded due to not working shifts, leaving a sample of 127 British Police Officers, with the participant demographics outlined in Table 1.
Table 1. Demographic related characteristics of the 127 participants (n = available data of the 127 participants for that variable)
(Median and interquartile ranges; mean values and standard deviations; numbers and percentages)
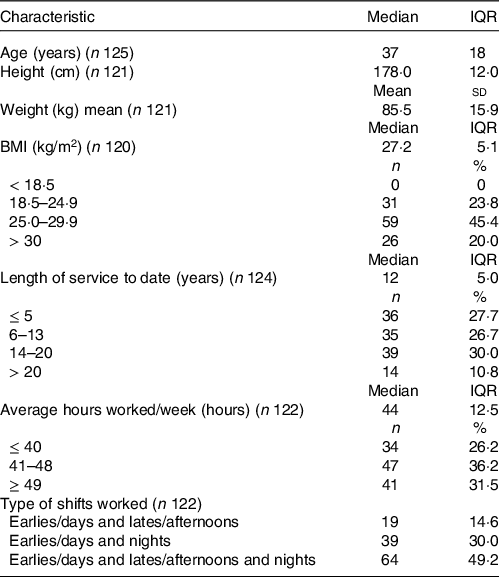
Earlies/days classified as a start time of 04.00–11.59 hours; lates/afternoons classified as a start time of 12.00–19.59 hours; nights classified as a start time of 20.00–03.59 hours.
Barriers to healthy eating
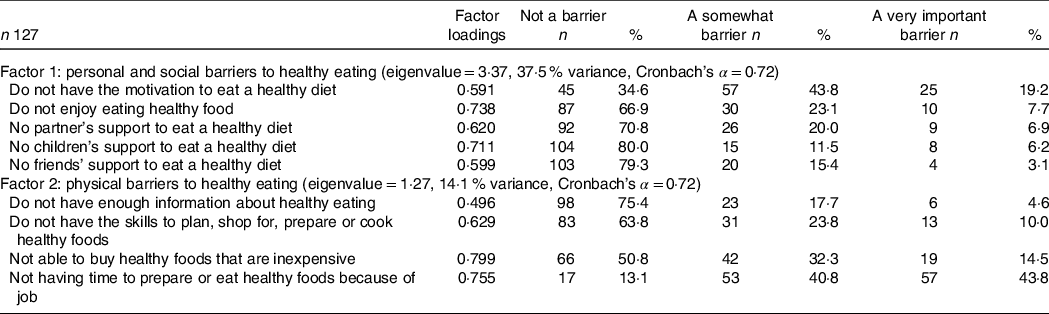
Table 2 presents the proportion of participants reporting each of the perceived barriers to healthy eating. Combining the response categories of ‘very important’ and ‘somewhat important’, 87 % of participants reported lacking time, 65 % reported lacking motivation and 48 % reported cost as the main barriers to healthy eating. No support from children (18 %), friends (19 %) and having a lack of information about healthy eating (23 %) were less reported barriers. Most (82 %) participants reported being willing to change their diet to make it healthier.
Table 2. Participants’ perceived barriers to healthy eating categorised into two factors, with their corresponding eigenvalue, variance and Cronbach’s α from principal component analysis
(Numbers and percentages)
Principal component analysis
As part of the principal component analysis, an inspection of the correlation matrix showed that all but one variable had at least one correlation coefficient >0·3. This variable – ‘not having time to prepare or eat healthy foods because of family commitment’ – was excluded. The overall Kaiser-Meyer-Olkin (KMO) measure was 0·738, classifying as ‘middling’ according to Kaiser’s(Reference Kaiser41) classification of measures. The majority of individual KMO measures were between 0·6 and 0·7, which were ‘mediocre’. One KMO value was however 0·571 which although being termed ‘miserable’ is still above the 0·5 acceptable measure. Bartlett’s test of sphericity was statistically significant (P < 0·001), indicating that the data were likely factorisable. Principal component analysis revealed three components that had eigenvalues >1 which explained 37·5, 14·1 and 11·7 % of total variance, respectively. Visual inspection of the scree plot indicated that two components should be retained(Reference Cattell42). Together, these explained 51·5 % of total variance. Names assigned to these components were ‘personal and social barriers’ and ‘physical barriers’ (Table 2). The Cronbach’s α coefficient for the two components was 0·72 and 0·69, representing acceptable internal consistency(Reference van Griethuijsen, van Eijck and Haste43). Two items – ‘do not have enough information about healthy eating’ and ‘do not have the skills to plan, shop for, prepare or cook healthy foods’ – cross-loaded on both components and therefore were only included on the one which showed the largest loading.
Associations of type of shifts worked, length of service, weekly hours worked and BMI with perceived barriers to healthy eating
Mean factor scores for personal and social barriers and physical barriers did not vary significantly according to the types of shifts worked (P = 0·429 and 0·893), length of service (P = 0·918 and 0·341), weekly hours worked (P = 0·823 and 0·861) or BMI (P = 0·098 and 0·852).
Police officers’ main barrier to healthy eating
Three key themes relating to barriers to healthy eating emerged from the thematic analysis of responses to the question, ‘what do you perceive as your main barrier to healthy eating?’ (Table 3). These themes were all associated with shift work and included time and accessibility on shift; time outside of work; and personal and social barriers.
Table 3. Themes that emerged from the thematic analysis of barriers that police officers have to healthy eating, with illustrative quotes
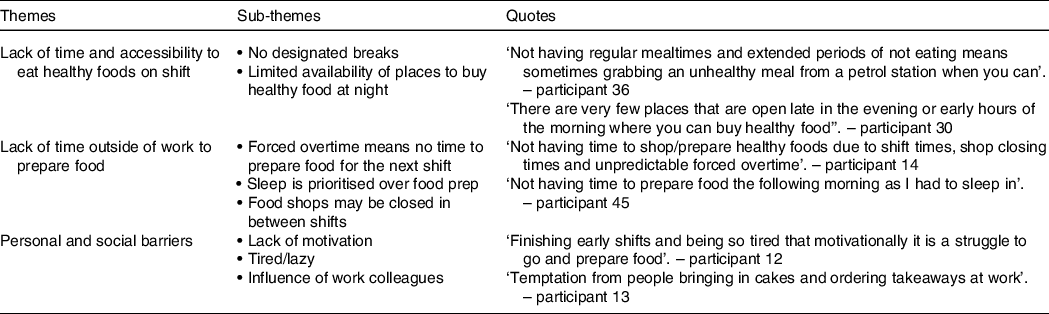
Theme 1: – lack of time and accessibility to eat healthy foods on shift
Participants emphasised that even if they had intended to eat healthily and had brought food with them, they often would not get a chance to eat it due to being ‘at a job’. As a result, it was commonly reported that either long periods would be sustained without food being consumed or more snacks would be eaten, often unhealthy ones due to the lack of availability of healthy on-the-go foods.
Theme 2: lack of time outside of work to prepare food
Being unable to prepare food for the following shift was a common barrier reported. Reasons often related to unpredictable finishing times due to forced overtime and the short duration between shifts meaning that sleep is prioritised. Some also spoke of supermarkets not being open when they are off, so takeaways are more convenient.
Theme 3: personal and social barriers
Participants emphasised that shift work makes them tired and therefore they ‘cannot be bothered’ to prepare food, or they opt for unhealthy food as a means to cheer themselves up. Some individuals wrote that motivation was an issue, either independently or as a result of being tired. Social influence of work colleagues was also reported to result in unhealthy food choices while on shift.
The effect shift work has on dietary behaviours and diet quality
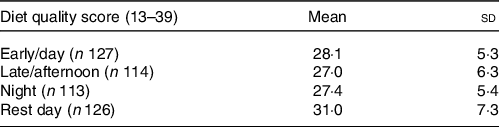
The majority of participants said that shift work has affected their diet (n 119, 94 %). Nearly half of the participants found night shifts most challenging (n 57, 49 %), compared with early (n 15, 13 %) and late (n 45, 35 %) shifts. Median diet quality scores were statistically significantly different between shifts, χ 2(3) = 35·780, P < 0·001. Pairwise comparisons were performed using Dunn’s(Reference Dunn38) procedure with a Bonferroni correction for multiple comparisons. Adjusted P-values are presented. This post hoc analysis revealed statistically significant differences in diet quality between rest days (median = 31, IQR = 7) and early shifts (median = 28, IQR = 5) (P < 0·001), rest days and late shifts (median = 27, IQR = 6) (P < 0·001) and rest days and night shifts (median = 27, IQR = 5) (P < 0·001). No other statistically significant differences were seen in diet quality between early and late shifts (P = 0·965), early and night shifts (P = 1·000) nor late and night shifts (P = 1·000) (Table 4).
Table 4. Average Rapid Eating Assessment for Participants, short version score by shift type
(Mean values and standard deviations)
Associations of the types of shifts worked, length of service, average weekly hours worked and BMI on how eating is managed around shifts
A χ 2 test of independence showed that there was a statistically significant association between how eating is managed around shifts and BMI, χ 2(4) = 10·54, P = 0·032. The association was moderate(Reference Rea and Parker39), Cramer’s V = 0·220. Compared to those with a healthy or overweight BMI, a larger portion of those that are obese do not think about how to manage their diet around shifts (17·2 and 23·2 %, respectively, v. 37·5 %). No other statistically significant associations were found between how eating is managed around shifts and type of shifts worked (P = 0·941), length of service (P = 0·849) or average weekly hours worked (P = 0·06).
Police officer’s perspective on the effect shift work has had on their diet
Four main themes were identified in response to the question ‘how has shift work affected your diet?’ (Table 5). These included meal timings, reliance on convenience food, reduced quality of food and altered frequency of food consumption.
Table 5. Themes that emerged from the thematic analysis of the effect that shift work has had on the diet of police officers, with illustrative quotes
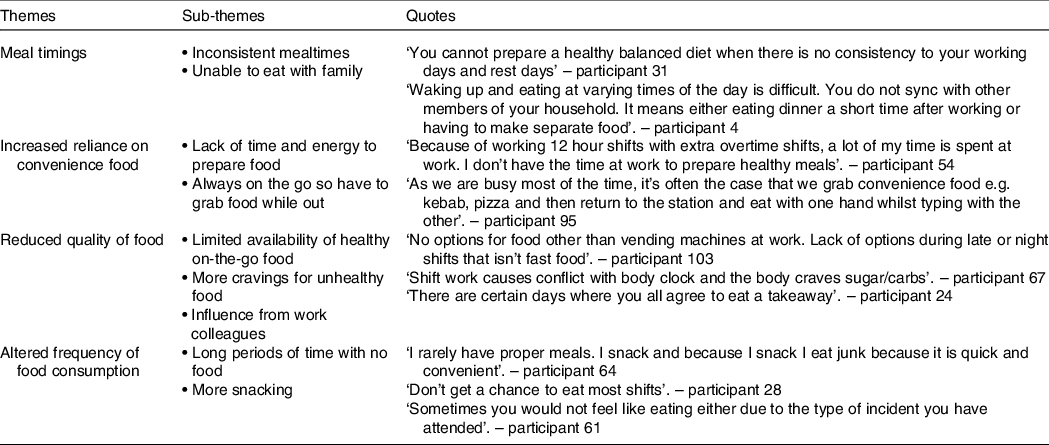
Theme 1: meal timings
Lack of consistency of meal timings was the most commonly reported effect that shift work has on participant’s diet. Many said they struggle to get into a routine with eating and that they will often be sleeping through ‘typical’ mealtimes. Some individuals also spoke of the social impact that shift work has with family mealtimes being missed.
Theme 2: increased reliance on convenience food
Long working hours and forced overtime mean that many individuals do not have the time or energy for preparing food in between shifts, therefore resulting in food being bought on shift. Even if food has been prepared, it often does not get eaten due to the on-the-go nature of the job. Food must be transportable meaning convenience food is often bought instead.
Theme 3: reduced quality of food
Lack of availability of healthy on-the-go foods, particularly during late and night shifts, was commonly spoken of. With canteens no longer open at police stations, many rely on vending machines or fast-food outlets. Many participants also spoke of the psychological impact that shift work can have on food choices, with heightened cravings for unhealthy foods and coffee. This can then be exacerbated by work colleagues encouraging group takeaways.
Theme 4: altered frequency of food consumption
Participants reported that the demand of their job and lack of designated breaks mean that either they go the whole shift without eating or they rely on snacking more. Some also spoke of losing their appetite due to the job that they had been to that shift, meaning they will not eat on shift.
Factors that influence food choice
Convenience was ranked the highest influence of food choice (49·0 %), with the majority of participants placing a high importance on food being easy to prepare (70·9 %; n 90) and able to be cooked very simply (50·4 %; n 64). Price was the next highest ranked (41·5 %) with value for money (48·8 %; n 62) being a big influence on food choice. Factors relating to ethical concern (6·0 %), natural content (15·2 %) and weight control (18·9 %) were not deemed to be greatly important for police officers when choosing food.
Discussion
This is the first mixed-methods study that has been conducted on UK police officers from several forces, exploring not only the impact that different shifts have on their quality of diet but also the barriers they are faced with to healthy eating. Shift work was found to have a negative impact on the diet quality of UK police officers, with scores being significantly lower on all shift types compared with rest days. Furthermore, most participants said that their diet has been affected by working shifts, specifically through their increased reliance on convenience and poor-quality foods and altered frequency and timing of food consumption. The majority of this group were overweight or obese (65·4 %) which somewhat reflects these findings. Diet quality across all shift types was negatively correlated with BMI. Likewise, how participants manage their eating around varying shift timings was also associated with BMI – obese subjects were less likely to follow a structured eating regimen, compared with those who were in the healthy or overweight categories. It was also identified that, while most participants are willing to make their diet healthier, they incur several barriers in doing so, including lack of time (both on and off shift), motivation and cost. In keeping with this, the biggest influences on food choices reported by police officers related to convenience and the price of food. In the past, health promotional studies that have been most successful in the police have combined structured programmes with both behaviour change support and peer support(Reference MacMillan, Karamacoska and Masri44). However, prior to workplace programmes being established, this study highlights the value of police-specific dietary interventions to be developed to alleviate disease risk in this population. Guidance provided should consider the convenience and the cost of food, in order to support behaviour change.
Previous studies on police officers both around the world and in the UK have shown a similar prevalence of overweight and obesity ranging between 66 and 67 %(Reference Alghamdi, Yahya and Alshammari3,Reference Gibson, Eriksen and Singh5,Reference Nasruddin, Sedek and Zubairi6) . An exception to this, however, are studies performed on American officers, whereby rates appear greater, with a prevalence of 79·3 % seen in North American police(Reference Rajaratnam, Barger and Lockley45). Nonetheless, this is in keeping with the national trends of obesity, whereby 73·6 % of the US population are estimated to be overweight or obese(46) compared with 64·2 % in the UK(47). Therefore, rates were only fractionally more than the national average in this present study. Although the information on sex was not collected in this present study, other studies have shown these percentages to be far greater when analysing male police officers alone, with 78·4 % overweight or obese in the UK(Reference Gibson, Eriksen and Singh5) and more than 90 % in the USA(Reference Gu, Charles and Burchfiel4). Considering the physical demands of a police officer’s job, which involves periods of high-intensity activity while wearing up to 40 kg of protective equipment(Reference Dempsey, Handcock and Rehrer19), optimal fitness would be expected to ensure that job performance is not compromised. Although a large BMI does not assume poor physical fitness, it is associated with a lower quality of diet(Reference Drenowatz, Shook and Hand48), as seen in this study. Therefore, these figures are concerning as adequate nutrition is crucial to ensure the physically demanding tasks such as sprinting, jumping obstacles and physically restraining people are performed successfully.
Interestingly, less than a quarter (22·3 %) of participants reported not having enough information about healthy eating, suggesting that their nutritional knowledge is not the root cause of the overweight and obesity figures. Although a similar finding was observed in US police officers(Reference MacKenzie-Shalders, Matthews and Dulla22), both studies relied on self-reported data. When questionnaires were explicitly administered to assess the nutritional knowledge of police officers in Malaysia(Reference Nasruddin, Sedek and Zubairi6) and Indonesia(Reference Puspikawati, Kertia and Purba49,Reference Sitoayu, Choirunnisa and Pakpahan50) , contradictory results were seen, with most individuals having a low to moderate understanding of nutrition. Furthermore, these studies showed no correlation between nutritional knowledge and dietary intake. Therefore, educational nutritional interventions may not result in altered dietary behaviours in this occupational group.
While the current study did not focus on dietary intake per se, diet quality on varying shift types was assessed via the Rapid Eating Assessment for Participants, short version questionnaire. MacKenzie-Shalders et al.(Reference MacKenzie-Shalders, Matthews and Dulla22) used a similar approach when determining the diet quality of US police officers. Although shift types were not accounted for in their research, it was found that 20 % of the population had a low-quality diet as indicated by a score of ≤ 27. If using this cut-off in the current study, then it would appear that the UK police cohort had a worse quality of diet, with 42·5, 44·9, 47·2 and 24·4 % having a score ≤ 27 on early, late, night and rest days, respectively. However, the comparability of these results is questionable due to the American study being based on an average week, which may comprise varying shift types and rest days, compared with the current study, which was based on one specific type of shift. Nonetheless, it was evident from our findings that no matter the type of shift, diet quality was significantly worse than on rest days. Furthermore, although not statistically significant, out of the three shift types explored, working earlies (starting between 04.00–11.59 hours) resulted in the most excellent quality of diet. This finding is not surprising as compared with late and night shifts, earlies are unlikely to disrupt one’s sleep cycle and subsequent meal timings too as great an extent, potentially being that dissimilar to a rest day. Compared with working on rest days, fewer individuals reported ‘usually/often’ or ‘sometimes’ skipping breakfast and eating less than two servings of whole grains, fruit, vegetables and dairy products. Police officers have been found to eat significantly more meals on rest days(Reference MacKenzie-Shalders, Matthews and Dulla22); therefore, the high diet quality on days off is likely a reflection of more eating opportunities when compared with working days. This is further supported by participants reporting that shift work affects their frequency of food consumption, with some saying that whole shifts would be had without eating due to the lack of an appropriate opportunity. Similar findings have been reported among rotating shift work nurses, whereby only 1·13 (sd 0·5) meals were consumed on night shifts compared with 2·06 (sd 0·68) and 2·44 (sd 0·81) on day shifts and rest days, respectively(Reference Zverev51). Furthermore, a recent systemic review that analysed thirty-three studies found that shift workers skip more meals and consume more food at night than regular daytime workers(Reference Souza, Sarmento and de Almeida52).
Altered meal timings are a common issue that shift workers have to contend with, which police officers highlighted in this study. The largest proportion of participants (37 %) based their meals on when they awoke instead of the time of day. This is in keeping with Kosmadopoulos et al.’s(Reference Kosmadopoulos, Kervezee and Boudreau21) research on Canadian police, which, through analysing time-stamped photographs, found that the timings of meals depended on the type of shift, with energetic intake occurring significantly later on night shifts compared with early shifts, evening shifts and rest days. Research has shown that glucose disposal is greatest in the morning and reduces considerably by the evening(Reference Morris, Purvis and Mistretta53,Reference Scheer, Hilton and Mantzoros54) . Furthermore, a study on 4243 individuals found that those who ate a larger proportion of their energy content at night were more likely to gain weight than those who ate more during the day(Reference Hermengildo, Lopez-Garcia and Garcia-Esquigrund55). Therefore, planning food intake around the time of day should help negate the metabolic alterations that occur with shift work instead of when you wake up. The current study somewhat reflects this, with meal timing associated with BMI. Only 20·8 % of obese participants reported basing their eating on the time of day, and 37·5 % did not think about it. With all the individuals in this study working more than one shift type, there is a plausible reason to consider the metabolic impact caused by irregular meal timings as a mediator of obesity and related illnesses in this population(Reference Grant, Coates and Dorrian56,Reference Qian, Morris and Caputo57) .
Although most participants reported being willing to change their diet to make it healthier, they raised several barriers. Not having time to eat healthily is a consistent finding among police and other shift workers(Reference MacKenzie-Shalders, Matthews and Dulla22,Reference Nea, Pourshahidi and Kearney58,Reference Phiri, Draper and Lambert59) . The on-the-go nature of a police officer’s job potentially heightens this barrier, as individuals reported not being given designated breaks. Consequently, eating cannot be scheduled and is not prioritised. Furthermore, police often face forced overtime, meaning there is limited time between shifts to prepare food, primarily as sleep was often spoken of as being more critical. In keeping with this, collectively, factors of convenience were reported to be the biggest influence on food choice. This was also reflected in their dietary patterns. On rest days only 20·4 % of individuals said they eat four or more meals from sit-down or take-out restaurants, compared with working early, late and night shifts (34·6, 48·0 and 32·2 %, respectively). An issue with this (particularly on late and night shifts) is that healthy options are reported to be limited. This is supported by studies that have shown that foods bought out of the home tend to be more energy dense and higher in fats and sugar compared with food made at home(Reference Lachat, Nago and Verstraeten60). Furthermore, unlike healthcare shift workers who source the majority of their nutrition from canteens(Reference Gupta, Coates and Dorrian61), for police officers, hot food options are limited to fast-food outlets due to workplace cafeterias no longer existing.
The findings of this study should be interpreted in the context of its limitations. Due to the hard-to-reach population of police offers, a snowball sampling method was used to recruit participants. This method has inherent biases as participants often pass the information on the research to those similar to themselves and as such, it can limit the confidence that the outcomes of this study are truly representative of the population. However, the survey was made widely available on professional social media channels to encourage a diverse response. To encourage participation, the researchers chose not to ask participants any questions related to their job role, rank, location of work and clinical history. This would have provided useful context for the data and allowed further analysis as these factors may influence dietary practices. Furthermore, future research may also consider the length of time participants had been conducting stated shift patterns in their previous or current job. Equally, the presence of a psychiatric disorder or use of psychotropic drugs may impact dietary patterns, as this was not collected as part of this study the data presented should be interpreted with this caveat and further investigations may wish to consider this. This study utilised three validated questionnaires to understand the dietary behaviours of police officers, which include the assessment of diet quality (Rapid Eating Assessment for Participants, short version) and the various factors that may influence food choice (FCQ) and weight management. Dietary behaviours are complex interactions of social, cultural and environmental factors; therefore, accurately measuring an individual’s dietary patterns, diet quality and overall intake are fraught with errors. Indeed, dietary assessment is shown to present high variability and is subject to random errors as it relies on accurate cooperation with participants across the assessment period(Reference Rossato and Fuchs62). The chosen methods in this study do not provide an accurate picture of total dietary patterns, but they do provide a snapshot of current diet quality and behaviours without adding undue burden to the participants. Furthermore, the use of self-reported measurements of weight, height and BMI may also add inaccuracies, for example, the use of self-reported body weight is subject to measurement and reporting errors. However, our results align with previous reports that suggest UK male police officers have a similar mean BMI in a sample size of 2586(Reference Hermengildo, Lopez-Garcia and Garcia-Esquigrund55). Equally, it is suggested the use of BMI in an active population group may not be appropriate as BMI is relative to body weight and not influenced by body compositional differences that may exist in active populations (e.g. having higher muscle mass). Future research should undertake body composition assessment to determine if obesity is related to differences in diet quality in police officers. Finally, it should be recognised that this study provided a snapshot of dietary behaviours in a small cohort of UK police officers and therefore may not be generalisable to wider national and international police forces. This study provides important foundations for future research to understand the health and well-being of police officers nationwide.
In conclusion, it was found that while UK police officers may know how to improve their diet and are willing to do so, they encounter several barriers, which may contribute to the high levels of obesity and cardiometabolic health conditions observed in this population. Lacking time both on and off shift and access to healthy foods are likely to play a vital role in the reduced quality of diet seen on all shift types, compared with rest days. Furthermore, altered meal timings were a commonly reported consequence of shift work and may contribute to the adverse health outcomes seen in police officers through its detrimental effect on the body’s metabolism. With nearly two-thirds of the participants in this study being overweight or obese, there is a need for police-specific dietary interventions to be put in place, potentially exploring the metabolic role that both meal timing and protein intake can have on the body, while also providing practical solutions to the barriers faced by these individuals.
Acknowledgements
The authors’ responsibilities were as follows: S. D. and K. A. designed the research; K. A. acquired data; S. D., A. S. and K. A. had full access to all the data and statistically analysed the data; K. A. drafted the manuscript; S. D. and A. S. critically revised the manuscript for important intellectual content; and all authors read and approved the final manuscript.
The authors have no conflicts of interest to declare.


