The eating habits of adolescents have been a matter of public health concern, owing to the high consumption of ultra-processed foods, with high energy density, rich in fat, sugar, and Na, as well as low consumption of fresh foods, such as fruits and vegetables(1). Inadequate nutrition in adolescence is an important risk factor for the development of chronic non-communicable diseases, for example, CVD, cancer, diabetes and obesity(Reference Aune, Giovannucci and Boffetta2,Reference Louzada, Costa and Souza3) .
Household composition, measured as co-residence with close relatives, is considered as an environmental factor associated with several components of adolescent well-being, including health, growth and eating behaviours(Reference Patrick and Nicklas4,Reference Cunningham, Chandrasekar and Cartwright5) . This association can be explained by the fact that household composition influences the components of the domestic environment, including availability and distribution of resources, time allocation, norms and behaviours(Reference Patrick and Nicklas4).
Thus, the home environment plays an important role in the formation of adolescents’ eating habits(Reference Bauer, Berge and Neumark-Sztainer6). Families can influence adolescents’ food preferences and interfere in the development and maintenance of eating habits, through an informal learning process(Reference Kral and Rauh7) and with the potential to influence food choices throughout life(Reference Cardoso, Santos and Nunes8). Adolescents can develop healthy habits by observing their parents’ habits, and through the resources made available to them, or even by the fact that parental practices can enhance the option for certain foods by repeated exposure to such foods(Reference Vaughn, Ward and Fisher9).
In systematic review studies, parental eating behaviours are associated with adolescents’ unhealthy(Reference van der Horst, Oenema and Ferreira10) and healthy(Reference Pearson, Biddle and Gorely11) eating behaviours alike. Leite et al.(Reference Leite, Pompeo and Monteiro12), in a recent systematic review, found that adolescents who lived with both parents had a higher frequency of breakfast consumption and higher consumption of vegetables; also, adolescents from nuclear families had healthier food preferences. By contrast, irregular breakfast consumption and consumption of unhealthy food markers were more frequent among adolescents from single-parent families, reconstituted families and extended families(Reference Leite, Pompeo and Monteiro12).
It is noteworthy that among the studies found in the literature review, none analysed food consumption based on the identification of dietary patterns (DP), considering only food groups and meals frequency. In this context, considering that the assessment of food consumption is a complex issue, the analysis of DP has been recommended as it allows a broad view of the diet, as individuals do not consume isolated foods or nutrients(Reference Slattery13). Several approaches are used to derive DP, including confirmatory factor analysis (CFA)(Reference Varraso, Garcia-Aymerich and Monier14). Thus, the aim of this study was to examine DP using CFA and analyse its association with household composition in Brazilian adolescent students.
Methods
Study design and database
This is a cross-sectional school-based study, with data from Brazil’s National Student Health Survey (Pesquisa Nacional de Saúde do Escolar, PeNSE), carried out in 2015 by the Brazilian Institute of Geography and Statistics (IBGE) and the Ministry of Health, and supported by the Ministry of Education. PeNSE is a national survey whose objective is to produce information about the magnitude of risk and health protection factors and to support and evaluate appropriate health interventions for adolescents, thus helping to monitor student health(15).
PeNSE is a nationwide survey with geographic coverage for Brazil including the Major Regions, Federative Units and Capitals. This sample included 102 072 Brazilian students (participation rate: 96·2 % for schools and 79·9 % for students), regularly enrolled in the ninth grade of elementary school, in morning and afternoon classes of public and private schools, located in urban and rural areas(15,Reference Oliveira, Campos and Andreazzi16) . Three-stage cluster sampling was performed, based on the 2013 School Census. The cluster sampling was scaled from fifty-three strata formed by geographical domains (capitals of the twenty-six Brazilian states + the Federal District + twenty-six municipalities in the interior of each state) to ensure the national representativeness of the selected students. The primary units were the fifty-three municipalities; the secondary, the schools, selected from a register provided by the School Census; and the tertiary, the classes. The schools were selected according to the number of classes in the ninth grade, and the classes were selected at random. All students from the selected classes who were present on the day of collection were invited to answer the questionnaire(15,Reference Oliveira, Campos and Andreazzi16) .
More details on the methodological and sampling characteristics of PeNSE 2015 are available in a previous publication(15,Reference Oliveira, Campos and Andreazzi16) . PeNSE 2015 was approved by the National Research Ethics Committee of the National Health Council(15).
Data collection and study variables
Data collection took place between April and September 2015, through a self-administered smartphone-based questionnaire that was structured into thematic modules(15).
The dependent variable was constructed on the basis of food consumption of the following food groups in the last 7 d prior to the interview: beans, legumes/vegetables (excluding potatoes and cassava), fresh fruit/fruit salad, sweets (sweets, candies, chocolate bars, chewing gums, bonbons or lollipops), fried snacks (e.g. chicken drumsticks, fried kibbeh or French fries, except for potato chips), soft drinks and ultra-processed foods (e.g. hamburger, ham, bologna, salami, sausages, instant noodles, processed snacks or crackers). Adolescents could answer that they had not consumed particular items or indicate a frequency of 1–7 d.
For the derivation of DP, food group intake frequencies were used to identify latent variables (patterns): ‘Healthy eating’, reflected by the markers: beans, legumes/vegetables and fresh fruits/fruit salad; and ‘Unhealthy eating’, reflected by the markers: sweets, fried snacks, soft drinks and ultra-processed foods.
The independent variable was household composition, assessed through the following questions: ‘Do you live with your mother?’ and ‘Do you live with your father?’. Both questions had ‘yes or no’ as answer options, which were combined and categorised into: lives with both parents, lives only with mother, lives only with father and lives without any parents.
The covariates considered in this study were number of residents in the household, type of school attended (public or private), and goods and services score – the latter two as markers of socio-economic status(Reference Levy, Castro and Cardoso17).
The variable number of residents in the household was determined by the question: ‘Including yourself, how many people live in your house or apartment?’, with answer options ranging from one person (I live alone) to ten or more. Type of school attended, considered as a proxy of socio-economic level(Reference Souza, Neves and Souza18,Reference Neves, Souza and Gorgulho19) , was categorised as public or private. The goods and services score was constructed on the basis of following items: possession of landlines, cell phones, computers, Internet access, cars, motorcycles, bathrooms with a shower in the house, and presence of a maid three or more days a week. Weights were assigned to the items that were equivalent to the inverse of the frequency of possession or presence in the total study sample. The score of each adolescent was determined by adding the weights of the respective items, which were later divided into tertiles(Reference Levy, Castro and Cardoso17).
Statistical analysis
Statistical analyses were performed in the software Status (Statistical Software for Professionals, College Station, TX), version 12.0. The survey (svy) module was used to consider survey weights and research design. The survey weights took into account the weights for the schools, the classes and the students. Students’ weight was corrected by the number of students in the class with valid questionnaires (students who accepted participating in the research and informed their age and sex)(15,Reference Oliveira, Campos and Andreazzi16) . The weights of the schools were estimated considering the number of ninth grade classes registered in the school, the sample size of schools and the total number of classes registered. Class weights were calculated considering the number of ninth grade classes in each school and the number of selected classes in each school. Finally, for each student in the selected classes, a weight was calculated considering the product of the weight of their class by the weight of their school, corrected by the number of students in the class with questionnaires considered valid(15,Reference Oliveira, Campos and Andreazzi16) .
The measurement model for latent variables was constructed using age-stratified CFA (11–14 years and 15–19 years). CFA is an analysis method that belongs to structural equation modelling. This method allows checking the fit between observed data and a previously hypothesised model, based on the theory that specifies hypothetical causal relationships between latent factors (unobservable variables) and their indicator variables (observable variables). CFA results can provide evidence of the convergent or discriminant validity of theoretical constructs, indicating the difference with which different indicator variables are or are not strongly related(Reference Brown20).
To evaluate if the model has a good fit, the following parameters and respective reference values were used: chi-square test with respective non-significant P-value (≥ 0·05), incremental adjustment indices (comparative fit index and Tucker–Lewis index (both > 0·95), and residual-based absolute fit indices (root mean square error of approximation (RMSEA) < 0·06, RMSEA 90 % CI < 0·08 and standardized root mean square residual < 0·05)(Reference Slattery13,Reference Mâroco21) . Another important aspect is construct validity; for convergent validity, the factor loadings of the indicators must present values ≥ 0·30(Reference Varraso, Garcia-Aymerich and Monier14,Reference Togo, Heitmann and Sorensen22) , and for discriminant validity, the correlation between the latent variables must not be excessively high (> 0·85)(Reference Kline23). The latent variables were identified using the software RStudio and by implementing the packages Lavaan 0·5, semPlot 0·3·2, semTools 0·4 and Rio.
Descriptive statistics were presented as frequency and/or mean and 95 % CI. The association between household composition and food consumption was estimated using multiple linear regression models, obtaining regression coefficients (β) and respective 95 % CI. The models were stratified by sex and age and adjusted for socio-economic status, number of residents in the household, and administrative dependency of the school. In the adjusted analysis, we used all analysed covariates, and the least informative covariates were successively removed from the model in a backward stepwise elimination based on the Akaike information criterion. The assumptions of normality, linearity and homoscedasticity of the linear regression model were verified using residual analysis.
Results
A total of 102 072 adolescent students were evaluated: 51·3 % were females, 69·3 % were aged between 11 and 14 years, 76·8 % studied in public schools, 34·3 % were classified in the 2nd tertile of the goods and services score, and the average number of residents in the household was 4·67 (Table 1).
Table 1. Characterisation of adolescents in the National School Health Survey (PeNSE) according to household composition. Brazil, 2015
(n 102 072)
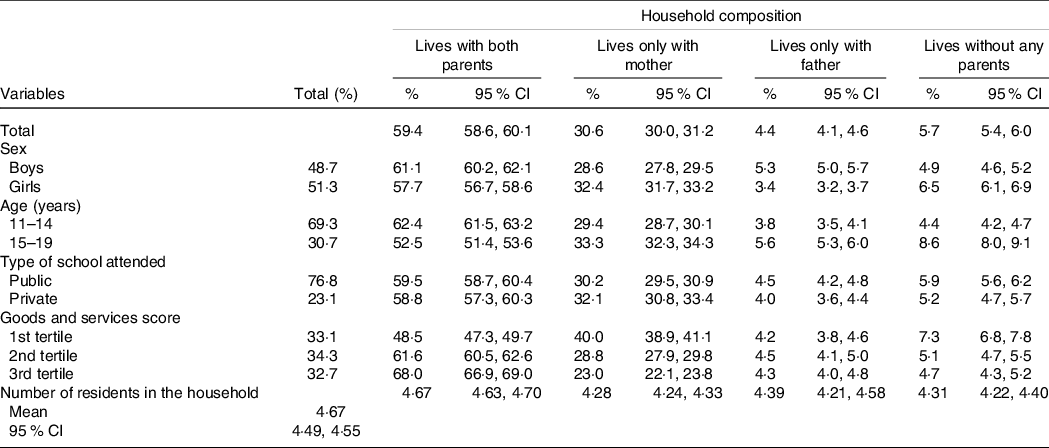
Most adolescent students lived with both parents (59·4 %), 30·6 % lived only with their mother, 4·4 % only with their father and 5·7 % with neither parent. Among adolescents who lived with both parents, 62·4 % were aged between 11 and 14 years, 61·1 % were males, 59·5 % studied in a public school, and 68·0 % belonged to the highest tertile of the score of goods and services and lived on average with 4·67 people in the household (Table 1).
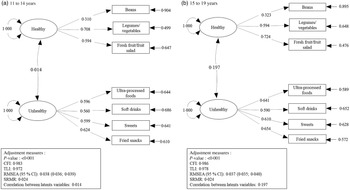
Figure 1 shows the model for measuring DP, age-stratified for the adolescents. The model showed a good fit index for all parameters, with the exception of the chi-square test, which showed a significant P-value, but this is justified by the size of the study sample. All indicator variables presented loads > 0·30. For adolescents aged 11–14 years, the variables indicating the healthy DP presented factor loadings of 0·31 for beans, 0·71 for legumes/vegetables and 0·59 for fresh fruit/fruit salad; and the factor loadings of the unhealthy DP were 0·60 for ultra-processed foods and sweets, 0·56 for soft drinks, and 0·62 for fried snacks. For adolescents aged 15–19 years, the variables indicating the healthy DP presented loads of 0·32 for beans, 0·59 for legumes/vegetables, and 0·72 for fresh fruits/fruit salad, and the variables indicating the non-healthy DP had loads of 0·64 for ultra-processed foods, 0·59 for soft drinks, 0·61 for sweets and 0·65 for fried snacks.

Fig. 1. Measurement models of the latent construct of dietary patterns examined by confirmatory factor analysis (CFA). National School Health Survey (PeNSE). Brazil, 2015 (n 102 072). CFI, comparative fit index; TLI, Tucker–Lewis index; RMSEA, root mean square error of approximation; SRMR, standardized root mean square residual.
Among adolescent students aged 11–14 years, boys who lived only with their mothers (β: −2·1, 95 % CI −3·8, −0·4) and boys (β: −4·9, 95 % CI −8·8, −1·0) and girls (β: −4·5, 95 % CI −8·6, −0·5) who lived with neither parent showed lower adherence to the healthy DP compared with those who lived with both parents. On the other hand, boys (β: 7·6, 95 % CI 5·1, 10·1) and girls (β: 6·0, 95 % CI 3·8, 8·2) who lived only with their mother and boys (β: 4·6, 95 % CI 0·03, 9·2) and girls (β: 5·3, 95 % CI 0·03, 10·6) who lived only with their father showed greater adherence to the unhealthy DP compared with those who lived with both parents (Table 2).
Table 2. Association between household composition and healthy and unhealthy food consumption by Brazilian adolescents, stratified by sex and age. PeNSE, Brazil, 2015
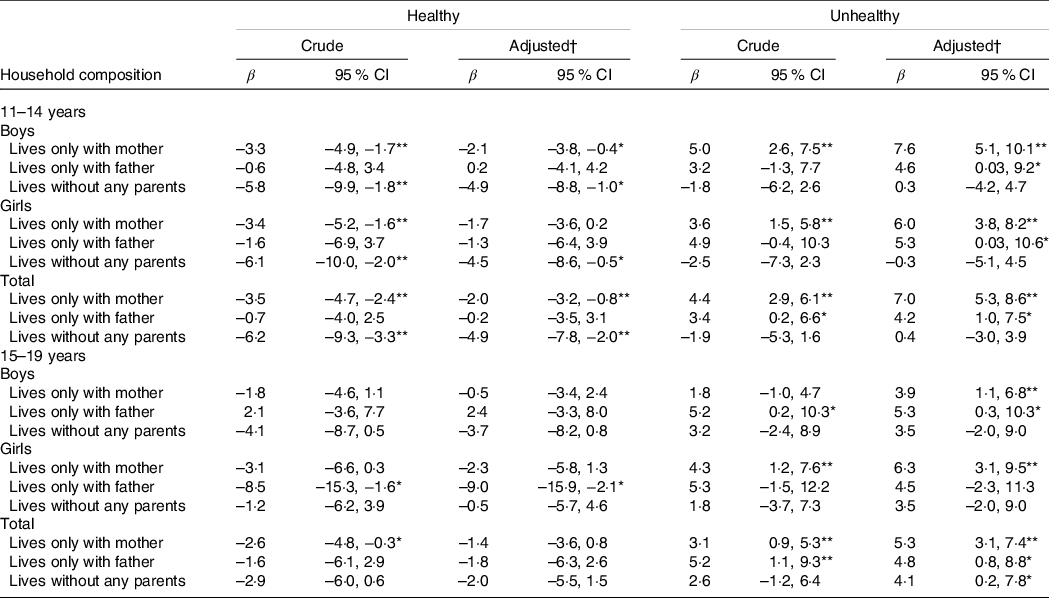
Crude and adjusted models considering lives with both parents as reference category.
* P < 0·05.
** P < 0·01.
† Model adjusted for socio-economic status, number of residents and administrative dependency of the school.
For adolescent students aged between 15 and 19 years, boys who lived only with their mother (β: 3·9, 95 % CI 1·1, 6·8) and those who lived only with their father (β: 5·3, 95 % CI 0·3, 10·3) showed greater adherence to the unhealthy DP compared with those who lived with both parents. Girls who lived only with their father showed lower adherence to the healthy DP (β: –9·0, 95 % CI −15·9, −2·1) and those who lived only with their mother showed greater adherence to the unhealthy DP (β: 6·3, 95 % CI 3·1, 9·5) compared with those who lived with both parents (Table 2).
Discussion
In Brazil’s National Student Health Survey, when assessing healthy and unhealthy DP, CFA showed that both male and female adolescent students aged 11–19 years who lived in single-parent households had lower adherence to the healthy DP and greater adherence to the unhealthy DP compared with those who lived with both parents. Additionally, adolescent students aged 11–14 years who lived with neither parent showed lower adherence to the healthy DP compared with those who lived with both parents.
To date, this is the first study to adopt this methodology for identifying DP with a view to assessing the association with the family composition of Brazilian adolescents, with results similar to those found in Norwegian(Reference Fismen, Smith and Samdal24), Chinese(Reference Siu, Chan and Lee25), Korean(Reference Baek, Paik and Shim26) and Australian(Reference Pearson, MacFarlane and Crawford27) adolescents. Among Norwegian adolescents, Fishmen et al.(Reference Fismen, Smith and Samdal24) found that after adjustment for socio-economic status, adolescents who lived in single-mother families had lower consumption of vegetables and higher consumption of sugar-sweetened beverages compared with adolescents who lived with both parents.
In a longitudinal study carried out by Pearson et al.(Reference Pearson, MacFarlane and Crawford27), with Australian adolescents who were followed up for 2 years, the authors found that when comparing waves 1 and 2, girls who lived with both parents were less likely to increase their consumption of snacks, compared with those who lived with only one of the parents.
In the study by Baek et al.(Reference Baek, Paik and Shim26), after adjustment for age, sex, number of family members and family income, Korean children and adolescents who lived with both parents had higher scores (consumption equivalent to or greater than the recommendation) for the groups ‘Fruits’ and ‘Milk and Dairy Products’ compared with those living with one parent. However, Baek et al.(Reference Baek, Paik and Shim26) found no statistical difference for food consumption of children and adolescents who lived without either parent and those who lived with both parents. The authors considered that this fact may not compromise the eating habits of children and adolescents, especially when they are under the care of grandparents or other family members.
The association between household composition and healthy and unhealthy DP can be explained by the fact that there are differences in relation to the schedules and routines established in each household composition. In the presence of both parents, healthy eating habits are more easily established, highlighting the importance of having meals as a family. Melo et al.(Reference Amaral e Melo, Silva and Nakabayashi28), in a systematic review, found an association between frequency of family meals and healthy eating among adolescents, such as increased consumption of fruits, vegetables, beans and wholegrains.
On the other hand, in single-parent families, responsibilities are not shared; as a result, a greater overload of domestic chores is attributed to such single parent. There are changes in the routines of purchase and preparation of food, causing, in most cases, the replacement of home-made meals by quick and low-nutrient preparations(Reference Fismen, Smith and Samdal24,Reference Duriancik and Goff29) .
Also, living with only one parent can accelerate the behavioural autonomy of adolescents, who may have more responsibilities, independence and decision-making power than those living with both parents, predisposing adolescents from single-parent families to unhealthy food choices(Reference Sessa and Steinberg30,Reference Levin, Kirby and Curriel31) .
Some authors explained that household composition can be a proxy of socio-economic status, as parents’ lower socio-economic status is associated with lower vegetable consumption and higher consumption of soft drinks(Reference Fismen, Samdal and Torsheim32). Two-parent families are more likely to be White and have medium to high incomes(Reference Schmeer33), while single-parent families are more likely to be black and have low incomes(Reference DeNavas-Walt and Proctor34). It is noteworthy that in the present study, the associations of household composition with adolescents’ DP remained significant even after adjusting for the goods and services score, number of residents in the household and type of school – markers of the adolescents’ socio-economic level.
Siu and Lee(Reference Siu, Chan and Lee25), in a qualitative study with adolescents from low-income families in the city of Hong Kong, found that the family’s eating habits influenced the participants’ eating behaviours and that the nutritional quality of family meals depended on parents’ food preferences and financial difficulties. Although participants were aware that the meals prepared by their parents were unhealthy, they rarely expressed their concerns or advocated changes, as they wanted to help their parents reduce family expenses. In addition, parents passed on to their children the stereotype that healthy eating is very expensive(Reference Siu, Chan and Lee25).
In the present study, household composition was classified into four categories (both parents, only with the mother, only with the father and none of the parents). However, a variety of categorisation and types of household composition can be seen in the literature, including reconstituted family, nuclear family(Reference Parikka, Levälahti and Martelin35), extended family(Reference Deng36), single father, single mother(Reference Levin, Kirby and Curriel31) and sibling status(Reference Pearson, MacFarlane and Crawford27). Thus, it appears that household composition is complex to be evaluated, and therefore a more detailed and standardised classification system is needed. In their systematic review, Leite et al.(Reference Leite, Pompeo and Monteiro12) found consistency in the findings of the studies, despite the diversity of categorisation of the household composition across the different studies.
The present study has some limitations. The PeNSE is a survey conducted with adolescent students, and the target population was formed by students enrolled in the ninth grade of elementary school(Reference Oliveira, Campos and Andreazzi16). However, according to the National Household Sample Survey (PNAD), the schooling rate in Brazil was of 98·2 % (2012) and 98·4 % (2013) for the population aged from 6 to 14 years, and of 84·2 % (2012) and 84·3 % (2013) for the age group from 15 to 19 years, regardless of the family monthly income(37,38) . Thus, Oliveira et al.(Reference Oliveira, Campos and Andreazzi16) highlights the potential offered by the school for carrying out surveillance actions for the health conditions of adolescents. The use of secondary data does not allow considering other factors that may interfere with the food consumption of adolescents, for example not including information about parents’ eating behaviour, which could mediate the association between household composition and food consumption of adolescents(Reference Pearson, Biddle and Gorely11,Reference Pearson, MacFarlane and Crawford27,Reference Wang, Beydoun and Li39) . Thus, the large CI for some of the associations may indicate that other factors might affect the association between household composition and DP.
Furthermore, the questions used to characterise the household composition do not allow the distinction between biological parents and foster parents. However, the assessment of household composition is similar to the classification identified in other studies that assess the association between household composition and food consumption among adolescents(Reference Leite, Pompeo and Monteiro12,Reference Baek, Paik and Shim26,Reference Pedersen, Holstein and Flachs40) . Another question, used to estimate household size and considered in the adjustment of the analysis model, only allows assessing how many people live in the household, making it impossible to identify the degree of kinship with the adolescent.
One of the main strengths of the study is the school-based probability sample with regional and national representativeness, which provides further insights into the association of household composition and food consumption in adolescents. The careful collection of information (training of evaluators to collect reliable data and questionnaires applied since the first survey conducted in 2009 and the second in 2012) and the use of standardised protocols can minimise measurement errors(15,Reference Oliveira, Campos and Andreazzi16) . In addition, the present study had an unprecedented approach, as there is no study in the literature investigating the association of household composition and DP of Brazilian adolescent students.
The assessment of food consumption using nationwide food surveys, such as PeNSE, is important for public health, as these surveys enable the assessment of problems relative to food consumption, increase knowledge of the determining factors of food consumption (including environmental ones), and contribute to the development of public policies and actions for promotion of healthy eating(41).
Eating in company is one of the recommendations of the food guide for the Brazilian population, which highlights several benefits of adopting this guideline, such as greater opportunities to socialise with family and friends, greater social interaction and, in general, more pleasure with eating(42). Thus, evaluating the association between household composition and adolescents’ DP is important to tailoring and targeting health promotion actions, allowing parents to be informed about their role in promoting healthy food habits.
Conclusion
Adolescent students who lived in single-parent families showed lower adherence to a healthy DP and greater adherence to an unhealthy DP. Among younger male and female adolescents, living without either parent contributed to lower adherence to a healthy DP.
Household composition should be taken into account in food and nutrition education practices, which are implemented through the work of health workers, including nutritionists, together with schoolteachers, in order to inform parents about the importance of their role in promoting healthy food consumption among adolescents.
Acknowledgements
This work was supported by the Coordenação de Aperfeiçoamento de Pessoal de Nível Superior (CAPES), Brazil, through a Master grant (M.R.S.; Finance Code 001). However, CAPES had no role in the design, analysis or writing of this manuscript.
M.R.S.: conceptualization, formal analysis, writing – original draft, review and editing. A.C.S.A.: conceptualization, formal analysis, writing – review and editing. M.F.: formal analysis, writing – review and editing. A.P.M.: conceptualization, formal analysis, writing – review and editing. P.R.M.R.: conceptualization, formal analysis, writing – original draft, review and editing. All authors read and approved the final version.
The authors declare no conflict of interest.