


Excess weight is often associated with a chronic inflammatory state that may lead to endothelial dysfunction, increased arterial stiffness and systemic arterial hypertension and thus increase cardiovascular risk(Reference Manna and Jain1,Reference Kwaifa, Bahari and Yong2) . Arterial stiffness is a predictor of major cardiovascular events(Reference Vlachopoulos, Aznaouridis and Stefanadis3). Evidence shows increased arterial stiffness in adults with obesity when compared with those with normal weight(Reference Wildman, Mackey and Bostom4,Reference Wohlfahrt, Somers and Cifkova5) and an association between weight gain and progression of arterial stiffness(Reference Wildman, Farhat and Patel6).
Arterial stiffness can be assessed by pulse wave velocity (PWV) and indirectly by the augmentation index (AIx)(Reference Laurent, Cockcroft and Van Bortel7). A 1 m/s increase in carotid-femoral PWV has been associated with a 14–15 % increase in the risk of cardiovascular death or all-cause mortality(Reference Vlachopoulos, Aznaouridis and Stefanadis3). It is thus crucial to intervene as early as possible to reduce cardiovascular disease risk factors in individuals with excess weight and those with accelerated vascular aging(Reference Brandão, Amodeo and Alcântara8). Dietary intake of carbohydrate-containing foods with different glycaemic loads may induce changes in the chronic inflammatory state and improve vascular health.
Metabolic responses to the carbohydrate content of foods are measured indirectly by glycaemic index (GI) and glycaemic load (GL)(Reference Atkinson, Foster-Powell and Brand-Miller9,Reference Foster-Powell, Holt and Brand-Miller10) . There is evidence of beneficial effects of long-term dietary interventions (24–68 weeks of duration) with foods of low GI-GL on fasting insulin and pro-inflammatory markers and they may be effective for primary prevention of obesity(Reference Schwingshackl and Hoffmann11). In fact, GI-GL of foods have been regularly considered as part of dietary strategies for weight loss in clinical practice(Reference Vidal-Ostos, Ramos-Lopez and Jebb12–Reference Perin, Camboim and Lehnen14).
To the best of our knowledge, a small number of randomised clinical trials have evaluated arterial stiffness response to low-energy diets with different glycaemic loads(Reference Wildman, Farhat and Patel6,Reference Zurbau, Jenkins and Jovanovski15) . Considering that obesity is associated with increased arterial stiffness leading to increased cardiovascular risk and that different carbohydrate contents may help reduce arterial stiffness and the risk associated, we conducted a randomised clinical trial to evaluate the effects of low-energy diets with different glycaemic loads on arterial stiffness parameters in adults with excess body weight. Secondarily, we evaluated blood pressure (BP), body composition, glycaemic and lipid profiles in these participants. We hypothesised that a short-term (45 d) dietary intervention based on a low-energy low-glycaemic load (LGL) diet could improve arterial stiffness parameters as well as body composition and glycaemic and lipid profiles in adults with excess body weight when compared to a low-energy high-glycaemic load (HGL) diet.
Methods
This is a randomised, parallel-group RCT of a dietary intervention with a low-energy diet with different GLs. This research project was approved by the Research Ethics Committee at Instituto de Cardiologia do Rio Grande do Sul/Fundação Universitária de Cardiologia (IC-FUC) (ID 5544–18) and registered on ClinicalTrials.gov (https://clinicaltrials.gov/; ID NCT03918005). The study followed the principles of the Declaration of Helsinki. All participants read and signed a free informed consent form to participate in the study. This article complies with the CONSORT requirements(Reference Schulz, Altman and Moher16).
The primary outcome of this study is arterial stiffness assessed by PWV and augmentation index corrected for a heart rate of 75 bpm (Aix@75). Secondary outcomes include central and peripheral BP, body composition (body mass, BMI, body fat (fat mass, fat-free mass and the sum of skinfolds)), fasting glucose, insulin, glycated haemoglobin (HbA1c) and lipid profile (total cholesterol, non-HDL, HDL and TAG).
Study participants
Recruitment involved screening of potential participants at the study site and via social media platforms including Facebook and Instagram. Potential study volunteers approached the study team by phone, WhatsApp or e-mail for pre-assessment of inclusion and exclusion criteria. If they met all criteria and agreed to participate, they were asked to attend a first visit for all assessments.
The study sample comprised male and female volunteers aged 20–59 years with excess body weight (BMI ≥ 25·0 kg/m2)(17) who were physically inactive (< 150 min/week or < 600 MET min/week) assessed by the International Physical Activity Questionnaire – Short Form (http://www.ipaq.ki.se/). There were excluded individuals with prior diagnosis of diabetes mellitus (type 1 or 2), systemic arterial hypertension and gastrointestinal, pancreatic, hepatic, renal and thyroid conditions; use of medications and/or food supplements; pregnancy or lactation in the last six months; cardiovascular events in the last six months; past history of bariatric surgery; smoking(18) or alcohol abuse(19) and concomitant participation in other intervention studies.
Sample size
The sample size was calculated using WinPepi, version 11·65, based on 5 % alpha level, 90 % beta level and two-sided hypothesis. The expected difference in PWV between both intervention groups was 1·5 ± 2·0 m/s based on data available from the study by Kasliwal et al. (Reference Kasliwal, Bansal and Mehrotra20). The total number of participants was seventy-six (thirty-eight per intervention group). The sample was increased by 10 % to compensate for potential losses and refusals, totaling eighty-four participants.
Randomisation and blinding
The study participants were assigned to two different intervention groups: a low-energy high-glycaemic load diet (HGL, n 42; thirty-nine women and three men) or a low-energy low-glycaemic load diet (LGL, n 43; thirty-seven women and six men). Randomisation for the proposed interventions was performed using a computer-generated random list (www.randomization.org) with 1:1 coded distribution using random block sizes of two for forty-two allocations. Allocation concealment was assured by enclosing a randomisation list in opaque, sealed envelopes stored in a secure place so that assignments would not be known beforehand. A blinded investigator prepared the allocation sequence of random numbers after participant selection according to eligibility criteria. The sequence of numbers used for randomisation was kept confidential up to the start of the intervention.
A nutritionist (LP) from the research team was not blinded to the intervention allocation. In order to minimise bias, we used a similar intervention strategy for both groups (low-energy diet with the same macronutrient composition). The terms ‘glycaemic index’ and ‘glycaemic load’ were not mentioned during any study visit or in any written material handed out to the volunteers, but the different strategies were colour-coded (HGL = blue; LGL = red). The participants were explained that the study was designed to compare two weight loss diets with different ‘types of carbohydrates’.
The evaluators carrying out arterial stiffness assessment, (central and peripheral) BP measurements, biochemical tests and bioimpedance were blinded to the intervention groups. A nonblinded nutritionist (LP) performed anthropometric measurements and physical activity assessment. A blinded independent evaluator calculated total energy intake from 24-hour dietary recalls (24HR). Finally, the data analysis team worked with data marked as ‘blue diet’ or ‘red diet’.
Study assessments
We collected, in the following order, blood samples for biochemical tests, and obtained BP, arterial stiffness and anthropometric measurements and bioimpedance data 24 h before day 1 of intervention and 24 h after the end of the intervention. All collections were scheduled for 8 a.m. Volunteers were strongly advised to fast for 12 h (including drinks such as black coffee and teas) and not to consume alcohol and refrain from any physical exercise 24 h before the scheduled visit. Total evaluation time was 2 hours and included all assessments, questions and inclusion in WhatsApp and email groups. Volunteers were offered a snack (sandwich or cereal bar and orange juice) at the end of this visit.
Biochemical tests
Blood collections and biochemical analyses were undertaken at the study hospital (Instituto de Cardiologia) clinical laboratory service by skilled personnel. Blood analyses (lipid profile, blood glucose, insulin and HbA1c) were run as part of the laboratory’s routine work flow. All test results were sent to the research team in a report signed by a biomedical laboratory officer.
Briefly, blood samples were collected after 12-hour fasting pre- and post-intervention. TAG, total cholesterol and HDL levels were determined by an enzymatic colorimetric method. LDL and very VLDL cholesterol levels were calculated using Friedewald equation(Reference Friedewald, Levy and Fredrickson21). Non-HDL cholesterol levels were calculated by the difference between total cholesterol and HDL-cholesterol. Glucose levels were measured using an automated enzymatic method and insulin levels were measured by electrochemiluminescence. HbA1c levels were measured using high-performance liquid chromatography.
Insulin resistance was quantified using the homoeostasis model assessment for insulin resistance with HOMA2 Calculator (http://www.dtu.ox.ac.UK/homacalculator/)(Reference Wallace, Levy and Matthews22).
Blood pressure and arterial stiffness
The volunteers were instructed to empty their bladder before this assessment. They were allowed to rest in a quiet environment at the study site for 5 min. They were then explained the procedure and asked to keep quiet. The right mid-upper arm circumference was measured for choosing the appropriate cuff size. Central and peripheral BP and arterial stiffness parameters were assessed by an oscillometric method (Mobil-O-Graph 24hPWA Monitor device (IEM, Stolberg, Germany) using the device’s ARC Solver algorithm (Austrian Institute of Technology, Vienna, Austria)(Reference Jones, Taylor and Chowienczyk23–Reference Paiva, Mota-Gomes and Brandao27).
Heart rate (HR), pulse pressure amplification, central and peripheral systolic blood pressure and diastolic blood pressure, mean blood pressure and pulse pressure were measured. Arterial stiffness was assessed by determining pulse wave velocity (PWV), AIx corrected for a heart rate of 75 bpm (Aix@75), reflection coefficient and augmentation pressure. Stroke volume, cardiac output, total vascular resistance and cardiac index were also determined.
Anthropometric assessment
A skilled evaluator certified as International Society for the Advancement of Kineanthropometry level 1 conducted all anthropometric assessments. All measures were taken in triplicate; we used the mean value of triplicate measures.
Body mass was assessed by a digital electronic scale (Welmy W200) with an accuracy of 100 g and maximum measuring capacity of 200 kg. Height measures were taken using a vertical stadiometer attached to the scale with an accuracy of 0·1 cm and maximum measuring capacity of 2 m. All measurements were taken with the volunteers in an upright position, barefoot and in light clothing as recommended(17).
We measured waist circumference using a stretch-resistant tape (Cescorf) at the midpoint between the lower margin of the least palpable rib and the top of the iliac crest at the midaxillary line at the end of a normal expiration as recommended by the WHO(17).
Skinfold measurements were taken with a medical skinfold caliper (Innovare 4, Cescorf) following the International Society for the Advancement of Kineanthropometry protocol(Reference Olds, Carter and Marfell-Jones28). We collected data from a total of six skinfolds (triceps, subscapular, supraspinatus, abdominal, middle thigh and calf) and then calculated the sum.
Bioimpedance
Body fat (percent, %; and absolute, kg) and lean mass (kg) were estimated using a tetrapolar bioimpedance analyser (Biodynamics 310E, Biodynamics Corporation, Seattle, USA) according to the European Society for Clinical Nutrition and Metabolism (ESPEN) recommendations(Reference Kyle, Bosaeus and De Lorenzo29).
24-Hour dietary recall
The study nutritionists assessed food intake using the multiple pass 24-hour dietary recall (24HR) technique(Reference Conway, Ingwersen and Vinyard30) to better understand their meal patterns. These assessments were carried out in person at baseline and at the end of the study.
Intervention: low-energy diet with either low or high glycaemic load
The participants were randomly assigned to two intervention groups: a low-energy LGL diet or a low-energy HGL diet. The intervention lasted 45 d (∼6·5 week).
The prescribed dietary contents were calculated based on the method of macronutrient equivalents(31) and daily glycaemic load using food composition tables(Reference Atkinson, Foster-Powell and Brand-Miller9,Reference Foster-Powell, Holt and Brand-Miller10) . Both HGL and LGL diets had the same energy contents and macronutrient composition (55 % carbohydrates, 20 % proteins and 25 % lipids), but different GL (Table 1). We estimated GI of foods and daily GL(Reference Atkinson, Foster-Powell and Brand-Miller9,Reference Foster-Powell, Holt and Brand-Miller10) from the FAO/WHO protocol(32) in Microsoft Excel 2018. There are no recommended values for classifying daily GI and no reference for classifying GI and GL of specific meals. Therefore, daily GL was considered ‘low’ when < 80 g and ‘high’ when > 120 g(Reference Brandão, Amodeo and Alcântara8). There were four dietary options with different total energy values (TEV) for HGL and LGL: 1400 (TEV I), 1600 (TEV II), 1800 (TEV III) and 2000 (TEV IV) kcal/d (Table 2).
Table 1. Base food items in low-energy diets with either high glycaemic load (HGL) or low glycaemic load (LGL)

The prescribed diets were calculated by macronutrient equivalents (carbohydrates, proteins and lipids)(31) and daily glycaemic load(Reference Atkinson, Foster-Powell and Brand-Miller9,Reference Foster-Powell, Holt and Brand-Miller10) .
Table 2. Planned nutritional composition of a low-energy diet with either high glycaemic load (HGL) or low glycaemic load (LGL)
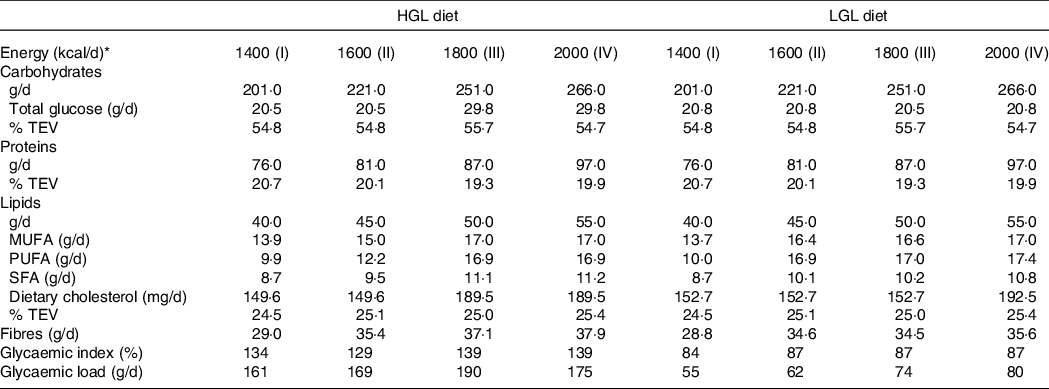
The prescribed diets were calculated by macronutrient equivalents (carbohydrates, proteins and lipids)(31). The GI of foods was classified as being low (≤ 55 %), medium (56–69 %) and high (≥ 70 %) relative to glucose(Reference Atkinson, Foster-Powell and Brand-Miller9,Reference Foster-Powell, Holt and Brand-Miller10) . Daily GL were estimated from the FAO/WHO protocol and manually calculated from GI and amount of carbohydrate of individual food items(32). Daily GL was considered ‘low or high’ when < 80 g or > 120 g, respectively(Reference Brandão, Amodeo and Alcântara8).
* Diets were developed and classified into four levels of total energy value (TEV): 1400 (TEV I), 1600 (TEV II), 1800 (TEV III) and 2000 (TEV IV) kcal/d.
We calculated basal energy expenditure using the FAO/WHO/UNU equation (1985)(33) multiplied by an activity factor(Reference Ainsworth, Haskell and Whitt34) for total energy expenditure. We also considered an energy deficit of 500–1000 kcal/d from total energy expenditure as described in the literature(31). Thus, energy deficit (kcal/d) was defined as the greatest energy deficit between 500 and 1000 kcal above basal energy expenditure for dietary plans (kcal/d) TEV I, TEV II, TEV III and TEV IV. Projected energy deficits were calculated to all participants from their estimated daily energy requirements (Table 3, ‘Prescribed Nutritional Composition’).
Table 3. Prescribed nutritional composition and dietary intake from 24-hour food recalls (24HRs) of a low-energy diet with either high glycaemic load (HGL) or low glycaemic load (LGL)
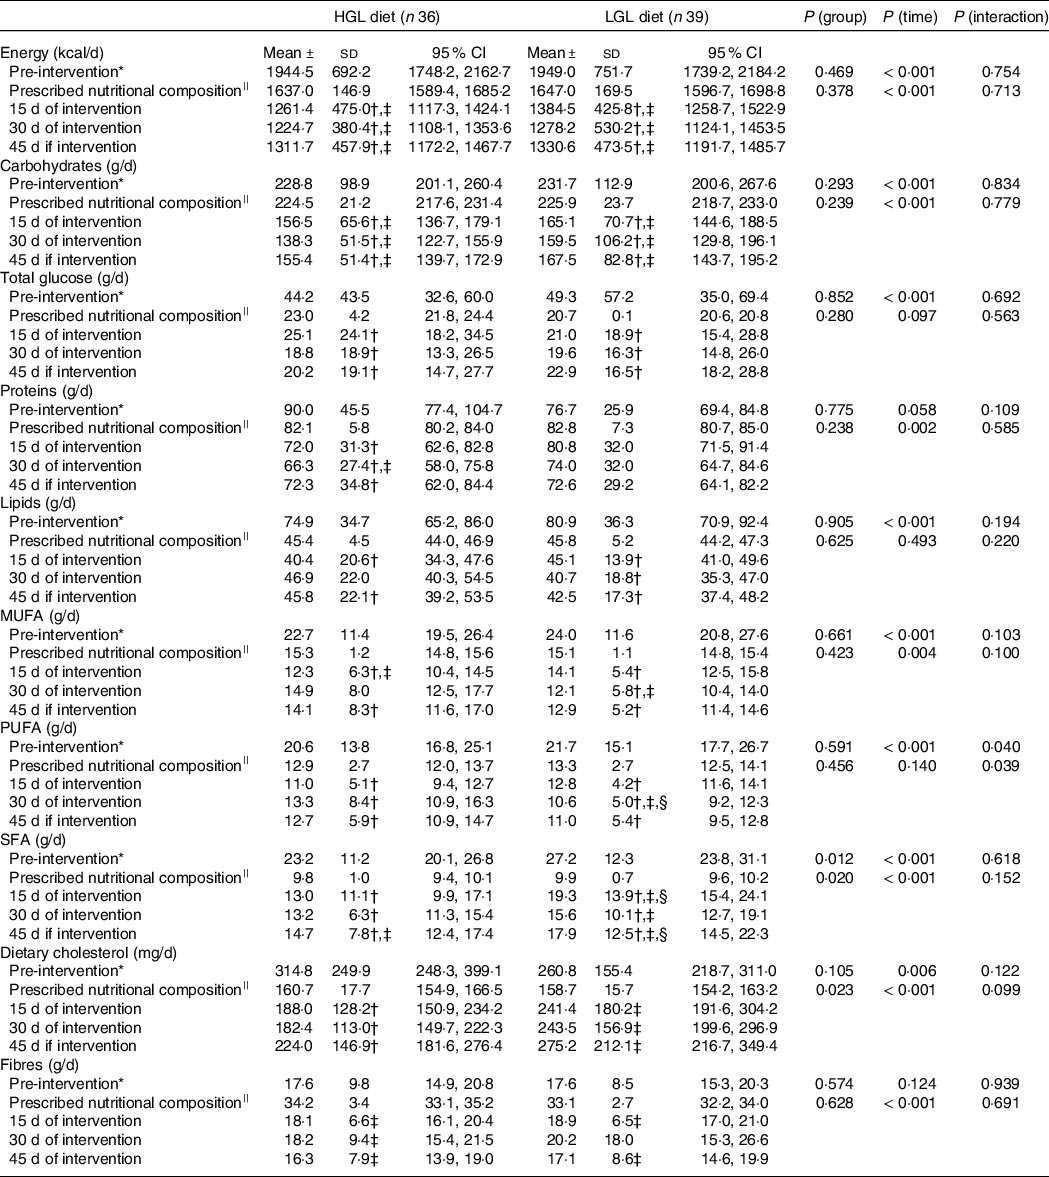
* Comparison among pre-intervention (baseline) v. 15, 30 and 45 d of intervention. Potential differences were tested by generalised estimating equations (GEE) followed by Bonferroni multiple comparisons.
† P < 0·05 v. pre-intervention (baseline) at same group.
‡ P < 0.05 v. prescribed nutritional composition in the same group.
§ P < 0·05 HGL group at same time.
||Prescribed values in food plans for assessing dietary compliance (prescribed .v. actual intake at 15, 30 and 45 d of intervention). There were no differences in prescribed values between the groups. Potential differences over time (prescribed nutritional composition .v. at 15, 30 and 45 d of intervention) were tested by generalised estimating equations (GEE) followed by Bonferroni multiple comparisons.
The research team nutritionists created meal plans consisting of base food items according to equivalent values of macronutrients and estimated GL (Table 1 and Table 2) as well as guidance on factors affecting daily dietary GL (Chart S1, online Supplementary Material – new file). Meal plans and any other information were presented in person to each participant on day 1 after the assessments (blood collections, BP, arterial stiffness and anthropometric measurements, bioimpedance data and 24HR). The participants in both dietary groups were also advised to reduce Na, caffeine and alcohol intake (without amount restrictions).
In addition to individual face-to-face visits at baseline and at the end of the study, all participants were individually followed up via phone calls or WhatsApp as needed to increase protocol compliance. We also used this same approach to assess 24HRs through phone calls on days 15 and 30 to improve diet adherence and follow-up. We did not assess 24HRs on atypical days (weekends or holidays).
Dietary intake of macronutrients and micronutrients was determined using Dietbox (https://dietbox.me/). Nutrient intake from 24HRs was also determined using Dietbox. We assessed total energy, carbohydrates, proteins, lipids, fibres, total glucose, dietary cholesterol and saturated, MUFA and PUFA.
Statistical analysis
We tested data normality using the Shapiro–Wilk test. Data were presented as mean ± standard deviation (sd) and/or 95 % confidence intervals (95 % CI). The generalised estimating equation (GEE) method was applied to test for differences between the two diet interventions (group) over time using two factors (group and time) as well as the interaction between them (group × time). The Bonferroni test was used for multiple comparisons when applicable. Baseline comparisons between both groups were tested using Student’s t test for independent samples or Pearson’s chi-square test. All statistical analyses were performed using Statistical Package for the Social Sciences v20·0 for Windows (SPSS Inc.). A significance level of 5 % (P < 0·05) was set for all statistical tests.
Results
This study was carried out at IC-FUC clinical research laboratory from April to December 2019. After an initial screening, 158 volunteers were selected. Seventy-three were considered ineligible based on the inclusion criteria. There were included eighty-five participants, but ten did not complete the study (HGL = 6 and LGL = 4). Thus, the final sample consisted of seventy-five volunteers (Fig. 1).

Fig. 1. Flow chart of the study design.
Baseline characteristics
The female to male ratio was similar in both intervention groups (HGL: 39/3 and LGL: 37/6; P = 0·308). They were also similar in age (HGL: 34·3 ± 10·6 and LGL: 37·7 ± 10·8 years old; P = 0·154), and physical and clinical characteristics, except for insulin levels (Δ −2·6 µU/ml; P = 0·012) and homoeostasis model assessment for insulin resistance (Δ −0·5; P = 0·005) being lower in LGL than HGL group.
All participants reported low levels of physical activity with no difference between the groups (HGL 252·8 ± 309·5 and LGL 232·1 ± 279·0 MET-min/week; P = 0·526).
Dietary compliance
Table 3 shows dietary compliance, i.e. total amount of food consumed from 24HRs compared with prescribed dietary plans. Interestingly, both groups consumed less than prescribed in total energy content (kcal/d; HGL: −22 %, P < 0·001; LGL: −19 %, P = 0·001), carbohydrates (g/d, HGL: −33 %, P < 0·001; LGL: −27 %, P < 0·001) and fibre (g/d, HGL: −49 %, P < 0·001; LGL: −43 %, P < 0·001), but without any difference between them. Saturated fat intake was higher than prescribed in both groups (g/d; HGL: 30 % and LGL: 78 %; P < 0·001) and higher in the LGL compared with the HGL group (Table 3). Despite that, fat intake was reduced by 41 % from baseline (pre-intervention) in the HGL and by 35 % in the LGL group; i.e. their intake was higher than prescribed, but lower than their usual intake (Table 3).
Briefly, of ten food items in the dietary plan (total energy in kcal, carbohydrates, proteins, total lipids, total sugars, monounsaturated fat, polyunsaturated fat, saturated fat, dietary cholesterol and fibres), six (proteins, total lipids, total glucose, MUFA, PUFA and dietary cholesterol) were associated with good compliance with prescribed dietary plans in both groups. Total energy intake (kcal), carbohydrate intake and fibre intake were lower than expected, and saturated fat intake was higher than expected in both groups.
Cardiovascular parameters – primary outcome
Regarding cardiovascular parameters (Table 4), HR was lower in the HGL group (Δ −3·6 bpm, P = 0·024) post-intervention compared with baseline. Stroke volume reduced over time in the LGL group (Δ −2·9, P = 0·031), but not in the HGL group. And there was no significant change in PWV (P = 0·690) or AIx@75 (P = 0·083) in both groups post-intervention. However, the reflection coefficient was lower in the LGL group (Δ −2·9 %; P = 0·003) when compared with the HGL groups in response to the dietary intervention.
Table 4. Central and peripheral blood pressure, haemodynamic parameters and arterial stiffness at baseline and post-intervention with a low-energy diet with either high glycaemic load (HGL) or low glycaemic load (LGL)
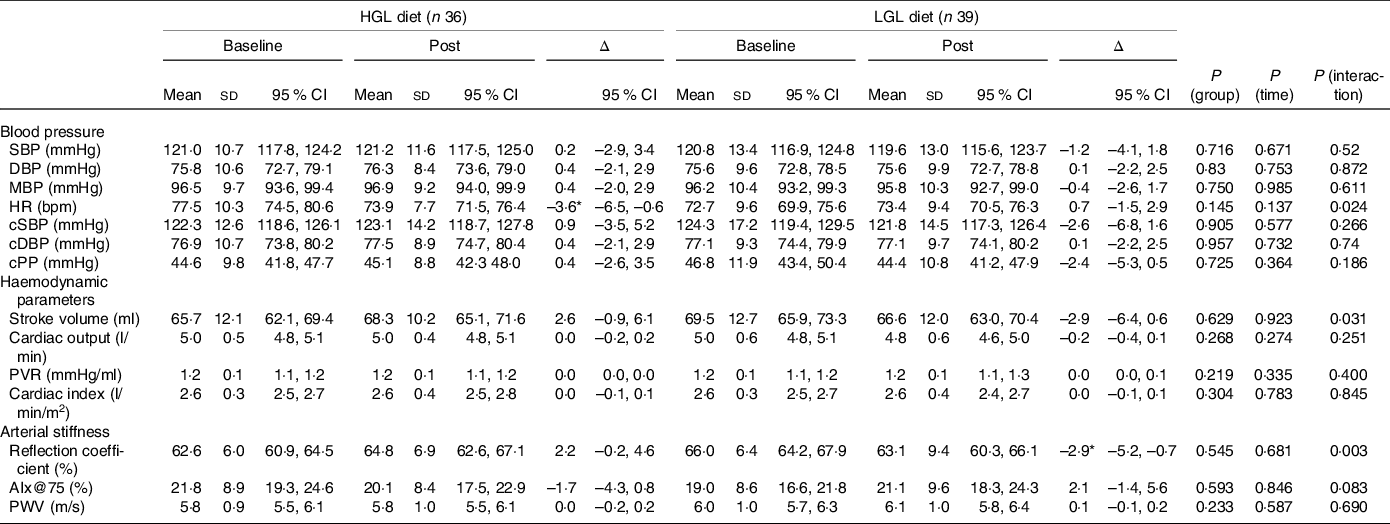
SBP, systolic blood pressure (peripheral); DBP, diastolic blood pressure (peripheral); MBP, mean blood pressure; HR, heart rate; cSBP, central systolic blood pressure; cDBP, central diastolic blood pressure; cPP, central pulse pressure; PVR, peripheral vascular resistance; Aix@75: augmentation index corrected for a heart rate of 75 bpm; PWV: pulse wave velocity. All values are presented as means ± sd and (95 % CI). Differences were tested by generalised estimating equations (GEE) followed by Bonferroni multiple comparisons.
* P < 0·05 for post-intervention v. baseline.
Body composition, glucose and lipid profile – secondary outcomes
As for body composition (Table 5), body mass was reduced (Δ −3·0 kg, P = 0·026) in the LGL group to a greater extent than in the HGL group. The intra-group analysis (baseline v. post-intervention) showed a reduction in body weight only in the LGL group (Δ −4·9 kg, P = 0·001) that was associated with lower fat mass (Δ −3·2 kg, P = 0·004), lower lean mass (Δ −2·0 kg, P = 0·001), reduced waist circumference (Δ −3·1 cm, P < 0·001), as well as reduced sum of six skinfolds (Δ −14·5 mm, P < 0·001). But any of these changes was not seen in the HGL group. Together, these changes in body composition led to reduced BMI in the LGL group (Δ −1·6 kg/m2, P < 0·001), but without significance difference and having no clinical relevance compared with the HGL group (Table 5).
Table 5. Body composition, blood glucose, insulin levels and lipid profile at baseline and post-intervention (45 d) with a low-energy diet with either High Glycaemic Load (HGL) or Low Glycaemic Load (LGL)
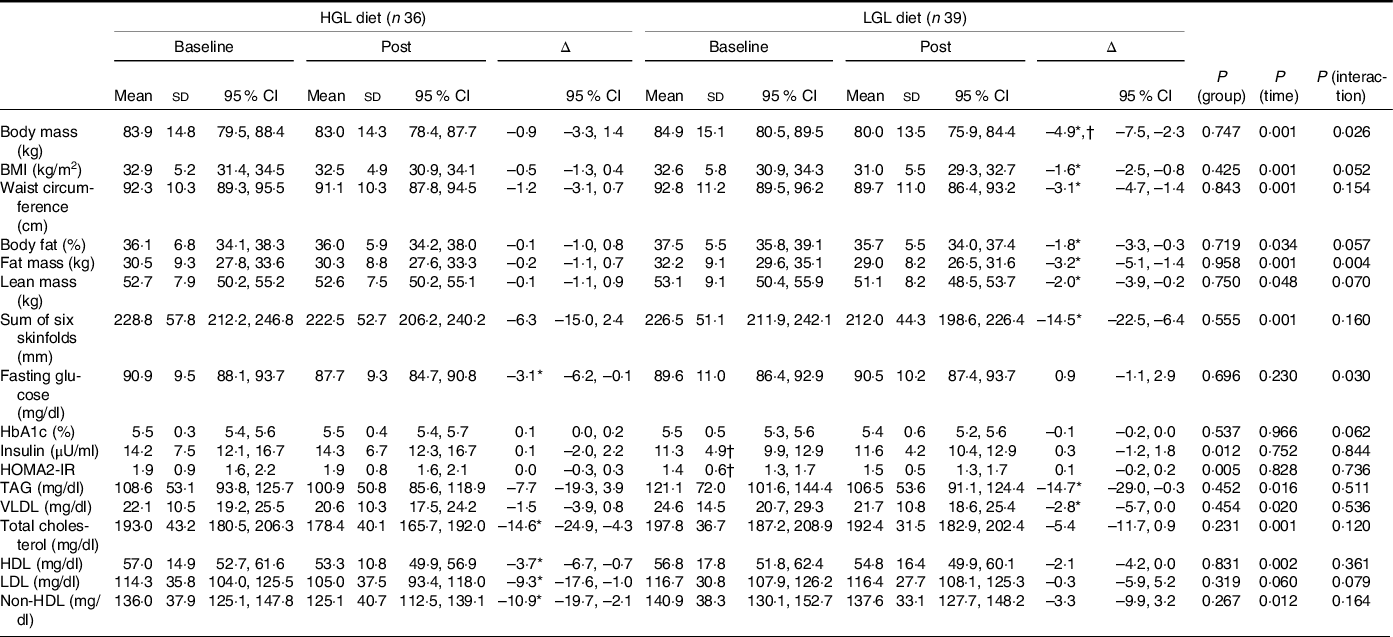
non-HDL: non-high density lipoprotein; HbA1C: glycated haemoglobin; HOMA2-IR: homeostasis assessment model for insulin resistance. All values are presented as means ± sd and (95 % CI). Differences were tested by generalised estimating equations (GEE) followed by Bonferroni multiple comparisons.
* P < 0·05 for post-intervention v. baseline.
† P < 0·05 v. group at same time.
Interestingly, as for the lipid profile, a slight decrease in fasting glucose was seen in the HGL group (Δ −3·1 mg/dl, P = 0·030), but not in the LGL group (Table 5). However, it was not enough to change the homoeostasis model assessment for insulin resistance index, likely because insulin levels remained unchanged over time (45 d). And, as expected, there were no significant changes in HbA1c levels, possibly because of intervention duration (45 d) was not long enough to significantly change this parameter.
All parameters in the lipid profile were reduced over time, except LDL (Table 5), in both groups. However, the intragroup analysis showed reduced levels of TAG (Δ −14·7 mg/dl, P = 0·019) and VLDL (Δ −2·8 mg/dl, P = 0·025) in the LGL group. In turn, there was a significant reduction in total cholesterol (Δ −14·6 mg/dl, P = 0·011), LDL (Δ −9·3 mg/dl, P = 0·046) and non-HDL levels (Δ −10·9 mg/dl, P = 0·025) in the HGL group despite a reduction in HDL (Δ −3·7 mg/dl, P = 0·002) (Table 5).
Discussion
The main finding of the present study is that both low-energy diets – either HGL or LGL – showed no effects on PWV and AIx@75 over a 45-day follow-up. Yet the nutritional strategy of low-energy LGL diet was associated with a lower reflection coefficient. The low-energy LGL diet effectively reduced body mass and fat mass, but this same effect was not seen with the HGL diet. The analysis by individual groups showed that the LGL diet was effective in promoting positive changes in body composition and TAG, while the HGL diet showed a beneficial effect in reducing total cholesterol, LDL and non-HDL. Thus, we partially accept our hypothesis that a low-energy LGL diet would improve arterial stiffness parameters as well as secondary outcomes (body composition and glycaemic and lipid profiles). It should be noted that compliance with a prescribed dietary plan is a key aspect. Intake was lower than expected in terms of total amount of energy (kcal/d), carbohydrates and fibers, but without any differences between the groups. It is thus very unlikely that variations in the prescribed dietary plans had any influence on the outcomes assessed in both groups.
Arterial stiffening significantly increases the incident pressure wave (from central arteries into the peripheral circulation) generated in the aorta and tends to reduce the reflection coefficient(Reference London, Pannier and Safar35). The incident pressure wave is affected not only by arterial stiffness and stiffness gradient but also stroke volume and left ventricular ejection-related variables including HR(Reference London, Pannier and Safar35). Body shape and height can also influence the magnitude and timing of reflection waves as well as vascular impedance and HR patterns(Reference London, Pannier and Safar35–Reference O’ Rourke and Taylor37). Our results are consistent with these reports and points to a relationship between weight loss (reduction in body weight and fat mass) and the reflection coefficient.
Interestingly, the HGL diet reduced fasting glucose. Although there was no reduction in body weight and the glycaemic load was higher (HGL v. LGL), there was a reduction in the amount of energy consumed as well as in the amount of carbohydrates with the implementation of the diet, compared with what the participants had been ingesting before. This fact may have been the reason for the reduction in fasting blood glucose. However, HGL showed no significant effect on PWV and Aix@75. One study(Reference Cooper, Buchanich and Youk38) demonstrated that a 6·4 % loss of body weight over a 12-month period was not associated with changes in brachial-ankle PWV (−2·6 cm/s, P = 0·830). A meta-analysis(Reference Vlachopoulos, Aznaouridis and O’Rourke39) showed that the relative risk of overall cardiovascular events was 1·318 (95 % CI 1·093, 1·588) for a 10 % absolute increase of AIx, corresponding to a risk increase of 31·8 %. The reduction in AIx@75 with the HGL diet, though small, can lead to reduced cardiovascular risk among the participants of our study. Studies have shown that acute dietary interventions can improve PWV in healthy young adults(Reference Zurbau, Jenkins and Jovanovski15,Reference Sanchez-Aguadero, Patino-Alonso and Mora-Simon40) . A meta-analysis including twenty studies (totaling 1259 participants)(Reference Petersen, Blanch and Keogh41) and some other studies(Reference Syed-Abdul, Hu and Jacome-Sosa42–Reference Philippou, Bovill-Taylor and Rajkumar44) (duration of 4 weeks to 6 months; mean duration of 11·6 weeks) found improved PWV, though they did not assess Aix@75. Therefore, the results for this artery segment cannot be extrapolated to other segments of the same arterial tree. A direct comparison with our results is not possible because of different study characteristics (design, follow-up duration and varying degrees of obesity among participants). In their meta-analysis, Petersen et al. (Reference Petersen, Blanch and Keogh41) examined twenty studies (totaling 1259 participants) and found that a small reduction in body weight (8 % of baseline weight) reduced PWV by −0·32 (standardised mean difference). However, their analysis had some limitations including low quality of the studies (only three studies were RCT) and non-reporting of randomisation procedures and blinding. In addition, there was strong evidence of publication bias.
Syed-Abdul et al. (Reference Syed-Abdul, Hu and Jacome-Sosa42) were the first to demonstrate that weight loss improved carotid-femoral PWV as early as 4 weeks and that a carbohydrate-restricted diet (energy deficit of 645 kcal/d) can be an effective approach to reduce arterial stiffness in women. All overweight participants, irrespective of gender, showed a reduction in PWV by nearly 6 % associated with a 5 % reduction in body weight along with significant reductions in TAG (34 %), plasma insulin (34 %) and BP (6–8 %). Our results showed a energy deficit (618 kcal) and similar body weight reduction (5·8 %) and a major reduction in TAG (12·1 %) in the LGL group, though no reductions in PWV. Thus, since the reduction in body weight was similar between groups, only LGL group showed a marked reduction in TAG and in the reflection coefficient, the hypothesis that triglyceride reduction is more associated with reductions in PWV (by reflection coefficient) than weight loss should be better investigated in future studies.
Although the study by Nordstrand et al. (Reference Nordstrand, Gjevestad and Hertel43) used moderate energy restriction (1000 kcal/d) combined with moderate-to high-intensity aerobic exercise (4–8 METs) and our study only dietary intervention, an analysis of the results deserves attention. The authors found a reduction in arterial stiffness (–0·6 m/s) in individuals with morbid obesity after a 7-week intervention. A low-energy diet (< 900 kcal/d) was shown to have no effect on arterial stiffness (–0·2 m/s). Even after adjusting for age, gender, baseline BP, baseline BMI, history of coronary artery disease, and baseline PWV, PWV reduction was greater in those with moderate energy restriction (1000 kcal/d) than those on a low-energy diet of < 900 kcal/d. Given the significant benefits reported in this study, further research combining diet therapy with other physical exercise modalities are needed.
Philippou et al. (Reference Philippou, Bovill-Taylor and Rajkumar44) evaluated 38 men aged 35–65 years with at least one risk factor for coronary artery disease and found no superior efficacy of a LGL diet compared with HGL diets on PWV after a 6-month intervention. They also reported a reduction in anthropometric parameters in each group over time, but with no significant difference between them. Our results suggest that PWV is apparently a less sensitive marker of short-term changes, but a change in the reflection coefficient is more likely to occur.
Our study found that the LGL diet intervention led to reductions from baseline in several anthropometric parameters, including body mass, BMI, waist circumference, fat mass, lean mass and skinfolds, in addition to TAG and VLDL. In this scenario, reduced lean body mass can be regarded as an undesirable adaptation. However, this ‘side effect’ is quite common in weight reduction programs based on energy restriction due to a negative energy balance state(Reference Murphy and Koehler45,Reference Roth, Schoenfeld and Behringer46) . To minimise this effect, one alternative is to include strength exercise as an adjuvant to energy restriction(Reference Murphy and Koehler45–Reference Weiss, Jordan and Frese47). Weight loss can increase triglyceride clearance and thus lead to a reduction in triglyceride levels(Reference MacLean, Higgins and Giles48). A systematic review of RCTs(Reference Gastrich, Lasser and Wien49) demonstrated that LGL diet may have an important role in reducing triglyceride levels, which is consistent with our finding. Low-to-moderate carbohydrate Mediterranean diets and low-fat diets has also been shown to reduce triglyceride levels(Reference Vincent-Baudry, Defoort and Gerber50). And unlike Mediterranean diets, low GI-GL diets are not based on traditional foods mostly found in Mediterranean countries and, as seen with the diet intervention in our study, they may contain a wider selection of foods with low GL and are appropriate for various environments(Reference Drewnowski and Eichelsdoerfer51).
Intentional weight loss in adults with obesity can be associated with a 15 % reduction of all-cause mortality (RR 0·85; 95 % CI 0·73, 1·00)(Reference Kritchevsky, Beavers and Miller52). Weight loss diets that are usually low in fat, particularly saturated fat, combined or not with dietary counseling and exercise, may also be associated with a reduction of premature all-cause mortality in this population (RR 0·82; 95 % CI 0·71, 0·95)(Reference Ma, Avenell and Bolland53).
In our study, the HGL diet intervention demonstrated improvements from baseline in total cholesterol and LDL, and non-HDL cholesterol despite a reduction in HDL. One study(Reference Shikany, Phadke and Redden54) concluded that reductions found in total cholesterol, LDL, and HDL with a high GL diet could be due to slight differences in the fatty acid profile of the diet compared to that of a low GL load. This may also partially explain our findings, considering that HGL ingested less saturated fatty acids compared to LGL. A reduction in HDL cholesterol— a negative health effect—can be in part explained by energy restriction. A multicenter study(Reference Malachias55) investigated an 8-week energy restriction intervention (810 kcal/d) and found a reduction in body weight associated with an average HDL cholesterol decrease of 4·6 mg/dl. A plausible explanation for these findings in that study as well as in ours is lower fat intake as fatty acids are substrates for HDL cholesterol particles.
One further aspect is assessing dietary compliance with the prescribed plans as well as comparing the prescribed dietary plans with participants’ baseline dietary intake. Saturated fat intake was higher than expected in the HGL group despite a 41 % reduction from baseline in this group and 35 % reduction in the LGL group. As for the amount of saturated fat restricted in the dietary plan, intake was 30 % and 78 % higher than expected in the HGL and LGL groups, respectively. Non-compliance with fat restrictions in the dietary plan may have contributed to unchanged levels of lipid parameters in the LGL group. On the other hand, a change in the type of carbohydrate in the dietary plan may in part explain reduced triglyceride levels seen only in the LGL group.
Our study has strengths and some limitations. The main strengths include an adequate sample size for a diet intervention, rigorous randomisation and blinding and intervention standardisation. Yet there are some limitations. First, a longer intervention duration would have allowed various follow-up time points. However, the choice for a shorter intervention duration positively affected the dropout rate during follow-up (11·8 %) (Fig. 1). A higher proportion of the participants were women despite randomisation and open call for volunteers. A possible explanation is that women are more likely to participate in research studies involving low-energy diets. In addition, a retrospective quantitative assessment of food intake through the 24HR relies on the participants’ recall and their food intake may be atypical. But the 24HR is a valid instrument and provides a good estimate of food intake. Since a single food recall cannot give an adequate estimate of the usual diet, we collected 24HR data every 15 d throughout the study. To avoid potential errors due to overestimation or underestimation of food intake, we followed the multiple-pass 24-hour recall(Reference Conway, Ingwersen and Vinyard30). We also found it difficult to estimate added salt in foods as most participants did not usually measure the amount of salt added, though moderate salt intake was recommended at the beginning of the study(Reference Malachias55). Dietary sodium intake can interfere with BP and arterial stiffness(Reference Grillo, Salvi and Coruzzi56). It is noteworthy that the glycaemic index alone is not considered ‘low’ in the LGL group. However, they are classified as low GL based on the amount of carbohydrate of food items in the dietary plan for this group (main characteristics of the intervention and cutoffs for the groups). In clinical practice, however, prescribing a dietary plan containing only low GI food items may result in low dietary compliance because they are mostly less palatable. Although this is not a study limitation , evaluating strict low-GI diets if appropriate could provide further evidence to support our results. Finally, there was a change in macronutrient intake with the dietary intervention, in particular the amount and type of carbohydrate. A qualitative and quantitative analysis of satiety (not assessed in this study) could provide interesting insights on the applicability of these dietary approaches in the long run.
We conclude that a 45-day diet intervention with either HGL or LGL in adults with excess weight did not show improvements in arterial stiffness parameters as pulse wave velocity and augmentation index. However, the LGL diet intervention had a positive impact on the reflection coefficient, another arterial stiffness parameter. As for body composition, the LGL diet intervention effectively reduced body weight and fat mass when compared to the HGL diet. A baseline comparison showed that the LGL diet was effective in reducing all body composition parameters as well as triglyceride levels, but the same was not seen with the HGL diet. In contrast, the HGL diet was more likely associated with changes in the lipid profile, although the group reduced the consumption of saturated fatty acids. Together, our findings indicate that diets with different GLs may have varying effects on cardiovascular risk parameters such as body composition, lipid profile and BP, over a short period of time.
Supplementary material
For supplementary material/s referred to in this article, please visit https://doi.org/10.1017/S0007114523001022
Acknowledgements
This research received no specific grant from any funding agency, commercial or not-for-profit sectors.
The authors declare that there are no conflicts of interest.


