Ulcerative colitis (UC), Crohn’s disease and inflammatory bowel disease unclassified (IBD-U) are all under the category of IBD(Reference Satsangi, Silverberg and Vermeire1). Inflammation of the colon’s inner lining and other internal organs is a recurring illness known as UC(Reference Yamamoto-Furusho2,Reference Peyrin-Biroulet, Panés and Sandborn3) . Epidemiological investigations have revealed a noteworthy rise in the occurrence of UC globally(Reference Sung and Park4). The prevalence of UC has surged from 3·7 million in 1990 to a staggering 6·8 million in 2017(Reference Ng, Shi and Hamidi5). The aetiology of this disease has not yet been understood; however, environmental elements like the type of dietary pattern plays a role in influencing the immune reaction to bacterial components in individuals who have a genetic predisposition(Reference Xu, Chen and Ma6,Reference Rashvand, Behrooz and Samsamikor7) .
Dietary intakes play a crucial role in maintaining equilibrium within the gastrointestinal tract, influencing both the structure and function of the microbiota(Reference David, Maurice and Carmody8–Reference Rahmani, Kord-Varkaneh and Hekmatdoost11). A growing body of evidence suggests that IBD is linked to specific dietary patterns, as well as the intake of micro- and macronutrients, along with certain food items(Reference Durchschein, Petritsch and Hammer12). Diet is considered as a potential environmental factor implicated in the origin of IBD(Reference Racine, Carbonnel and Chan13). The rise in IBD occurrence has been linked to a dietary shift from the consumption of substantial amounts of healthy plant-based foods to the adoption of energy-dense foods rich in sugar, animal fat and protein in the Westernised diets(Reference Chiba, Nakane and Komatsu14,Reference Rizzello, Spisni and Giovanardi15) . Moreover, previous studies have shown the association between dietary fermentable oligosaccharides, disaccharides, monosaccharides and polyols and alterations in some IBD symptoms and gut bacterial diversity(Reference Cox, Lindsay and Fromentin16). In addition, a diet characterised by elevated consumption of sweated beverages and soda has been linked to a higher likelihood of UC(Reference Cohen, Lee and Long17).
Although there are few studies evaluating the role of diet in IBD development, the precise dietary patterns affecting symptoms and disease activity have not yet been elucidated(Reference Limketkai, Iheozor-Ejiofor and Gjuladin-Hellon18). Thus, this study is aimed to evaluate the association of dietary patterns with disease severity in patients with UC.
Methods
Study population
The present study was conducted on 340 patients with UC recruited from the Gastroenterology Clinic of Laleh Hospital, Tehran, Iran, using a convenience sampling method. The participants were enrolled between September 2022 and March 2023 and will be followed up for 1 year. A cross-sectional study was conducted using baseline data from an ongoing cohort study. Ethical approval for the present study was obtained from the Ethics Committee of the Shahid Beheshti University of Medical Sciences (No. IR.SBMU.NNFTRI.REC.1401.049). All participants were provided with informed written consent prior to their participation in the current study. Patients with mild or moderately active UC, according to the Simple Clinical Colitis Activity Index(Reference Walmsley, Ayres and Pounder19), or with UC in clinical remission who were aged > 18 years were included in the study. All UC patients were included in the study after being diagnosed by a gastroenterologist and reviewing medical records. Any of the following conditions prevented individuals from participating: patients with gastrointestinal illnesses except UC, cancer, infection, drug addiction, gestation or lactation and recurrence of UC described as Simple Clinical Colitis Activity Index score ≥ 5.
Measurement of ulcerative colitis severity
UC severity was assessed using Simple Clinical Colitis Activity Index, which is a clinical activity indicator that is scored from 0 to 19 and consists of six questions as follows: bowel frequency per day, bowel frequency per night, the urgency of defecation, blood in stool, general well-being and extra-colonic features(Reference Walmsley, Ayres and Pounder19). Based on Simple Clinical Colitis Activity Index, the severity of UC was categorised into three levels (0–2 remission phase, 3–4 mild/moderate disease and ≥ 5 flare-ups).
Dietary intake assessment
Participants were interviewed in-person using a valid and reliable 168-item semi-quantitative FFQ(Reference Mirmiran, Esfahani and Mehrabi20) to investigate their usual food consumption (online Supplementary File 1). After explaining the standard portion size of each food item, participants were asked to report the frequency of intake of each food item given a serving on a daily, weekly, monthly or annual basis, which was then converted to daily intake (in grams) using household measures(Reference Ghaffarpour, Houshiar-Rad and Kianfar21). As the Iranian food composition table is incomplete, both the Iranian(Reference Azar and Sarkisian22) and USDA food composition tables(Reference Moszak, Szulińska and Bogdański23) were applied to calculate daily intakes of micro- and macronutrients.
Other variables assessment
Body weight (in kg to the nearest 100 g) was measured using a calibrated digital scale (Seca, Germany), while participants were unshod and in light clothing. Height (in cm to the nearest 0·5 cm) was measured in a standing position, without shoes and with the heels together by the use of a portable stadiometer. Then, the BMI was calculated by dividing weight (kg) by the square height (square meters). To prevent random observer error, the same qualified examiner performed each person’s anthropometric measurements. Each person completed a general questionnaire to provide information on their age, sex, smoking status, alcohol consumption, age at diagnosis, level of education and marital status. Medical records were reviewed to gather data on the medical histories of participants including diabetes, CVD and hypertension. The presence of each common symptom and complication of UC, including diarrhea, constipation, abdominal pain and anaemia, was checked through a personal interview. Physical activity was evaluated based on the International Physical Activity Questionnaire-Short Form, whose validity and stability have been previously evaluated in our country(Reference Moghaddam, Aghdam and Jafarabadi24). The high-sensitivity C-reactive protein levels were evaluated using an ELISA kit (LDN) that had inter- and intra-assay CV below 7 %. Smoking status was divided into two categories: smokers and non-smokers, which included past smokers and those who never smoked. A person smoking cigarettes or other smoking implements regularly or occasionally was considered as a smoker. Regular drinkers were regarded as alcoholic individuals. Education level was categorised as higher education (with a college education) v. lower education (without a college education). When the physical activity level was < 600 metabolic equivalent task minutes per week, subjects were considered physically inactive(Reference Forde25).
Statistical analysis
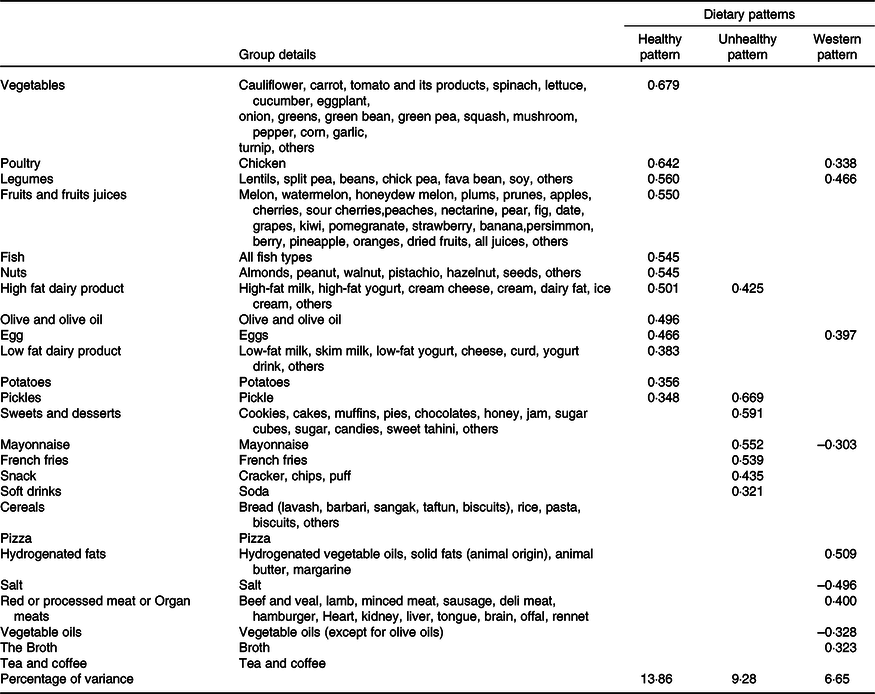
We classified foods listed in the FFQ into twenty-five food categories based on the similarity of nutrient composition in food items (Table 1). To examine the sample size adequacy and data suitability for factor analysis, Kaiser–Meyer–Olkin and Bartlett’s tests were used. As the P value for Bartlett test was <0·001 and the Kaiser–Meyer–Olkin test was over 0·71, the correlation among food groups was strong enough to perform factor analysis. To determine major dietary patterns, principal component analysis with a varimax rotation on twenty-five food groups was conducted. Dietary patterns were selected according to the scree plot test and eigenvalues > 1·5. The factor loading of food group was considered positive if there was a positive association between the food group and the pattern, while negative loading of food group implied negative relationship. Food groups with factor loading values over 0·3 were regarded as strongly related to the extracted pattern and were used to label it. After weighting consumption values according to their factor loadings, they were summed to calculate factor scores for each determined dietary pattern(Reference Hu, Rimm and Smith-Warner26). Subsequently, the tertiles of factor scores were used to classify participants. The Kolmogorov–Smirnov normality test was used to assess distributions of continuous variables for normality, and natural logarithm transformations of skewed variables were applied before analyses. Mean and s d and percentages were used to present quantitative and categorical data, respectively. One-way ANOVA and χ 2 tests were applied to detect differences in quantitative and categorical variables among tertiles of dietary patterns, respectively. ANCOVA was also performed to compare disease severity scores across tertiles of dietary patterns. Multivariable logistic regression analysis demonstrated the association between each dietary pattern adherence and disease severity in UC individuals. For these analyses, the lowest tertiles of different dietary patterns were regarded as the reference category. Three models were developed; model 1 was adjusted for age and energy. Further adjustment for sex, education, physical activity, smoking and alcohol was made in model 2. BMI adjustment was added to the previous adjustments in the model. All statistical analyses were performed using SPSS (SPSS Inc., version 23). A P value < 0·05 was considered statistically significant.
Table 1. Food groups and their loading factors stratified by the type of dietary patterns

Absolute values < 0·30 were not listed in the table for simplicity. Foods or food groups with factor loadings < 0·30 for both factors were excluded.
Results
Of 340 participants, 61·2 % were women, and the mean (sd) age was 35·8 (11·2) and 37 (12·0) years in men and women, respectively. Three dietary patterns explaining 29·79 % of total consumption variance were determined based on the factor analysis (Table 1): a healthy dietary pattern with a percentage of variance of 13·86 % loading heavily on vegetables, fruits and fruit juices, legumes, nuts, fish, poultry, olive, dairy products, eggs and potatoes; an unhealthy dietary pattern with a percentage of variance of 9·28 % positively associated with a high intake of high-fat dairy, sweets and desserts, French fries, snacks, mayonnaise and soft drinks and a Western dietary patterns having the least percentage of variance (6·65 %) and characterised by the consumption of poultry, legumes, red or processed meat or organ meats, broth and hydrogenated fats, in addition to less consumption of vegetable oils.
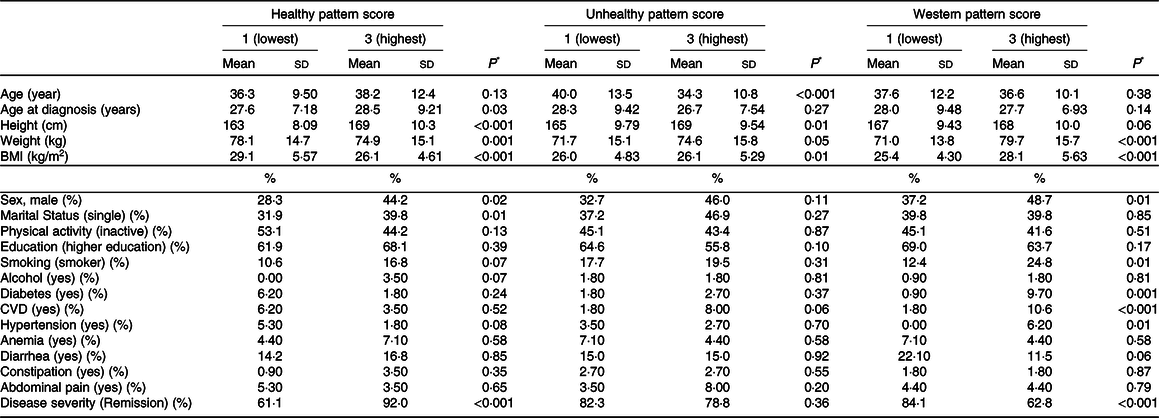
Table 2 indicates the baseline characteristics of participants according to the tertiles of dietary pattern scores. Compared with the first tertile of healthy dietary patterns, participants in the last tertile were older and had significantly higher men percent, height, single status, lower BMI and weight. Participants in the greatest tertile of the unhealthy dietary pattern were younger and had higher levels of BMI and height compared with those in the bottom tertile. The levels of weight, BMI, male participants, the ratio of smokers, diabetes, CVD and hypertension were significantly higher in the top tertile of Western dietary pattern participants compared with those in the bottom tertile. Moreover, in the last tertiles of healthy dietary patterns and Western dietary patterns, rate of remission was significantly higher and lower, respectively, in comparison with the first tertiles. However, there was no significant difference in the rate of remission between tertiles of the unhealthy dietary pattern.
Table 2. Baseline characteristics of study patients based on tertiles of major dietary patterns

BMI, body mass index; CVD, cardiovascular disease; kg, kilogram; Cm, centimeter; kg/m2, kilogram/meter2; MET/min/week, metabolic equivalent minute per week Values are based on mean ± standard deviation or reported percentage.
* Obtained by one-way ANOVA or chi-square, where appropriate.
The dietary nutrient intakes of participants across all dietary pattern scores are presented in Table 3. Participants in the highest tertile of the healthy dietary pattern had higher intakes of total energy, protein, carbohydrate, fat, dietary fibre, vitamins D, A, E, C, B1, B6, B9, B12, Zn, Ca and Mg, compared with those in the lowest tertile. In addition, dietary intakes of total energy, protein, carbohydrate, fat, dietary fibre, vitamins D, E, C, B1, B6, B9, B12, Zn, Ca and Mg were significantly different between the highest and lowest tertiles of unhealthy dietary pattern. Comparing the first to the last tertiles of the western dietary patterns, we observed significant differences in daily nutrient intakes, in contrast to vitamin D, vitamin B6, Ca and Mg.
Table 3. Daily nutrient intake of all patients across tertiles of dietary patterns

* Obtained by one-way ANOVA.
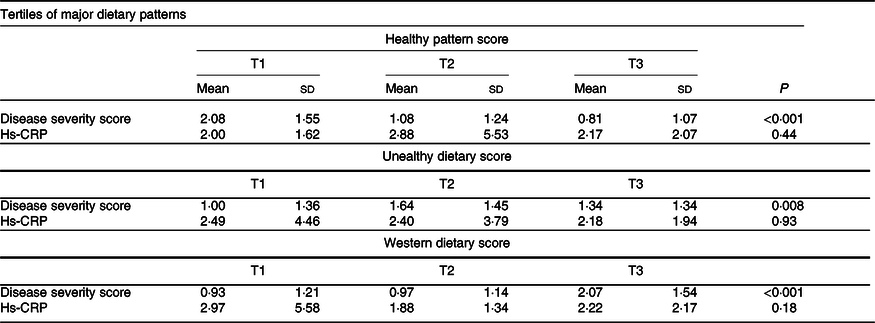
Table 4 presents the multivariable-adjusted means of disease severity scores by tertiles of dietary pattern scores. For the healthy dietary pattern, compared with tertile 1 (T1), T3 had a significantly lower disease severity score (0·81 ± 1·07 v. 2·08 ± 1·55, P < 0·001). For unhealthy and western dietary patterns, the disease severity score of participants in T3 was significantly higher than those in T1 (1·34 ± 1·34 v. 1·00 ± 1·36, P = 0·008 and 2·07 ± 1·54 v. 0·93 ± 1·21, P < 0·001, respectively). The differences in high-sensitivity C-reactive protein levels were not significant among tertiles of extracted dietary patterns.
Table 4. Multivariable adjusted means for disease severity score and hs-CRP across tertiles (T) of major dietary patterns

Hs-CRP, high-sensitivity C-reactive protein.
P ANCOVA test adjusted for age, sex, education, physical activity, smoking, alcohol, total energy and BMI.
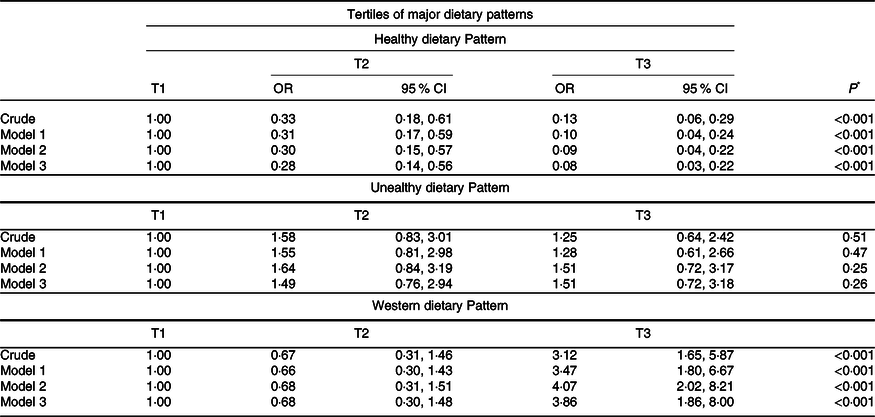
The multivariable-adjusted OR for the odds of severe UC across tertiles of major dietary patterns are illustrated in Table 5. In the crude model, we observed a significant reverse association between following healthy dietary patterns and the odds of severe UC (OR: 0·13; 95 % CI: 0·06, 0·29; P trend < 0·001), which was true even when possible confounders including age, energy, sex, education, physical activity, smoking, alcohol and BMI were taken into account in three models (model 1; OR: 0·1; 95 % CI: 0·04, 0·24; P trend < 0·001; Model 2; OR: 0·09; 95 % CI: 0·04, 0·22; P trend < 0·001; and Model 3; OR: 0·08; 95 % CI: 0·03, 0·22; P trend < 0·001). Participants in the highest tertile of the Western dietary patterns score had elevated odds of severe UC compared with those in the bottom tertile (OR: 3·12; 95 % CI: 1·65, 5·87; P trend < 0·001). This relationship was unchanged following age and energy adjustments (OR: 3·47; 95 % CI: 1·8, 6·67; P trend < 0·001). No significant changes in OR were detected after adjustment for other potential confounders, including sex, education, physical activity, smoking, and alcohol (OR: 4·07; 95 % CI: 2·02, 8·21; P trend < 0·001). In the third model, this association continued to be significant (OR: 3·86; 95 % CI: 1·86, 8·00; P trend < 0·001). However, no significant relationship was found between unhealthy dietary patterns and the odds of severe UC (OR: 1·25; 95 % CI: 0·64, 2·42; P trend = 0·51) even after adjustment for confounders including age, energy, sex, education, physical activity, smoking, alcohol, and BMI (OR: 1·51; 95 % CI: 0·72, 3·18; P trend = 0·26).
Table 5. Multivariable adjusted odds ratios and 95 % confidence intervals of severe disease across tertiles (T) in relation to major dietary patterns

Data are presented as OR and 95 % CI.
Model 1; Adjusted for age and energy.
Model 2; Adjusted for age, energy, sex, education, physical activity, smoking, and alcohol.
Model 3: Adjusted for age, energy, sex, education, physical activity, smoking, alcohol, and BMI.
* Obtained from binary logistic regression.
Discussion
To our knowledge, this study is the first one to examine the association between adherence to various dietary patterns and disease severity in Iranian patients with UC. In this cross-sectional study, we identified three dominant dietary patterns in UC patients in clinical remission as follow: healthy, unhealthy and Western dietary patterns. Adherence to a healthy dietary pattern was linked with lower odds of active symptoms of UC. Despite lack of observation of any association between unhealthy dietary pattern and UC activity scores, those following the Western dietary pattern experienced increased disease activity.
Previous observational studies have provided several pieces of evidence showing that diet can influence UC severity. Some vegetables, fruits, legumes, beans, spicy foods, milk, dairy products, alcohol and sweetened beverages are among the most common foods associated with worsened UC symptoms(Reference Cohen, Lee and Long17,Reference Bueno-Hernández, Núñez-Aldana and Ascaño-Gutierrez27–Reference Limdi, Aggarwal and McLaughlin29) . In contrast, rice and yogurt have been reported to ameliorate the severity of UC symptoms(Reference Cohen, Lee and Long17). However, the better approach for examining diet in relation to chronic disorders is in the form of dietary patterns to capture whole interactions within the diet rather than considering the intake of a single food group (Reference Hu30,Reference Jacques and Tucker31) . In the current investigation, we extracted three data-driven dietary patterns in Iranian adults diagnosed with UC; (1) healthy dietary pattern which was characterised by high intakes of vegetables; fruits, and fruit juices; legumes; nuts; fish and poultry; (2) unhealthy dietary pattern which contained high amounts of sweets and desserts; French fries; snacks and mayonnaise and (3) Western dietary pattern which was rich in red or processed meat or organ meats and hydrogenated fats. What we found was not quite similar to dietary patterns extracted in previous studies conducted in Iran(Reference Rashvand, Behrooz and Samsamikor7,Reference Eslamian, Amirjannati and Rashidkhani32,Reference Eslamian, Amirjannati and Rashidkhani33) . The differences can be elucidated by the fact that the dietary intakes of UC patients are rather different from those of the general population(Reference Limdi, Aggarwal and McLaughlin29,Reference Zallot, Quilliot and Chevaux34,Reference Crooks, McLaughlin and Matsuoka35) . A recent meta-analysis and systematic review of observational studies summarising the dietary intakes of IBD patients reported inadequate dietary intakes of energy, fibre, folate, Ca, legumes, fish, fruit and vegetables and dairy products, as well as excessive dietary intakes of Na and added sugar in UC patients in remission(Reference Lambert, Pappas and Miglioretto36). Comparing the habitual dietary intakes of UC patients with what is established as the usual dietary patterns of the Iranian population, the dietary patterns observed in this study are reasonable. In this survey, individuals with higher adherence to healthy dietary pattern were older compared with the others. This is understandable considering the fact that consumption of unhealthy food items is greater among youths as a result of nutrition transition around the world(Reference Bodirsky, Dietrich and Martinelli37). Moreover, subjects who followed unhealthy and Western dietary patterns had higher BMI. According to previous reports, Western dietary pattern is strongly associated with general and central adiposity in the Iranian population(Reference Esmaillzadeh and Azadbakht38). As expected, a higher percentage of chronic disease history was observed in the highest tertile of Western dietary pattern(Reference Oikonomou, Psaltopoulou and Georgiopoulos39,Reference Drake, Sonestedt and Ericson40) . In this study, the dietary pattern labeled as healthy was associated with lower chances of UC active symptoms, while an unhealthy dietary pattern was not linked with UC severity. We also observed that in individuals following Western dietary patterns, the disease symptoms worsened. Some previous studies have found different results. Limketkai et al.(Reference Limketkai, Hamideh and Shah41) have reported that a dietary cluster that resembled the Western diet was not associated with lower odds of active symptoms of UC, whereas plant-based dietary patterns, which were similar to the healthy dietary patterns extracted in this study, decreased the risk of UC active symptoms. A prospective cohort study has shown that among three extracted dietary patterns, only the first one, characterised by high consumption of grains, potatoes, oils and fats, processed and red meats, sugar and pastries, which was labelled ‘traditional [Dutch]’, was associated with the occurrence of flares in IBD patients. Researchers in that study claimed that this traditional dietary pattern resembled Western dietary patterns. Interestingly, in the same study, a Mediterranean-like diet was not linked with flares in IBD patients(Reference Peters, Spooren and Pierik42). This disparity could be justified by different methods applied to assess dietary intakes, extract dietary patterns and perform statistical analysis.
How exactly diverse dietary patterns and their components are related to UC severity is not fully understood yet. However, diet can modulate symptoms of UC through several possible mechanisms. Since a dysregulated gut microbiota can decrease the defensive and immunomodulatory functions of the intestine(Reference Feng, Chen and Liu43), alterations in gut microbiota have significant beneficial effects on intestine health(Reference Keshteli, Valcheva and Nickurak44). Diet can reshape the gut microbiota(Reference Rapozo, Bernardazzi and de Souza45,Reference Rogler, Biedermann and Scharl46) , and thus modulate UC symptoms. Diet also can lessen the intestinal inflammation due to its anti-inflammatory and antioxidative properties(Reference Minihane, Vinoy and Russell47,Reference Nikkhah-Bodaghi, Darabi and Agah48) . Dietary components have been found to improve mucosal immunity and epithelial barrier integrity as well(Reference Rizzello, Spisni and Giovanardi15,Reference Murtagh, Cooney and Higginbotham49) . Another possible significance of diet in the course of UC is malnutrition, which is common among UC patients(Reference Balestrieri, Ribolsi and Guarino50,Reference Scaldaferri, Pizzoferrato and Lopetuso51) . Micronutrient deficiencies and protein-energy malnutrition can indeed affect the course of IBD(Reference Takaoka, Sasaki and Nakanishi52,Reference Jansen, Prager and Valentini53) .
The main strengths of this study are focusing on dietary patterns rather than single nutrients or food items and being the first study to evaluate the association of posterior dietary patterns and the severity of UC in the Iranian population. Some strengths and limitations of the present study go hand in hand. For instance, applying a validated and detailed FFQ to assess the usual dietary intake of people suffering from UC is one of this study’s strengths; however, misclassification of study participants is still a possibility.
Moreover, even though several potential covariates were accounted for in multivariable models, there is always the effect of unmeasured residual confounders. Additionally, although, we used a validated questionnaire to assess disease severity, we did not gather any endoscopic data to apply other scores such as Mayo endoscopic score or UC endoscopic index of severity. Other limitations of this study include (1) reverse causality due to cross-sectional design of the present study; (2) subjective decisions made by researchers that are inbred during factor analysis, for example, subjective decisions are made regarding the number of food patterns(Reference Martínez, Marshall and Sechrest54) and (3) possible changes in usual dietary intake of patients with a purpose of easing UC symptoms. Further prospective cohort studies are needed in order to further assess our findings.
In conclusion, in this cross-sectional study, we found that adherence to a healthy dietary pattern might lower the odds of active symptoms in UC patients. Furthermore, the Western dietary pattern increased disease activity in these patients. More studies, especially prospective cohort studies, are needed to further assess this association.
Acknowledgements
This paper is a part of the Ph.D. thesis of Mohammad Reza Amini. The authors thank all the volunteers who participated in the study.
This work was supported financially by the National Nutrition and Food Technology Research Institute, Shahid Beheshti University of Medical Sciences, Tehran, Iran (Grant Number:43003016).
M. R. A., Z. K., M. S. and N. E-D. data collection and drafting of the work; A. H. and A. E. supervising project performance and substantial contributions to the conception of the work; A. H. contributions to the conception of the work and M. R. A. and M. S. analysis and interpretation of results. All authors approved the final version to be published.
The authors declare that the research was conducted in the absence of any commercial or financial relationships that could be construed as a potential conflict of interest.
This study was conducted according to the guidelines laid down in the Declaration of Helsinki, and all procedures involving human subjects/patients were approved by the Shahid Beheshti University of Medical Sciences (No. IR.SBMU.NNFTRI.REC.1401.049). Written informed consent was obtained from all subjects/patients.
Supplementary material
For supplementary material/s referred to in this article, please visit https://doi.org/10.1017/S0007114524000187


