Lactobacillus gasseri strain SBT2055 (LG2055) is a probiotic lactic acid bacterium that originates from the human intestine(Reference Seto, Kimura and Akai1, Reference Takahashi, Fujita and Suzuki2). LG2055 has the ability to improve the intestinal environment(Reference Fujiwara, Seto and Kimura3) and perform beneficial actions, including the inhibition of dextran sulphate sodium-induced ulcerative colitis in rats(Reference Imai, Fukui and Ohta4) and the prevention of rotavirus-induced diarrhoea in mice(Reference Kadooka, Tominari and Sakai5). LG2055 has also demonstrated an ability to regulate abdominal adiposity, including the prevention of adipocyte enlargement in rats(Reference Sato, Uzu and Yoshida6, Reference Kadooka, Ogawa and Ikuyama7) and the reduction in the visceral fat area in overweight human subjects in a randomised controlled trial (RCT)(Reference Kadooka, Sato and Imaizumi8).
In the previous RCT(Reference Kadooka, Sato and Imaizumi8), fermented milk (FM) containing LG2055 at a concentration of 108 colony-forming units (cfu)/g was consumed by subjects at a dose of 200 g FM/d for 12 weeks and resulted in significantly reduced visceral fat areas. However, its effectiveness at different doses should be further examined to confirm the appropriateness of the dose that we first tested, and to understand the effective dose range of LG2055. Information on the effective dose range would also be valuable when considering mechanisms of action.
Probiotics are defined as live micro-organisms that when administered in adequate amounts confer a health benefit on the host(9), which also suggests that the administration dose of a probiotic is an important factor in demonstrating probiotic effectiveness. Probiotic-containing dairy products are generally recommended to contain approximately 106cfu/g or more of probiotics(Reference Sanders10, Reference Vasiljevic and Shah11). This concentration, however, is not based on specific mechanisms of action or studies in clinical settings; rather, it has been set up to compensate for a possible decline in viable counts of probiotics during storage. It has also been suggested that dose–response studies with probiotics should be performed in a probiotic strain-dependent manner for a specific health target(Reference Sanders12). Thus, when taking account of the use of LG2055 in actual dairy products, it is important to examine whether LG2055 demonstrates anti-adiposity effects at concentrations as low as 106cfu/g, the recommended minimum level for probiotic bacteria in FM products. Additionally, there are no reported studies examining the administration dose of probiotics and its effect on abdominal adiposity.
In the present study, a multi-centre, double-blind, parallel-group RCT was conducted to examine whether consumption of FM containing LG2055 at concentrations of 106 and 107cfu/g, which are the recommended minimum or intermediate level of probiotics, respectively, exhibits lowering effects on abdominal adiposity, anthropometric measures and body composition in adults with large visceral fat areas.
Subjects and methods
Subjects
A total of 210 healthy Japanese adults (105 men and 105 women, aged 35–60 years) with large visceral fat areas (80·2–187·8 cm2) were enrolled for the study. The cut-off value of the visceral fat area for the enrolment was set to 80·0 cm2 in accordance with a study conducted in Japan(Reference Shigematsu, Okura and Kumagai13), in which the value has been suggested as appropriate when pre-menopausal women are included in the study group. Those with serious disorders, including internal organ diseases, diabetes and hypersensitivity to dairy products, were excluded. No subjects dropped out due to adverse events after the initiation of the study.
Study design
The present study was performed as a multi-centre, double-blind, parallel-group RCT. The protocol was in accordance with the Declaration of Helsinki, and was approved by the Institutional Review Board of Yokohama Tsuchida Medical Clinic (Yokohama, Kanagawa, Japan) before the initiation of the study. Subjects provided written informed consent before the study began. The study was conducted by a contract research organisation, ESUCAL Laboratories Company, Limited (Omiya, Saitama, Japan) and was performed from July 2011 to January 2012 at the following nine facilities in Japan: Yokohama Tsuchida Medical Clinic (Yokohama, Kanagawa); Ageo Kousei Hospital (Ageo, Saitama); Yuki Clinic (Shibuya-ku, Tokyo); Ishiguro Clinic (Gifu, Gifu); Kameido-minamiguchi Clinic (Koto-ku, Tokyo); Mizuno Internal Medical Clinic (Tokorozawa, Saitama); Sakuragaoka Central Hospital (Yamato, Kanagawa); Fuefuki Central Hospital (Fuefuki, Yamanashi); Higashi Kawaguchi Hospital (Kawaguchi, Saitama).
Primary outcome
The change in abdominal visceral fat area from baseline was applied as the primary outcome.
Sample size calculation
Sample size calculation was based on the result of the previous study's primary outcome of abdominal visceral fat area in the active group(Reference Kadooka, Sato and Imaizumi8), in which the average amount of change from baseline to week 12 was 5·82 with a sd of 13·48: these parameters yielded a power of 0·79 with n 43 per group for the paired t test at a 0·05 significance level.
To estimate the sample size for the present study, those parameters were applied again in the calculation of the paired t test at a significance level of 0·017 (Bonferroni correction for three comparisons) to fulfil a power of 0·85. This calculation produced a minimum required number of sixty-seven per group. Therefore, a total of 210 subjects at sixty-nine to seventy-one subjects per group in the present study were sufficient to give a power of 0·85.
Probiotic fermented milk
FM was prepared with lactic acid bacteria starter cultures (Streptococcus thermophilus and Lactobacillus delbrueckii ssp. bulgaricus) commonly used in conventional yogurt production. LG2055 cells at levels of 107, 106 and 0 (control) cfu/g were then added. In detail, a non-FM base for the production of FM consisted of approximately 11 % skimmed milk powder and a small amount of flavouring, agar and sucralose as a zero-energy artificial sweetener. This base was inoculated with the starter cultures and LG2055 cells, and then cultured at 40°C for 3·5 to 4 h. The viable cell counts of LG2055, monitored in every production using a selection medium(Reference Kadooka, Ogawa and Ikuyama7), were 7·9 (sd 1·1) × 107, 6·9 (sd 3·5) × 106 and 0 cfu/g for each dose group, respectively. The viable cell counts of the starter cultures for yogurt, which used a standard brom-cresol purple medium, was 1·2 (sd 0·2) × 109cfu/g. FM were identical in energy (146 kJ (35 kcal)), protein (3·7 g), fat (0·1 g), carbohydrate (4·9 g), Na (41 mg) and Ca (120 mg) content per 100 g; they were also indistinguishable in taste. FM were kept in cold storage and delivered weekly.
Study schedule and protocol
The study period consisted of a 4-week lead-in period in which initial parameters were obtained for baseline measurements, followed by a 12-week consumption period where initiation of consumption was designated as week 0, and a 4-week post-consumption period.
To minimise the imbalance between the groups, subjects were carefully matched for sex, age, initial BMI and visceral fat area within the medical facilities, and then randomly assigned by an independent researcher (M. K.) to three groups receiving FM containing LG2055 at levels of 107, 106 or 0 (control) cfu/g. Subjects consumed 200 g, as two portions of 100 g, of FM every day for 12 weeks, while they maintained their habitual mode of living including diet and exercise.
After the initiation of consumption, anthropometric measures and body composition were measured at weeks 4, 8 and 12 weeks and at 4 weeks after the completion of consumption. Abdominal computed tomography scans for the measurement of abdominal fat areas were carried out at weeks 8 and 12.
Each subject made a daily record of FM consumption, diet and exercise, including the number of steps walked and physical condition. Compliance was high: the frequencies of FM consumption were 99·2 (sd 1·4), 98·9 (sd 1·6) and 99·0 (sd 1·6) % in the 107, 106 and control groups, respectively. Subjects also made a detailed dietary record for three consecutive days before each measurement: at the start of consumption (week 0), weeks 4, 8, 12 and at 4 weeks after the completion of consumption. The dietary record was analysed by an administrative dietitian to determine the intake of energy, protein, carbohydrate, fat and Ca using Healthy Maker Pro 501 software (Mushroom Soft Company Limited).
Subjective symptoms were checked at each measurement, including headache, nausea and abdominal pain, and blood testing was conducted during an interview with a doctor.
Abdominal fat area
Four-slice abdominal computed tomography scans were taken at the level of lumbar 4–5 vertebra, with a 120 kVp tube voltage, 240 mAs tube current, 10 mm slice thickness and 450 mm field of view. Computed tomography scan images were analysed using Fat Scan version 4 software (East Japan Institute of Technology Company Limited) to obtain abdominal visceral and subcutaneous fat areas.
Anthropometric measures and body composition
Height was measured using a stadiometer. Waist circumference was measured at the level of the umbilicus, and hip circumference was measured at the level of the maximal extension of the buttocks. Body weight and body fat percentage (the bioelectrical impedance method) were measured using a scale for body composition (Inner Scan 50; Tanita). BMI was calculated as body weight (kg)/height (m2). Body fat mass and lean body mass were calculated using body fat percentage and body weight.
Statistical analysis
The SPSS statistical software package 15.0J for Windows (SPSS Japan, Inc.) was used for statistical analyses. Normality and equality of variances were confirmed using the Shapiro–Wilk test and Levene's test, respectively. The interaction between the experimental group and the consumption period of time (group × time interaction) was analysed using repeated-measures ANOVA. Within-group comparisons between baseline and each subsequent time point were carried out using repeated-measures ANOVA followed by Bonferroni multiple comparisons. The between-group comparisons were performed using the amount of change from baseline to each subsequent time point by applying a one-way ANOVA followed by Bonferroni multiple comparisons. A P value of less than 0·05 was considered as statistically significant.
Results
Baseline characteristics of the subjects
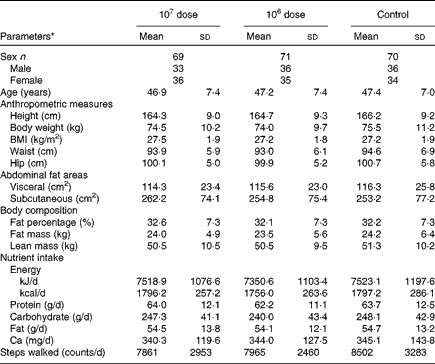
Table 1 shows no statistically significant differences in any parameters of the baseline characteristics among the three groups. Nutrient intake, including Ca, which is well known for its regulatory effects on obesity, and the number of steps walked were also not significantly altered from each baseline during the study period (data not shown).
Table 1 Baseline characteristics of the subjects (Mean values and standard deviations)

* No parameters were statistically significantly different between the experimental groups by one-way ANOVA.
Abdominal fat areas
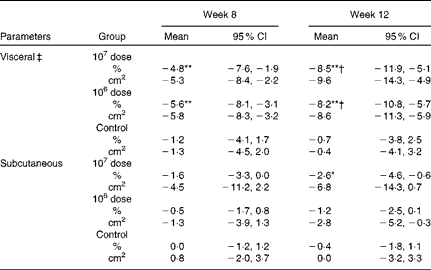
Table 2 shows that the group × time interaction was statistically significant for the abdominal visceral fat area, indicating that the pattern of changes from baseline over time differed and depended on the dose of LG2055. No significant differences were observed in abdominal subcutaneous fat areas. Visceral fat areas in both the 107 and 106 dose groups decreased significantly at weeks 8 and 12 from baseline (within-group comparisons); however, a reduction was not observed in the control group. The amount of changes at week 12 was significant in both the 107 and 106 dose groups against the control group (between-group comparisons).
Table 2 Percentage changes and corresponding measures from baseline in abdominal fat areas (Mean values and 95 % confidence intervals)

Mean values were significantly different for within-group comparisons from baseline: * P< 0·05, ** P< 0·01.
† Mean values were significantly different for between-group comparisons from control (P< 0·05).
‡ There was a significant group × time interaction effect (P< 0·05).
BMI, waist and hip circumferences
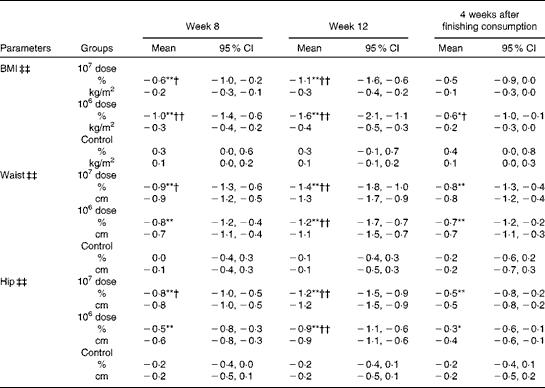
Table 3 shows that group × time interactions were significant for BMI, waist and hip circumferences. All these measures were significantly reduced in both the 107 and 106 dose groups at weeks 8 and 12 from baseline (within-group comparisons); a reduction was not observed in the control group. The amount of changes was significant in all the measures at week 12 in both the 107 and 106 dose groups against the control group (between-group comparisons). At 4 weeks after the completion of consumption, the amount of changes in all the measures in both the 107 and 106 dose groups became smaller than that observed at week 12; the waist and hip measurements in the 107 and 106 dose groups were not significantly different from the control group; however, these measurements were significantly different from baseline.
Table 3 Percentage changes and corresponding measures from baseline in BMI, waist and hip (Mean values and 95 % confidence intervals)

Mean values were significantly different for within-group comparisons from baseline: * P< 0·05, ** P< 0·01.
Mean values were significantly different for between-group comparisons from control: † P< 0·05, †† P< 0·01.
‡‡ There was a significant group × time interaction effect (P< 0·01).
Body composition
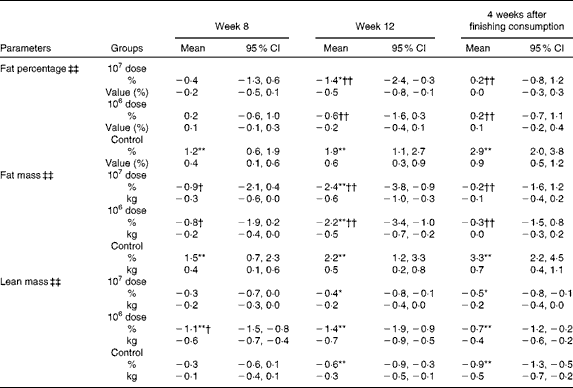
Table 4 shows that group × time interactions were significant for fat percentage, fat mass and lean mass; however, only fat mass demonstrated a significant decrease at week 12 both from baseline (within-group comparisons) and against the control (between-group comparisons) in both the 107 and 106 dose groups. At 4 weeks after the completion of consumption, the amount of changes in fat mass that were observed at week 12 in both the 107 and 106 dose groups was reduced and their significance from baseline had disappeared.
Table 4 Percentage changes and corresponding measures from baseline in body composition (Mean values and 95 % confidence intervals)

Mean values were significantly different for within-group comparisons from baseline: * P< 0·05, ** P< 0·01.
Mean values were significantly different for between-group comparisons from control: † P< 0·05, †† P< 0·01.
‡‡ There was a significant group × time interaction effect (P< 0·01).
Daily life and adverse events
No irregularities in daily life or adverse events related to the consumption of FM were observed throughout the study according to the daily record and an interview with a doctor. Blood test results (TAG, total, LDL- and HDL-cholesterol, NEFA, acetoacetic acid, 3-hydroxybutyric acid, total ketone body, lipoprotein, blood glucose, HbA1c, insulin, aspartate aminotransferase, alanine aminotransferase, γ-glutamyltranspeptidase, alkaline phosphatase, l-lactate dehydrogenase, total protein, albumin, uric acid, blood urea N, creatinine, Na, Cl, K, Ca, P, Mg, Fe, leucocytes, erythrocytes, Hb, haematocrit and platelets) also showed that all measurements were within normal ranges and no physiologically significant changes were observed throughout the study (data not shown).
Discussion
The present study demonstrated a significant reduction in abdominal visceral fat area after the consumption of FM containing probiotic LG2055, at concentrations of 106 and 107cfu/g. LG2055 at these levels showed the same potency at 108cfu/g which was used in our previous RCT: the average percentage change from baseline was − 4·6 % (95 % CI − 7·9, − 1·3)(Reference Kadooka, Sato and Imaizumi8). The present study, however, did not present a significant reduction in abdominal subcutaneous fat area which was observed in our previous RCT, suggesting a possible diminution of effectiveness at lower doses than the previous study's. Similar to our previous RCT, other measures, including BMI, waist and hip circumferences, and body fat mass, were significantly reduced from baseline at the two doses tested. Interestingly, when looking at anthropometric (Table 3) and body composition measurements (Table 4, except for lean mass), the amount of changes observed in the treatment groups at week 12 (the end of the consumption period) decreased in magnitude by the time of the 4-week follow-up visit (week 16), and became close to baseline measurements. Fat mass appeared to be the most affected in view of the extent of the amount of change and the disappearance of significance from baseline. This also suggested that continuous consumption of LG2055 was necessary to maintain its effectiveness.
The study conditions of the present and previous RCT were essentially identical to each other except for the doses of LG2055; the baseline characteristics of the subjects were also approximately the same between the studies in that they were healthy but having large visceral fat areas. Energy intake and physical activity estimated from daily and dietary records were considered normal, as shown in Table 1, which was also observed in the previous RCT. However, the existence of under-reporting(Reference Garriguet14, Reference Murakami, Sasaki and Okubo15), which is pointed out as unavoidable in a number of studies, can also not be denied in the present study, suggesting a possibility that unreported extra energy intake over time caused the obese tendency in the subjects examined. For this reason, the energy intake data in Table 1 should primarily be interpreted as there being no significant differences between the groups during the study period. Nevertheless, it is also undeniable that factors other than energy balance, for example aspects of a modern lifestyle, such as staying up late at night and various kinds of stress(Reference Buijs and Kreier16, Reference Kyrou, Chrousos and Tsigos17), and a possible ethnic propensity to accumulate fat in the abdomen(Reference Sniderman, Bhopal and Prabhakaran18), might be involved in the obese tendency, although exact causes are not clear.
Of particular significance in the present study is that significant decreases in abdominal visceral adiposity and other body measures were observed at doses as low as the order of 108cfu/d of LG2055 in 200 g FM consumed. Consideration was then given to the effectiveness observed at the lower dose in terms of the relative abundance of LG2055 ingested against indigenous bacterial number in the upper part of the intestine, which is initially accessible to orally fed LG2055. The upper two-thirds of the small intestine (duodenum and jejunum) normally harbour around no more than 104 indigenous bacteria/g of its intestinal content(Reference Hao and Lee19–Reference Peach and Tabaqchali21), and this bacterial number is significantly small compared with that in the large intestine (around 1011 bacteria/g). Although an exact comparison cannot be made, we speculate that the consumption dose of LG2055 (as low as 108cfu/d) could be considered to be relatively abundant in the number of bacterial cells in the upper small intestine. In addition to this relative abundance, frequent and long-term consumption, daily for 12 weeks, may enable LG2055 to interact with the intestine, producing a state of transient ‘colonisation’. It has been suggested that even ‘transient colonisation’ provides substantial physiological effects(Reference Hoffmann, Rath and Holzlwimmer22).
A physiological effect that could lead to a reduction in abdominal adiposity would be possible through the interaction between LG2055 and intestinal epithelial cells (IEC). Ingested LG2055 in transient colonisation would mostly interact with IEC, given that IEC constitute the majority of the intestinal wall. IEC have an ability to recognise microbial components of probiotics through their receptors, and recognition is closely linked with the maintenance of intestinal homeostasis, including controlling intestinal inflammation and integrity(Reference Rakoff-Nahoum, Paglino and Eslami-Varzaneh23–Reference Lee, Mo and Shen26). It is also reported that the lack of a recognition system causes disturbance to homeostasis(Reference Cario, Gerken and Podolsky27). Intestinal disturbance can be provoked by various stimulators, such as bacterial endotoxin of Gram-negative bacteria in the intestine and even a high-fat diet(Reference Ding, Chi and Scull28, Reference Ding and Lund29). Disturbance includes intestinal inflammation and loss of intestinal integrity, which have recently been highlighted as crucial factors causing abdominal adiposity independently of higher energy intake: mice that received an experimental infusion of endotoxin showed obesity despite having a normal diet(Reference Cani, Amar and Iglesias30), and mice lacking sensitivity to endotoxin were resistant to obesity, even though they were fed a high-fat diet(Reference Tsukumo, Carvalho-Filho and Carvalheira31). The probiotic LG2055 has the potential to prevent intestinal inflammation caused by an irritant(Reference Imai, Fukui and Ohta4). We suggest that ingested LG2055, recognised by IEC, might help enhance the anti-inflammatory and integrity-maintaining mechanisms of IEC, contributing to a reduction in abdominal adiposity.
It is also worth noting that the test FM containing both LG2055 and yogurt cultures reduced abdominal adiposity when compared with the control FM containing yogurt cultures alone, even though the bacterial counts of LG2055 (106 and 107cfu/g) were lower than those in the yogurt cultures (109cfu/g). Such superiority of LG2055 over yogurt cultures in exerting anti-obesity effects has also been demonstrated in our previous examination using rats. We reported that the LG2055-fed group had a greater effect in preventing an enlargement in mesenteric adipocyte size compared with the yogurt culture group(Reference Kadooka, Ogawa and Ikuyama7). Further investigation is underway on the mechanisms underlying the advantageous effectiveness of LG2055.
Compositional alteration in the intestinal microbiota would not be a prerequisite for lowering abdominal adiposity. Our preliminary examination in mice (H Uenishi and H Ogawa, unpublished results) showed that mice fed a high-fat diet containing LG2055 at 108cfu/g had significant lower abdominal adiposity. However, microbial gene analysis by real-time quantitative PCR of the caecum revealed no significant difference in the levels of predominant phylogenetic groups in the intestine(Reference Matsuki, Watanabe and Fujimoto32) (Clostridium coccoides group, Clostridium leptum group, Bacteroides fragilis group, Atopobium cluster, Bifidobacterium and Prevotella). The only significant difference was the detection of ingested LG2055 in the LG2055-fed group compared with the control group.
It is unknown whether the composition of colonic microbiota has a direct influence on abdominal adiposity; the relationship between obesity and alteration in the intestinal microbiota remains inconclusive(Reference Fleissner, Huebel and Abd El-Bary33, Reference Conterno, Fava and Viola34). Furthermore, the ease by which microbiota are altered by the diet(Reference Hildebrandt, Hoffmann and Sherrill-Mix35, Reference Queipo-Ortuno, Boto-Ordonez and Murri36) and various environmental factors, including genetics and age, makes it difficult to discuss the causal relationship between adiposity and intestinal microbiota. Subjects in the present study maintained their habitual mode of living, including diet, and no strict dietary control was applied. To address the relationship between adiposity and intestinal microbiota, examination under a strict diet, together with the latest methodology, such as advanced sequencing technology coupled with bioinformatics, would be required.
In summary, the present study demonstrated that consumption of LG2055 at doses as low as the order of 108cfu/d exhibited a significant lowering effect on abdominal adiposity in adults with large visceral fat areas. Other measures including BMI, waist and hip circumferences, and body fat mass were also significantly decreased from baseline. However, these measures decreased in magnitude by the time of the 4-week follow-up visit after completion of the 12-week consumption period, suggesting that constant ingestion is necessary.
Acknowledgements
We are grateful to Satoshi Higurashi, Ken Ukibe, Maya Yamashita, Michio Kawano, Tomohiro Hosoya and Humihiko Sakai for their skilful collaboration and useful suggestions. The present study received no specific grant from any funding agency in the public, commercial or not-for-profit sectors. The contributions of the authors were as follows: Y. K. was the primary author and responsible for the study; M. S. supervised the study design and commented on the paper; A. O., M. M., H. U. and H. O. assisted with the data analysis and interpretation; K. I. was responsible for the test FM's production and quality check; M. K. was responsible for the random assignment of the subjects as an independent researcher; T. T. supervised all the aspects of the study. The authors declare no conflict of interest.


