


Introduction
Low-carbon energy technologies are transforming energy supply and demand globally. In 2017, renewable energy sources represented approximately 70 percent of net additions to power generation capacity globally. Renewable energy reached 10.1 percent of global electricity production by the end of that year, excluding hydropower. Public policy has played an important role in hastening this clean energy transition by supporting innovation in, and the deployment of, low-carbon technologies.Footnote 1
In addition to mitigating climate change, governments promote the deployment of low-carbon energy technologies to boost economic growth and the international competitiveness of firms.Footnote 2 Research suggests that governments can use policies promoting the innovation and deployment of environmental technologies to create lead markets, providing opportunities for domestic companies to export to late adopters.Footnote 3 The lead market strategy is, amongst others, central to the German government's green industrial policy.Footnote 4 In addition, lead markets provide an incentive for governments in follower countries to adopt similar policies to those introduced in the lead market, thus resulting in technology diffusion and creating environmental co-benefits.
This paper addresses green industrial policy competition between lead markets and follower markets, which we propose affects the political dynamics of clean energy transitions.Footnote 5 We argue that differences in the complexity of technologies embedded in products, a crucial yet understudied factor shaping clean energy transitions, systematically affect the types of policies adopted by governments in follower markets.Footnote 6 For low-complexity technologies, such as solar photovoltaics (PV), we propose, governments in follower markets have an incentive to adopt industrial policies designed to achieve competitive advantage through creating economies of scale —“scaling up.” In comparatively more complex technologies, such as electric vehicles (EVs),Footnote 7 on the other hand, governments in follower markets have an incentive to adopt policies supporting the development of differentiated high-technology products—“innovating up.”
Our argument has implications for the pace and political sustainability of energy transitions. In markets for products that incorporate less complex technologies, the scaling up of manufacturing capacity in follower markets can drive falling costs and rapid diffusion of a technology.Footnote 8 While this has positive environmental benefits, follower market policies carry the risk of undermining the political coalitions that support clean energy transitions in lead markets, as value shifts to follower countries. In high-complexity technologies, in contrast, cost reductions occur at a slower pace than in low-complexity technologies, implying that support for public investment in lead markets will be more durable as companies are better able to maintain durable competitive advantage. In the next section, we discuss how technological complexity shapes the policy responses of follower markets, structuring policy competition between lead and follower markets.
Lead markets, global competition, and green industrial policy
Governments have an incentive to enact industrial policies that capture the benefits of promoting clean energy transitions domestically.Footnote 9 One proposed strategy for capturing the benefits of policies is to create a lead market, defined as a market that has a high degree of deployment early in the process of international technology diffusion. Follower markets, by extension, are those that adopt a given technology later than the lead market.Footnote 10 A high level of deployment in lead markets also often correlates with high rates of deployment growth.
Governments create lead markets by inducing firms to invest in new technologies.Footnote 11 Lead markets also promise environmental co-benefits because they create an incentive for governments in follower markets to promote products on the same technology pathway. This can create a “California effect,” in which policies promote more environmentally sustainable outcomes through competition between governments in lead and follower markets.Footnote 12
The lead-follower market model applies to products involved in clean energy transitions. For example, Japan, the United States, and other countries have deployed small volumes of solar PV capacity since at least the 1980s. Germany established itself as a lead market, however, by deploying solar PV in significant volumes in the early 2000s, with China and other markets subsequently adopting policies that facilitated the deployment of solar PV at scale.Footnote 13 Similarly, Denmark emerged as the lead market in wind power, and played an important role in exporting wind turbines to other markets. Wind power capacity is now scaling up across other markets. Finally, Japan, the United States, and increasingly China, are lead markets in electric vehicles, while Germany has lagged behind.Footnote 14
In this paper, we consider the implications of differences in the technologies embedded in products for the kinds of policy competition that emerges between governments in lead and follower markets.Footnote 15 We argue a key variable—the degree of technological complexity—affects the types of policies governments in follower markets implement to support domestic companies. This variation in policy choice, we propose, has important implications for the politics of clean energy transitions. Domestically, the long-run transition towards the sustainable use of energy requires stable support from coalitions of policy actors. This is particularly the case in the energy sector, where there are powerful incumbents that are likely to oppose threats to competitive advantage.Footnote 16 Companies that benefit from policies supporting a durable competitive advantage are more likely to support those policies. Companies that are unable to retain a durable competitive advantage, on the other hand, may choose to exit the market, thus reducing the political support for continuing with policies supporting clean energy transitions.
Internationally, the loss of competitive advantage can also lead companies to support policies that protect domestic industry at the cost of increasing the cost of renewable energy relative to traditional fossil fuels, as we have seen with the application of trade remedies against imports of solar PV modules from China.Footnote 17 Applying green industry policies to products that incorporate technologies promising durable competitive advantage therefore matters in ensuring the political coalitions endure that are required to create and maintain clean energy transitions.
In the next section, we define the key concept of technological complexity and discuss how low and high levels of technological complexity affect policy competition. We then examine our argument, using the cases of solar PVs and battery EVs.
Technological complexity: low vs high
Promoting the global deployment of clean technologies is central to mitigating climate change. Channels of diffusion include international trade and investment, and knowledge spillovers from research and development.Footnote 18 Patterns of diffusion are also affected by differences in the types of knowledge embedded in technologies.Footnote 19 The conventional view holds that industrialized economies develop knowledge-intensive, differentiated products that diffuse internationally, and then commodify as a technology matures.Footnote 20 More recent work suggests, however, that differences in the characteristics of technology embedded in products, including in clean energy technologies, such as solar PVs, affect patterns of technology diffusion.Footnote 21 Technologically complex products tend to induce competition over design characteristics, while less complex technologies tend to lead to competition over economies of scale and cost minimization.Footnote 22 Indeed, it is possible that technologically complex products may never shift toward commodification and pure price competition.
The difference in the complexity of technologies has implications for company strategy. In general terms, firms seek to secure a durable competitive advantage by implementing strategies that differ from their competitors, and that are difficult to imitate.Footnote 23 Products that are more difficult to imitate are thus more likely to represent a source of long-term competitive advantage.Footnote 24 Products that are more easily imitated, on the other hand, are less likely to lead to a sustained competitive advantage.
The ability to imitate is conditioned by factors such as the physical and human capital embedded in products, and organizational practices involved in production.Footnote 25 In addition, the characteristics of technologies embedded in products also affect ease of replication. Products that have more easily replicable knowledge or organizational practices can be imitated more rapidly, and thus have a greater propensity toward price-based competition.Footnote 26 Products with more complex knowledge embedded in them, on the other hand, are less able to be replicated, and can therefore represent a more durable source of competitive advantage.
We propose that variation in technological complexity has implications for another important phenomenon: differences in forms of policy competition between governments in lead and follower markets.
Follower market policy: scaling up vs. innovating up
The type of policy used by governments in follower markets varies according to the level of technological complexity of the product (see table 1).Footnote 27 We differentiate between government support for expanding manufacturing capacity, and government support for research and development (R&D) to develop innovative and differentiated products. For less technologically complex products, governments in follower markets have an incentive to adopt policies that support the development of manufacturing capacity to compete through economies of scale. This follows from the effect that technological complexity has on the opportunities for companies to enter into new markets. In the case of less-complex products, the creation of demand in lead markets provides an opportunity for companies in follower countries to export products to these markets. Given limited opportunities for differentiation, however, producers in follower markets compete on price. If we assume that governments have an interest in supporting the competitiveness of companies in these new markets, policies are likely to focus on achieving economies of scale. Empirically, this suggests subsidizing production capacity to a greater extent than promoting product innovation through R&D. Entering capital-intensive, large-scale manufacturing affords emerging economies opportunities for industrial upgrading.Footnote 28
Table 1: Scaling Up versus Innovating Up
In contrast, companies in follower markets for high-complexity technologies are more likely to compete through product innovation. For governments seeking to support companies operating in high-complexity technology markets, we thus expect them to assist product innovation through subsidies for research and development, tax credits, and the funding of demonstration projects.Footnote 29 Empirically, this suggests that governments subsidize R&D to a greater extent than building manufacturing capacity. Government policy plays in important role in promoting innovation, as technological spillovers may lead the private sector to underinvest.Footnote 30 As lead market governments also have an incentive to support product innovation, we expect subsidy competition among major economies, rather than price competition.Footnote 31
A related and important question is what the effect of the emergence of Global Supply Chains (GSCs) is on lead market-follower market dynamics. GSCs lower the barriers for firms to enter a market by enabling them to specialize in particular segments of a supply chain,Footnote 32 as they rely on global suppliers for sourcing key components. This contrasts with new markets in which firms needed to develop capabilities across the entire supply chain before entering. This also gave lead markets longer time periods to capitalize on their first-mover advantage. We suggest that GSCs have intensified leader-follower competition in clean technology transitions.
The explanation advanced here centers on technological complexity. Two other variables may arguably also affect the type of follower market policy: industry maturity and country type. First, Vernon's product cycle hypothesis suggests that in an initial phase of industry development, market participants compete to establish a dominant design and compete based on product differentiation.Footnote 33 Then, once this dominant design is established, they compete to out-produce one another in this dominant design, which results in price competition. If this holds, we would expect follower market policy generally to be a “scaling up” strategy in the long run. Second, the choice of follower market policy may be constrained by country type and related institutions and industrial capabilities. Advanced industrialized economies are more likely to adopt an “innovating up” strategy as are emerging economies. Both of these are important points that partially complement our argument on technological complexity. We engage with both in detail in the section Alternative explanations.
Technological complexity of solar PV and EVs
We examine our expectations through a comparison of the clean energy transitions in the power and automotive sectors, with a focus on the cases of solar PV and EVs. There are a number of differences between EVs and solar PVs. EVs are a final product that vehicle designers can vary across a wide range of performance and visual parameters, for example, while solar modules—the central component of solar PV systems—can be considered intermediate goods that vary in price and quality, but are only weakly differentiated across performance and visual parameters. The industries are arguably at different stages of maturity, a point we return to in the discussion. Here we focus, however, on a variable we propose is particularly important in shaping policy approaches adopted by governments: the relative degree of technological complexity.
A complex technology is “an applied system whose components have multiple interactions and constitute a non-decomposable whole.”Footnote 34 The degree of technological complexity differs substantially across products.Footnote 35 Low-complexity technologies are also associated with more rapid cost declines than more complex technologies, with implications for the pace of the transition to clean energy technologies.Footnote 36
The number of components used in manufacturing a given product is used as a reasonable first proxy for the complexity of technologies, based on the assumption that an increased number of components increases design and production demands. It is likely to lead to greater challenges in product assembly, implying greater transaction costs associated with coordinating production within and between firms. Manufacturing a product with a smaller number of components may be challenging for other reasons. For example, because it is capital intensive. All else equal, a larger number of components should thus make the production of a product more difficult to replicate than a product with fewer components.
Data on the number of components suggests solar PV systems are less technologically complex than EVs. The supply chain for PV systems is based on polycrystalline silicon, the predominant technology, and consists of six key steps: polysilicon, tools, wafers, cells, modules, and systems integration. In Life-Cycle Analysis (LCA), solar PV systems, including the Balance-of-System, incorporate modules, inverters, combiner boxing, cable housing, and mounting structures.Footnote 37 In contrast, while EVs are more simple than automobiles with internal combustion engines, LCAs identify a larger number of components than is evidence for solar PV systems, noting the presence of the electric motor, transmission, battery, inverters, controllers and other electronics, capacitors, and regenerative braking systems, in addition standard components such as tires, the chassis and so on.Footnote 38
With lower technological complexity and moderate capital intensity, solar PV modules showed greater propensity to commodification. In particular, as global production scaled up with the entry of China, solar modules became increasingly commoditized, competing on price instead of product differentiation.Footnote 39 A 2011 survey among developers and installers showed, for instance, that 57 percent of respondents identified cost as the main purchasing criteria for solar modules.Footnote 40 Even product differentiation at the level of PV systems—which include modules, mounting, inverters and other components—was not sufficient to counter the commodification of solar PV.Footnote 41
In this paper, we focus on policies implemented in follower markets. We distinguish between policies that focus on scaling up manufacturing, and those that focus on promoting product innovation through research and development. In the next section, we examine the four largest countries: China, the United States, Japan, and Germany, for each technology/industry. These four countries are major producers and consumers. Given their market size, they are engaged in the large majority of global industries and their policy choices have major impact on global patterns of competition. Our data on policies implemented in follower and lead markets is a mix of primary data drawn from government reports, and secondary data in the form of policies implemented across major solar PV and EV markets.Footnote 42
Scaling up: the solar industry
Solar PV is a key technology for the decarbonization of electricity systems. The technology is projected to draw USD $2 trillion of investment between 2015 and 2040, second only to wind among all forms of power generation, according to the New Policies Scenario of the International Energy Agency.Footnote 43
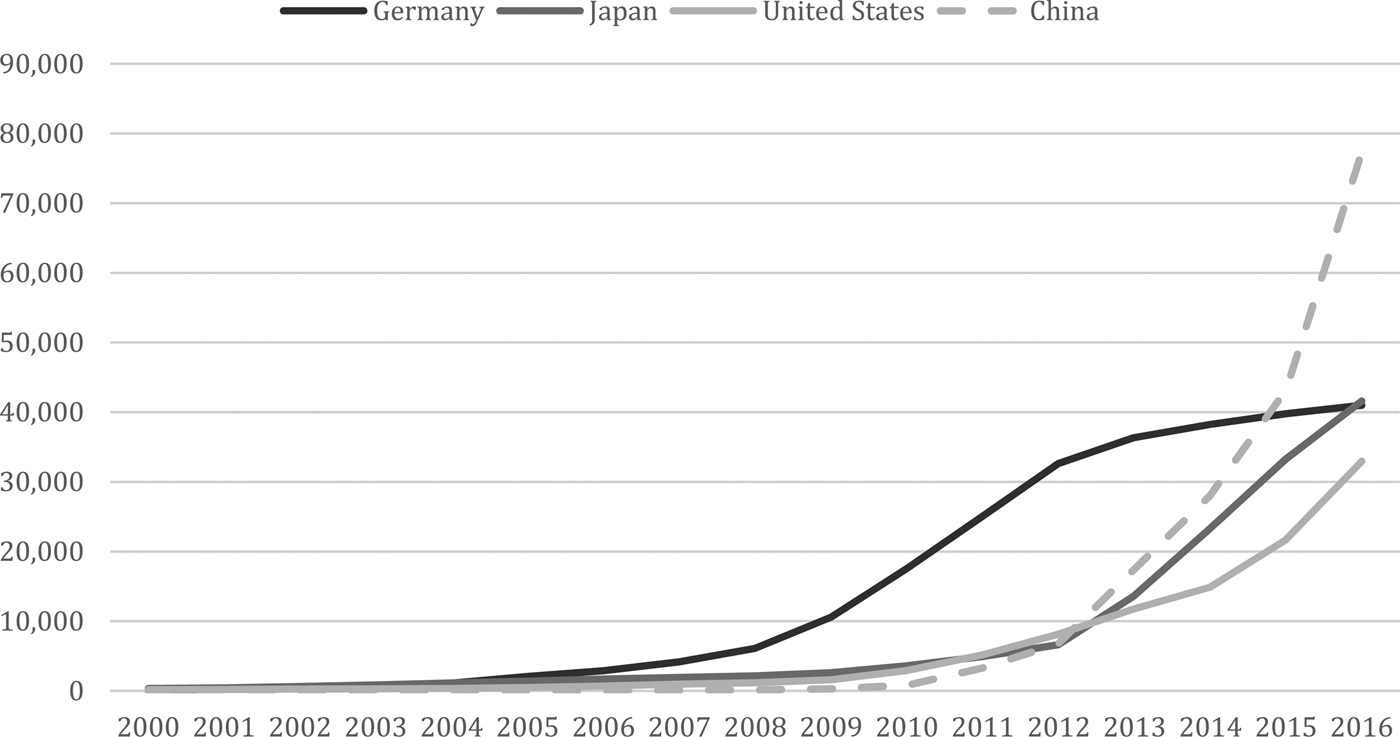
The growth prospects for the sector led producers in major economies to enter the production of solar PV components. Substantial growth in solar PV installations began in Germany. Starting in the mid-2000s, both production and deployment then globalized rapidly, resulting in companies in a broader range of countries to enter solar PV production. While Japan had deployed more solar PV than Germany at an earlier stage, absolute deployment in Japan remained low. The United States shows a similar pattern to Japan with early but very limited growth in PV deployment. Between 2001 and 2010, the average annual growth rate in PV capacity was also far higher in Germany, reaching 68 percent, compared to 27 percent for Japan and 34 percent for the United States.Footnote 44
Lead Market Policy: Germany
Solar PV production and deployment increased rapidly in Germany in the early 2000s. By 2005, Germany accounted for about 40 percent of cumulative installed solar PV capacity. As figure 1 shows, Japan remained a niche market despite its companies’ early lead in solar PV manufacturing. In 2005, Japan had 28 percent of installed capacity globally, with the United States standing at 3 percent. Chinese installed PV capacity was 1 percent.Footnote 45 In Germany, the economic benefits associated with this growth in demand were also largely captured domestically. German-based companies were responsible for 20 percent of global solar PV manufacturing in 2005, producing 339 megawatts (MW). Japan-based companies, produced 833 MW, representing almost 47 percent of global cell production. Chinese manufacturers stood at 128 MW, which represented just seven percent of total production.Footnote 46
The lead that Germany had in deployment was created in large part because of the milestone Renewable Energy Sources Act, enacted in 2000. Providing for a feed-in-tariff, the policy was a major incentive for the deployment of solar PV.Footnote 47 The feed-in tariff provided a fixed twenty-year tariff to installers of renewable energy projects, providing strong incentives for renewable energy investments. Total research, development, and demonstration (RD&D) spending for solar PV in Germany averaged USD $137.4 million between 2000 and 2014, with a standard deviation of USD $30.7 million dollars, and a maximum annual budget of USD $191.9 million (2012), and minimum of USD $96.4 million (2002).Footnote 48
As can be seen in figure 1, in terms of installed capacity, Japan and the United States were early entrants into the solar PV market, but the rate of deployment plateaued in both countries. In Japan, policies were initially implemented in response to the 1970s’ energy crisis through the “Sunshine Project,” an RD&D program that ran between 1974 and 1981, and included solar PV. The Sunshine Project was superseded by the “New Sunshine Project” in 1993, which shifted the focus to stimulating demand by subsidizing installation costs for households, easing regulatory barriers, enabling the purchase of excess solar to power utilities, and other measures.Footnote 49 In 2003, a Renewable Portfolio Standard was introduced, targeting a 2.3 percent share for renewable energy in power generation by 2010. The most significant change came in the form of the 2012 Feed-In Tariff (FIT), which introduced generous returns for investors in renewable energy. Solar installations represented almost 90 percent of total projects registered under Japan's FIT, a situation the government sought to rectify with changes to the structure of the FIT implemented in 2017 that was designed to rebalance growth towards other energy sources. Total RD&D spending in Japan averaged USD $205.7 million between 2000 and 2014, with a standard deviation of USD $104.6 million dollars, and a maximum annual budget of USD $247.7 million (2013), and minimum of just USD $6.9 million (2007).
The United States followed Japan's pattern of early but slow growth in PV deployment. A combination of federal and state-level policies stimulated solar PV investments. In 2005, the federal Investment Tax Credit was introduced, which reduced the capital cost for solar PV installations.Footnote 50 It has been the main government incentive for solar PV investments in the United States since.Footnote 51 In the mid-2000s, states also increasingly adopted renewable portfolio standards that obligated utilities to procure renewable energy projects.Footnote 52 In addition, the introduction of net metering policies helped drive growth in the market for small solar installations. The United States also supported the producers of solar PV technologies through incentives at both the federal and state level, including through the federal Sunshot Initiative for RD&D.Footnote 53 Total RD&D spending in the United States was the highest of the lead markets, averaging USD $1.227 billion between 2000 and 2014, with a standard deviation of USD $484.6 million dollars, a maximum annual budget of USD $2.128 billion (2011), and minimum of USD $778.6 million (2001).
Follower market policy: scaling up in China
The deployment policies implemented by lead markets created an incentive for the Chinese government to support the development of manufacturing capacity in solar PV cells and modules.Footnote 54 A leading assessment of the Chinese solar PV industry notes that “the goal traditionally has not been to invent a new type of solar cell or to break a world cell-efficiency. Rather, it has been to gradually close the gap between China and the West.”Footnote 55 By 2016, solar PV modules produced in China constituted 71 percent of the global total.
GSCs in the solar industry aided China's emergence as a follower market specialized in solar module production. Data shows that Chinese producers imported polysilicon, the key raw material, from, for instance, the German firm Wacker. They also imported significant equipment, particularly from German and U.S. manufacturers.Footnote 56 They thus outsourced technologically complex inputs, while focusing on scaling up the less technologically complex solar PV modules. In the absence of GSCs, China would have had to develop domestic industrial capabilities for the complete supply chain, suggesting its emergence as a follower market would have been later.
Over 2004–2008, the central government, as well as provincial governments shifted to support domestic solar PV manufacturing in order to enable it to take advantage of the growth in global solar PV demand in lead markets. China's tenth five-year plan (2001–2005) focused on developing an annual domestic manufacturing capacity of 15 MW and included no details regarding research and development. By the end of the eleventh five-year plan (2006–2010) module manufacturing capacity increased to 8,700 MW, although the plan noted the need for more solar PV-related R&D.Footnote 57 This contrasted with the approach initially adopted in its domestic market, where deployment incentives were weak, and total installed capacity stood at just 300 MW in 2008.Footnote 58
A wide array of different types of subsidies were provided, including, but not limited to, tax incentives, direct investments in specific manufacturing lines, and direct financial support for production inputs, such as electricity; provincial and local governments often provided subsidies on top of those from the central government. Solar PV manufacturers also became eligible for financial support for research and development, after the industry was identified in the Catalog of Chinese High-Technology Products for Export in 2006. In terms of general purpose, Ball et al. summarize that the Chinese solar industry “harnessed China's structural advantages as a manufacturing economy—advantages that included low labor costs, lax environmental standards, and ready government support for establishing factories—to scale up the production of solar modules.”Footnote 59 Estimates of R&D related spending on solar PV in China suggest spending was modest. One estimate suggests government-only financing of solar R&D from both the central and provincial governments between 2001–2015 stood at USD $74 million, with a further USD $223 million in R&D funding co-sourced from the public and private sectors, though the relative shares are unclear.Footnote 60
As a result, Chinese producers held 60 percent of the global module production capacity by 2012. Meanwhile, the share of the two lead markets, Europe and Japan fell to 9 percent and 8 percent of global module production capacity by 2012, respectively.Footnote 61 China's entry into the market also led to price drops for modules up to 64 percent in the two years prior to September 2012.Footnote 62
The rise of China as a solar manufacturing hub drove a series of trade conflicts in both Europe and the United States, focused on Chinese PV cells and modules.Footnote 63 Solar producers in Europe and the United States in particular struggled with Chinese import competition, seeking trade protection against Chinese solar imports. At the same time, several solar module manufacturers, especially in Europe, went bankrupt.Footnote 64 Between 2010 and mid-2017, ten trade disputes emerged in the solar industry, with a total of seventeen disputes relating to renewable energies more broadly.Footnote 65 These were trade remedy cases that were directed at subsidies and/or price dumping. China was one of the parties in all solar-related cases, whereas the other party was the United States, the European Union, Canada, India, or Turkey. The EU-China and the U.S.-China solar disputes were the two most prominent cases, resulting in a minimum price and imports quotas in the European Union and tariffs in the United States.Footnote 66
Innovating up: the EV industry
Numerous technologies contribute to the decarbonization of the transport sector, including fuel cell and hybrid EV technologies, increased efficiency in internal combustion engines, and biofuels. While EVs retain a small share of the total personal vehicle market, representing less than one percent of total annual sales in most markets, EVs have also emerged as the leading technology, based on policy support in many countries and growth prospects.Footnote 67
The diffusion of EVs shows a pattern of deployment that follows lead and follower market dynamics, with the United States and Japan combined representing 62 percent of the global stock of EVs in 2009 (figure 2), while Germany represented four percent and China eight percent in 2010, respectively. Reflecting this, the stock of BEVs in Japan in 2010 was 3,520 vehicles, 3,770 vehicles in the |United States, 1,009 vehicles in China, and just 250 vehicles in Germany. By 2015, China reached 30 percent of the global stock of EVs, while the United States stood at 28 percent, and Japan at 10 percent; Germany lagged at four percent of the global market. The Chinese stock of registered EVs was over 225,720, with 70,930 in Japan, 210,330 in the United States, and 30,560 in Germany.Footnote 68
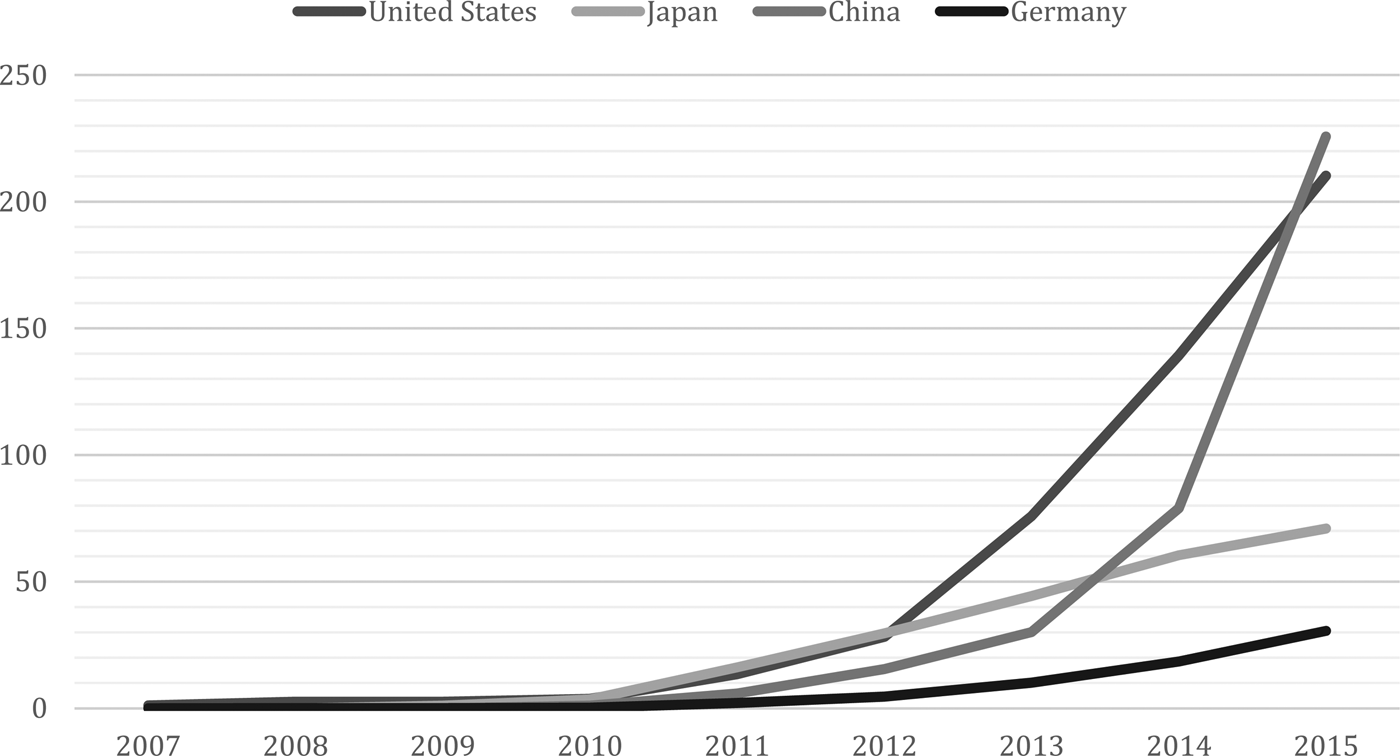
Figure 2: Battery EVs, stock by country, 2005–2015 (thousands)
EVs are more complex technologically than solar PV modules, although they have substantially fewer components than ICEs. Below we introduce policies supporting EVs in key lead markets, followed by a description of policies in Germany, which is the main follower market, trailing EV deployment in all other major producer markets.
Lead market policy: the United States and Japan
The United States and Japan are categorized as lead markets, given their deployment patterns as shown in figure 2. China has also been adopting policies to become a lead market. Government support in each country heavily influenced EV deployment. The U.S. government, for example, adopted technology policies supporting the commercialization of EVs in the midst of the 2008–2009 economic crisis, including subsidies for RD&D and consumer incentives. The American Recovery and Reinvestment Act of February 2009 in particular provided investments into RD&D funding and retooling, to thereby establish a domestic battery industry. The Emergency Economic Stabilization Act of 2008 had already created a consumer tax credit for EVs, which was further expanded by the ARRA. The federal government also negotiated a tightening of fuel economy standards, which created demand for the deployment of electric cars. In August 2009, the Obama administration committed USD $2.4 billion for RD&D, as well as for the manufacturing of batteries and EVs.Footnote 69 The majority of the funds had been allocated by the end of 2011. This compares to an estimated USD $100 million for consumer tax credits for alternative vehicle technologies (excluding hybrid) between 2010 and 2014.Footnote 70
The Japanese government also supported EV innovation and deployment. The “Next-Generation Vehicle (NGV) Strategy 2010” was announced soon after the commercialization of the Mitsubishi MiEV (2009) and Nissan Leaf (2010). The strategy included a headline target for NGV penetration, along with plans for batteries, upstream resource development, infrastructure, power systems, and international standardization. It also included support for RD&D activities focused on, for example, improving the efficiency of the powertrain, research into lithium-ion and other battery technologies, and the development of smart-grid technologies. By 2014, financial support was included in the national budget.Footnote 71 The 2014 budget included measures to promote research and development into new vehicle technologies, such as new battery technologies (3.1 billion yen in 2015; USD $30 millionFootnote 72), and lithium-ion batteries (2.5 billion yen; USD $20 million). In addition, 10 billion yen (USD $90 million) was allocated to subsidize consumer purchases of EVs, fuel-cell vehicles, plug-in hybrid electric vehicles, and clean diesel vehicles, with the stated goal of reaching the target for new car sales.
China's role in the market for EVs is different to that of solar PVs. While specific R&D figures are not available, data suggests that the Chinese government has focused on supporting innovation in key EV technologies at an early stage, in addition to policies designed to support the deployment of EVs domestically. The “Development Policy for the Automobile Industry,” released in 2004 noted that industry should begin to invest in EV and battery technologies.Footnote 73 During the ninth Five-Year Plan (2001–2005), EVs were included in the key technology research and development plan (“Program 863”), which focuses on power systems, batteries, and other areas.Footnote 74 Support for R&D was extended into the tenth five-year plan, from 2001–2005, including support for research and development into components such as the battery, electric motor, and electric control systems.Footnote 75 NGV technology development was also included in the eleventh and twelfth five-year plans, which noted support for the development of core components such as motors and batteries.Footnote 76
The Chinese government also focused on EV deployment through the use of pilot cities, most notably through the 2009–2012 “Ten Cities, Thousand Vehicles” program that provided subsidies for the purchase of public fleet vehicles. The program was extended to include purchases by private consumers from 2013.Footnote 77 This was coupled with an array of incentives put in place by local governments in these areas, including concessional loans from state banks for investing in the EV market, or upgrading production lines.Footnote 78 In 2012, under the Energy Efficient and Alternative-energy Vehicle Industry Development Plan (2012–20), this target was updated to five hundred thousand EV sales by 2015, and five million in sales by 2015.Footnote 79 Incentives were increased in 2013–15 to include both government purchases and individual buyers of vehicles, with the size of the subsidy determined by the range of the vehicle in the case of EVs.Footnote 80 Cities and regional governments offered additional incentives, including the right to gain a car registration, as well as further consumer subsidies on top of those provided by the central government.Footnote 81 The government also introduced a preferential tax policy that reduced the taxes associated with new vehicle purchases, and ownership taxes.Footnote 82
Follower market policy: innovating up in Germany
Germany is a follower market in the EV sector—in terms of both deployment and supply of electric vehicles. Germany responded to innovation policies in lead markets by subsidizing RD&D. In total, Germany provided EUR 1.5 billion in EV-related R&D funding between 2009 and 2013. The economic stimulus program of March 2009, the “Konjunkturpaket II,” offered EUR500 million (USD $614 million) of RD&D funding until the end of 2011. The 2009 National Development Plan for Electric Mobility declared the goal for Germany to become a lead market for EVs, aiming to deploy one million EVs by 2020.Footnote 83 In May 2011, the government approved the Government Program on Electric Mobility, which provided a further EUR one billion (USD $1.23 billion) RD&D funding until the end of 2013.Footnote 84 The RD&D investment in EVs was a major departure from Germany's innovation strategy for advanced transport technologies. Public RD&D funding was almost exclusively focused on hydrogen fuel cells. Since the oil crises of the 1970s, the government had supported R&D for hydrogen to some extent.Footnote 85 In 2006, the federal government expanded its efforts through the ten-year National Innovation Program on Hydrogen and Fuel Cells.Footnote 86 By contrast, it only marginally supported RD&D for lithium-ion batteries prior to 2009.Footnote 87 While the German government subsidized R&D, we found no evidence of subsidies for retooling production lines or building new manufacturing capacity.Footnote 88
Germany's follower role in EVs contrasts with its lead role in solar. Unlike in the solar case, a coalition of technology challengers did not emerge early on in the case of electric mobility. The Big Three German automakers—BMW, Daimler, and VW—had coordinated around diesel as the low(er)-carbon engine technology for the mid-term outlook, betting on hydrogen fuel cells for the long-term.Footnote 89 International competitive developments in Japan, the United States, and China, however, eventually galvanized interest among producers and policymakers to increase RD&D for EVs. In justifying its RD&D policy for EV technology, the government explicitly stated the need to catch up with the public investments of China, the United States, and Japan in EV RD&D and manufacturing.Footnote 90 Policymakers were aware that the country was catching up with a global technology trend. The German policy strategy purposely delayed deployment of EVs by not providing incentives for consumers to purchase EVs until 2016. It was thus not developing economies of scale by expanding manufacturing, but focused instead on RD&D. The first German EV, BMW's i3, came to market in late 2013. All major German producers had electric models in their fleet by 2016. By comparison, the first battery-electric vehicle for the global mass market was the GM Volt, which began sales in early 2011.
Germany's emergence as a follower in EVs hinged on the existence of GSCs. Despite its broad set of industrial capabilities, the country had no lithium-ion auto battery production when EVs entered the global market. Global battery production was concentrated in Japan and South Korea. BMW was the first German carmaker to launch a mass-market vehicle, the i3, in 2013. Its battery cells are produced by Japan's Samsung.Footnote 91 In a similar vein, the emergence of the US as a lead market depended on the availability of battery cell imports from Japan.
Lead markets for EVs in the United States, Japan, and China thus incentivized other producer countries, notably Germany, to push product innovation for global export markets. We thus observe a pattern of producer subsidy competition. To date, the competition largely unfolds along a north-north axis. Only the United States, Japan, and Germany export EVs to the global market. China pursues an import-substitution strategy by producing largely for the home market, though with export ambitions. It remains to be seen whether China's strategy of industrial upgrading in the automobile industry will prove sufficiently successful to enter into direct technology competition with advanced industrialized economies. Given the size of its home market, China is in any case capturing a large share of global EV production.
Alternative explanations
Industry maturity and country type offer alternative explanations for the outcomes that we observe, as discussed above. Here we engage with these alternative—and partially complementary—explanations in light of the empirical cases.
The solar and EV industries are arguably at different levels of industry maturity. However, our analysis focuses only on the early stage of industry development, in which follower countries enter. In the solar industry, this period was approximately six years: from Germany's 2000 FIT to China's manufacturing push around 2006. In the EV industry, we observe a similar time span between early movers and followers. The United States leveraged its 2009 stimulus package to enter the EV industry, while Germany followed with increased R&D in 2011 and purchase incentives for domestic market development in 2016. The two cases thus focus on the same early period of industry development. Nonetheless, it remains to be seen how government policy evolves in the EV sector as the industry matures.
Previous work, however, suggests that differences in the characteristics of technology embedded in products, including in clean energy technologies such as solar PVs, affect patterns of technology diffusion.Footnote 92 Technologically complex products tend to induce competition over design characteristics even as the technology and industry matures, while less complex technologies tend to lead to competition over economies of scale and cost minimization.Footnote 93 Indeed, it is possible that technologically complex products may never shift toward commodification and pure price competition.
As regards country type, there is certainly evidence that cross-national differences shape patterns of technology diffusion, and we are sympathetic with these arguments. Hochstetler and Kostka, inter alia, find that the trajectories of wind and solar power development in Brazil and China were affected by different institutions in the two countries, and the way this affected the incorporation of industries, as well as their characteristics.Footnote 94 We thus agree that economies differ in industrial capabilities and institutions, and this matters for the types of policies they can adopt in global policy competition. Investment in R&D can also be affected by broader political interest in energy-related issues, as occurred in the 1980s in the United States, and indeed elsewhere, as R&D increased rapidly following the oil shocks of the 1970s.Footnote 95
Yet the evidence does not support the contention that national institutions are more powerful an explanation for the observed differences in the cases examined here. The EV case, for example, shows that China is a leader in the development of electric vehicles, which requires competitive strategies based on product differentiation, in addition to price. While Germany is indeed competing on technological innovation, China does both—compete on scale and increasingly so on innovative products, suggesting the classic understanding of Germany as a knowledge-intensive economy, and China as an economy with cheap labor but low innovation, no longer holds. Follower governments can also decide just not to support companies in a given industry. Indeed, that is a what we would expect to occur if, for example, Germany had been late in solar PV. This suggests national institutions functioning rather as constraints on the choice set available in follower markets, rather than determining those choices. We discuss this further in the cases of lithium-ion batteries and hydrogen fuel cells below.
To conclude, we are not arguing that national institutions are irrelevant—rather that in the cases examined here they appear to constrain the policy choices available to in follower countries. Below we suggest that future research needs to better identify the specific national institutions that allow follower countries to pursue scaling up or innovating up strategies.
Conclusion
This article addresses the competitive dynamics of global energy transitions. The lead market hypothesis has shaped thinking on green innovation and industrial policy. Early adopters of environmental regulation are thought to be able to capture competitive advantages by exporting clean technologies to the global market. We proposed that differences in the complexity of technology embedded in products conditions the ability of lead markets to capture the economic benefits from being a first mover. In low-complexity technologies that lend themselves to commodification, we hypothesized that governments in follower countries have an incentive to focus on “scaling up” manufacturing capacity to achieve competitiveness through economies of scale. Policy competition in solar PV has followed this pattern. While major producer countries maintained low levels of RD&D investments, followers, notably China, made major investments into expanding manufacturing capacity. This led to rapid price declines in solar modules. In comparatively more complex technologies, in contrast, we proposed that market competition will focus on product differentiation. This gives governments an incentive to implement policies that focus more heavily on RD&D strategies that allow “innovating up” of follower producers. Policy competition in EVs has centered around innovation strategies and public RD&D investments in both lead and follower markets.
We identify three areas for future research. First, studies should further probe the generalizability of the argument that we developed inductively from the solar PV and EV industries. A “scaling up” pattern appears to be emerging in lithium-ion batteries, for example, which are a key component of EVs. While Japan and Korea were the lead markets for the technology, China has followed with significant support for expanding the manufacturing of battery cells and packs.Footnote 96 Similar to solar PV, it is plausible that global competition in current-generation battery production will center on price. Producers may eventually enter trade disputes over increasingly commoditized auto batteries. This debate is currently unfolding in Germany as firms and the government are considering entering battery cell production but have so far refrained from investing in the scaling up of manufacturing of current-generation lithium-ion batteries.Footnote 97 The question is if battery cells will follow the path of solar modules or if Germany could gain an innovation-based competitive advantage. In contrast, complex low-carbon technologies, such as hydrogen fuel cells, appear to be following a similar path to EVs, with industrialized economies providing funding largely for R&D. In the early 2000s, all major auto-producer nations invested substantially in hydrogen fuel cell development, entering producer subsidy competition.Footnote 98
Second, we suggest that GSCs have lowered the barriers to market entry for producers in follower markets. There are two plausible effects this could have on the political coalitions supporting clean energy transitions. On the one hand, GSCs may have the effect of promoting openness in trade in renewable energy industries, as firms increasingly rely on the import and export of components.Footnote 99 Global trade in components could improve the cost competitiveness of clean technologies relative to traditional fossil fuels. On the other hand, if GSCs increase the speed with which industries mature, and price competition becomes more prevalent, this could weaken overall support for clean energy transitions, in particular in less complex technologies. Further research could begin to explore which of these mechanisms has a more powerful effect in shaping the domestic politics of clean energy transitions. Differences in the complexity of technology in the wind and solar PV sectors, for example, have been found to systematically affect the mechanisms of cross-border knowledge-transfer, and this had implications for the Chinese government's choice of policy instruments.Footnote 100
Third, our cases suggest that economies have comparative advantages that condition the extent to which they can pursue innovating up or scaling up strategies. Follower countries can opt to not participate in policy competition. It is, for instance, unlikely that Germany would have pursued a scaling up strategy if China had been a lead market in solar PV. The country's strength lies innovation-intensive manufacturing. China, instead, shows capabilities to innovate up and to scale up across our two cases. National differences thus act as a constraint on policy choice in follower markets. Research needs to further explore the critical comparative advantages that allow economies to pursue scaling up or innovating up industrial strategies.
Our argument on types of policy competition has implications for the pace and political sustainability of clean technology transitions. A long-standing debate concerns the extent to which global competition helps to support positive environmental outcomes, named the “California Effect.” One key reason proposed for this is that the competitive advantage created for lead markets creates coalitions between business and government in support of environmental policy. Consistent with this, political support for clean energy deployment often rests on political appeals to domestic economic opportunities. The case of solar PV suggests, however, that while global competition in less complex technologies can drive cost declines and the rapid deployment of low-technology products, this can come at the cost of lead markets losing manufacturing to follower markets. “Scaling up” in follower markets thus bears the risk of undermining the political coalitions supporting lead market policy for low-carbon technologies. For instance, the rapid commodification of polycrystalline solar modules along with the loss of manufacturing in Europe and the United States has led governments to underinvest in R&D for advanced solar technologies. The challenge for low-complexity technologies is thus to maintain political support in industrialized lead markets for continued public investments to maintain energy innovation.Footnote 101 In particular, they need to ensure to build broad coalitions beyond clean energy manufacturers. In high-complexity technologies, conversely, we are likely to observe competition based on product differentiation. This suggests that we can expect continued political support for public investment in lead markets, as they build and maintain innovation-based competitive advantages.


