


Zeolites formed by post-eruptive reactions of hydrated glass shards are abundant in pyroclastic rocks, especially in tuffs, due to their high volcanic glass contents and porosity (Hay, Reference Hay and Mumpton1981; Hay & Sheppard, Reference Hay, Sheppard, Bish and Ming2001; Marantos et al., Reference Marantos, Christidis, Ulmanu, Inglezakis and Zorpas2011). Natural zeolites are excellent adsorbents for heavy metals, with the adsorption depending on both the pollution source and the properties of the natural zeolite used (Velarde et al., Reference Velarde, Nabavi, Escalera, Antti and Akhtar2023). Two isostructural minerals of the natural zeolite group – heulandite (hul) and clinoptilolite (cpt; abbreviations after Whitney & Evans, Reference Whitney and Evans2010) – have an ideal chemical formula of (Ca–Na–K)6(Al6Si30O72).24H2O, which is very similar in both minerals. As noted by Bish & Boak (Reference Bish, Boak, Bish and Ming2001), who elaborated on the hul and cpt nomenclature, there has been controversy regarding the distinction between the two minerals since the early studies on these minerals and even after their crystal structures were completely understood. Various empirical methods and approaches based on the framework chemistry, exchangeable-cation composition, thermal stability, thermogravimetry, proton nuclear magnetic resonance (NMR) spectroscopy and X-ray diffraction (XRD) data have been utilized to describe and distinguish hul and cpt (Mason & Sand, Reference Mason and Sand1960; Mumpton, Reference Mumpton1960; Shepard & Starkey, Reference Shepard, Starkey, Naidu and Wiswanathiah1966; Merkle & Slaughter, Reference Merkle and Slaughter1968; Alberti, Reference Alberti1972; Alietti, Reference Alietti1972; Boles, Reference Boles1972; Hawkins & Ordonez, Reference Hawkins and Ordonez1972; Alietti et al., Reference Alietti, Gottardi and Poppi1974, 1977; Hawkins, Reference Hawkins1974; Alberti & Vezzalini, Reference Alberti and Vezzalini1983; Bish, Reference Bish1984, Reference Bish, Kallo and Sherry1988; Gottardi & Galli, Reference Gottardi and Galli1985; Armbruster & Gunter, Reference Armbruster and Gunter1991; Boak et al., Reference Boak, Cloke and Broxton1991; Esenli & Kumbasar, Reference Esenli and Kumbasar1994, 1998; Valueva, Reference Valueva1994; Ward & McKague, Reference Ward and McKague1994; Bish & Boak, Reference Bish, Boak, Bish and Ming2001; Christidis et al., Reference Christidis, Moraetis, Keheyan, Akhalbedashvili, Kekelidze and Gevorkyan2003; Spiridonov et al., Reference Spiridonov, Sokolova, Okhlopkova, Koryakina, Shits, Argunova and Nikiforov2015).
The cpt has a Si/Al ratio > 4 (or 3.8) and is thermally stable up to 650–800°C and hul has a Si/Al ratio < 4 (or 3.8) and is thermally unstable after heating to 450–550°C (Mason & Sand, Reference Mason and Sand1960; Mumpton, Reference Mumpton1960; Alietti, Reference Alietti1972; Boles, Reference Boles1972; Alietti et al., Reference Alietti, Brigatti and Poppi1977). Alietti (Reference Alietti1972) classified hul/cpt into three groups depending on their thermal stability. Type-1/hul passes into the B phase, a polymorphic contracted phase described by a decrease in d(020)-spacing (from 8.95 to ~8.25 Å) during heating and decomposes after heating up to 450°C. Type-2/hul may or may not transform into the B phase after heating at 450°C and only partially decomposes. Type-3/cpt does not transform into the B phase and is generally stable up to 650°C. Although cpt is rich in Na and K and hul is Ca-rich, the exchangeable cations are highly variable. Thus, Coombs et al. (Reference Coombs, Alberti, Armbruster, Artioli, Colela and Galli1997) reported a classification according to the dominant exchangeable cation, such as K-, Na-, Ca- and Sr-hul and K-, Na- and Ca-cpt. Bish & Boak (Reference Bish, Boak, Bish and Ming2001) explained that the distinction between the two minerals should be based on their structure and chemical composition. Boak et al. (Reference Boak, Cloke and Broxton1991) and Bish & Boak (Reference Bish, Boak, Bish and Ming2001) reported Si/(Al + Fe3+) ratios of 2.7–5.0 and (Ca + Mg)/(Na + K) ratios > 1 for hul and proposed that Ca(0.5) ↔ Na,K substitution is possible in cpt.
Although some differences between hul/cpt-group zeolites with different extra-framework cations have been reported, it is difficult to distinguish between them based on their unit-cell parameters, which are comparable. Alberti (Reference Alberti1972) and Koyama & Takeuchi (Reference Koyama and Takeuchi1977) reported unit cell parameters for hul (a: 17.718 Å, b: 17.897 Å, c: 7.428 Å and β: 116°25′) and for cpt (a: 17.660 Å, b: 17.963 Å, c: 7.400 Å and β: 116°47′). Moreover, the sensitivity of the unit-cell parameters to varying water content makes accurate determination difficult (Boles, Reference Boles1972; Bish, Reference Bish1984). There are three channel systems in the hul/cpt structure. Two of them are parallel to the c-axis; one of them consists of a 10-member (tetrahedron) ring with a size of 4.4–7.2 Å (or 3.1–7.5 Å), the second one consists of an eight-member ring with a size of 4.1–4.7 Å (or 3.6–4.6 Å) and the third one is parallel to the a-axis and consists of an eight-member ring with a size of 4.0–5.5 Å (or 2.8–4.7 Å) (Merkle & Slaughter, Reference Merkle and Slaughter1968; Breck, Reference Breck1974; Koyama & Takeuchi, Reference Koyama and Takeuchi1977; Yang et al., Reference Yang, Stolz, Armbruster and Gunter1997; Baerlocher et al., Reference Baerlocher, Meier and Olson2007).
Two types of porosity are present in the structure of hul/cpt: microporosity caused by the specific crystal building of the zeolite mineral grains; and meso/macro-porosity related to the sizes of the zeolite and other mineral grains and the structure of the parent rock (Tsitsishvili et al., Reference Tsitsishvili, Andronikashvili, Kirov and Filizova1992; Kowalczyk et al., Reference Kowalczyk, Sprynskyy, Terzyk, Lebedynets, Namiesnik and Buszewski2006; Sprynskyy et al., Reference Sprynskyy, Golembiewski, Trykowski and Buszewski2010). Exchangeable cations and water molecules occupy the porous space of natural zeolites, and the number and size of these cations influence the pore structure (Mumpton, Reference Mumpton1960; Breck, Reference Breck1974; Tsitsishvili et al., Reference Tsitsishvili, Andronikashvili, Kirov and Filizova1992; Kowalczyk et al., Reference Kowalczyk, Sprynskyy, Terzyk, Lebedynets, Namiesnik and Buszewski2006). Their nano-sized pores and the channel system primarily control gas adsorption and diffusion in the zeolite group minerals. According to Bae et al. (Reference Bae, Yazaydın and Snurr2010), a gas adsorption isotherm is also necessary as it provides information on the pore-size distribution and specific surface area. The authors stated that the Brunauer–Emmett–Teller (BET) method, when used cautiously, can be employed to determine the specific surface area of microporous materials such as zeolites.
In this study, the BET-specific surface area, pore volume and pore-size characteristics of the rock samples containing >80 wt.% hul/cpt minerals from the four regions in western Anatolia (Türkiye) were investigated. The unit-cell chemical compositions of the hul/cpt minerals are known. The primary aim was to determine the surface characteristics of the zeolite-rich samples and to compare the adsorption results with the cationic compositions of natural hul/cpt-group minerals. The study is also focused on understanding how pore size influences the type and quantity of exchangeable cations in hul/cpt minerals, and it establishes the relationship between pore size and these cations. Finally, another aim of the study was to determine the changes in surface characteristics with different degassing temperatures.
Materials and methods
Zeolite-rich pyroclastic units, mainly in Miocene lacustrine basins, are widespread in western Anatolia, and some of them are industrial deposits where commercial mining takes place (Esenli & Özpeker, Reference Esenli and Özpeker1993; Esenli & Kumbasar, Reference Esenli and Kumbasar1994; Gündoğdu et al., Reference Gündoğdu, Yalçın, Temel and Clauner1996; Esenli & Sirkecioğlu, Reference Esenli and Sirkecioğlu2005; Snellings et al., Reference Snellings, Van Haren, Machiels, Mertens, Vanderberghe and Elsen2008; Semiz et al., Reference Semiz, Schroeder, Özpınar, Karakaş, Kadir and Türkmenoğlu2011; Kaçmaz, Reference Kaçmaz2016; Esenli et al., Reference Esenli, Kadir and Ekinci-Şans2019). Eleven hul/cpt-rich samples were used in this study, which were collected from the pyroclastic units of the Miocene-aged volcanoclastic basins in the four regions in western Anatolia: Demirci (D), Gördes (G), Bigadiç (B) and Şaphane (S) regions. The samples have similar petrographic and mineralogical characteristics, similar zeolite mineral types (hul/cpt) and formed via similar zeolitization processes. They are fine- or coarse-grained ash tuffs with white, grey, beige, yellowish beige and pale green colour. They have been petrographically described as vitric, ash-dust types of rhyolitic–rhyodacitic tuffs composed of mainly glass shards, minor or trace amounts of pumice and lithic fragments and mineral grains (feldspars, quartz, biotite, muscovite, amphibole and opaque minerals).
The semi-quantitative mineralogical compositions of the hul/cpt-rich tuff samples were estimated using the petrographic polarizing microscope (Leica, DM750) and XRD methods. A Bruker D8 Advance instrument was used to perform XRD analyses with Ni-filtered Cu-Kα radiation at a scanning speed of 1°2θ min–1, a tube voltage of 40 kV and a current of 40 mA. Mineralogical and petrographic data were reported for some samples (Esenli & Kumbasar, Reference Esenli and Kumbasar1998; Esenli & Sirkecioğlu, Reference Esenli and Sirkecioğlu2005; Esenli et al., Reference Esenli, Kadir and Ekinci-Şans2019). The XRD reference intensity method (Chung, Reference Chung1975) was used to estimate the mineral percentages (%, in weight) of some newly obtained samples by applying the reference intensity constants for minerals given by Ekinci-Şans et al. (Reference Ekinci-Şans, Esenli, Kadir and Elliott2015).
The chemical compositions and morphological properties of the hul/cpt minerals were determined using a Tracor Northern 5400 energy-dispersive X-ray (EDX) spectrometer on JSM-840 and JSM-7000 scanning electron microscopes (SEMs). The abundances of Si, Al, Fe, Ca, Mg, Na and K cations were calculated based on 72 oxygens for the hul/cpt group (Ba and Sr were not analysed). The quality of the analyses was checked using the balance error formula (Passaglia, Reference Passaglia1970), giving results of <10% for nine samples and 10.2% and 10.7% for the two other samples. The batch method was used to measure the ammonium uptake of the bulk samples according to Esenli & Sirkecioğlu (Reference Esenli and Sirkecioğlu2005), and a modified Kjeldahl method was used to determine the NH4+ cation-exchange capacities (CECs) of the ion-exchanged samples.
N2 adsorption at 77 K was conducted to determine the surface characteristics of the samples. Before the adsorption analysis, all of the samples were degassed under vacuum at 150°C for 12 h. In addition, some of the samples were degassed under vacuum at 300°C for 10 h. For zeolite-type materials, the degassing temperature is generally 150–350°C for 6–12 h (Çakıcıoğlu-Özkan & Ülkü, Reference Çakıcıoğlu-Özkan and Ülkü2004; Lowell et al., Reference Lowell, Shields, Thomas and Thommes2004; Hao et al., Reference Hao, Hu, Li, Wu, Liu and Zhang2018). Therefore, temperatures of 150°C and 300°C (at 12 and 10 h, respectively) were chosen to investigate the effect of the degassing temperature on the surface characteristics. The total specific surface areas, the pore volumes and the average pore diameters were calculated from the adsorption data at 150°C and 300°C, obtained using volumetric adsorption instruments (Quantachrome Nova 2200e and Micromeritics 3flex, respectively) after degassing at 150°C and 300°C. The specific surface area was calculated using the BET method. The pore volumes of the samples were determined using the Barrett–Joyner–Halenda (BJH), Dollimore–Heal (DH), Horvath–Kawazoe (HK) and Saito–Foley (SF) methods. The Dubinin–Astakhov (DA), BJH, DH, HK and SF methods were used to determine the pore diameters.
Results
Mineralogy (XRD and SEM)
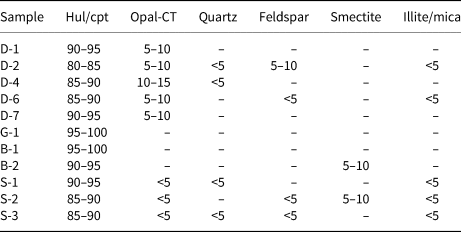
All samples contain abundant hul/cpt and minor or trace amounts of opal-CT (cristobalite–tridymite), quartz, feldspar, smectite and illite–mica (Fig. 1 & Table 1). The crystalline phases were identified using Joint Committee on Powder Diffraction Standards (JCPDS) mineral cards (JCPDS, 1974) and Breck (Reference Breck1974). All peaks belong to hul/cpt, and the most intense ones are 8.95, 3.95 and 2.97 Å on the XRD trace of samples G-1 and B-1 (Fig. 1). Opal-CT, identified from the broad 4.05–4.07 Å peak, occurs in eight samples (Fig. 1 & Table 1). Traces or minor quartz (3.34 Å) and feldspar (3.16–3.25 Å) occur in some samples (Fig. 1 & Table 1). Analysing the polarizing microscopy images, feldspars are mostly sanidine and rarely plagioclase (albite-oligoclase). Ca-smectite (14.71 Å) occurs in two samples and illite–mica (10.07 Å) in five samples (Fig. 1 & Table 1).
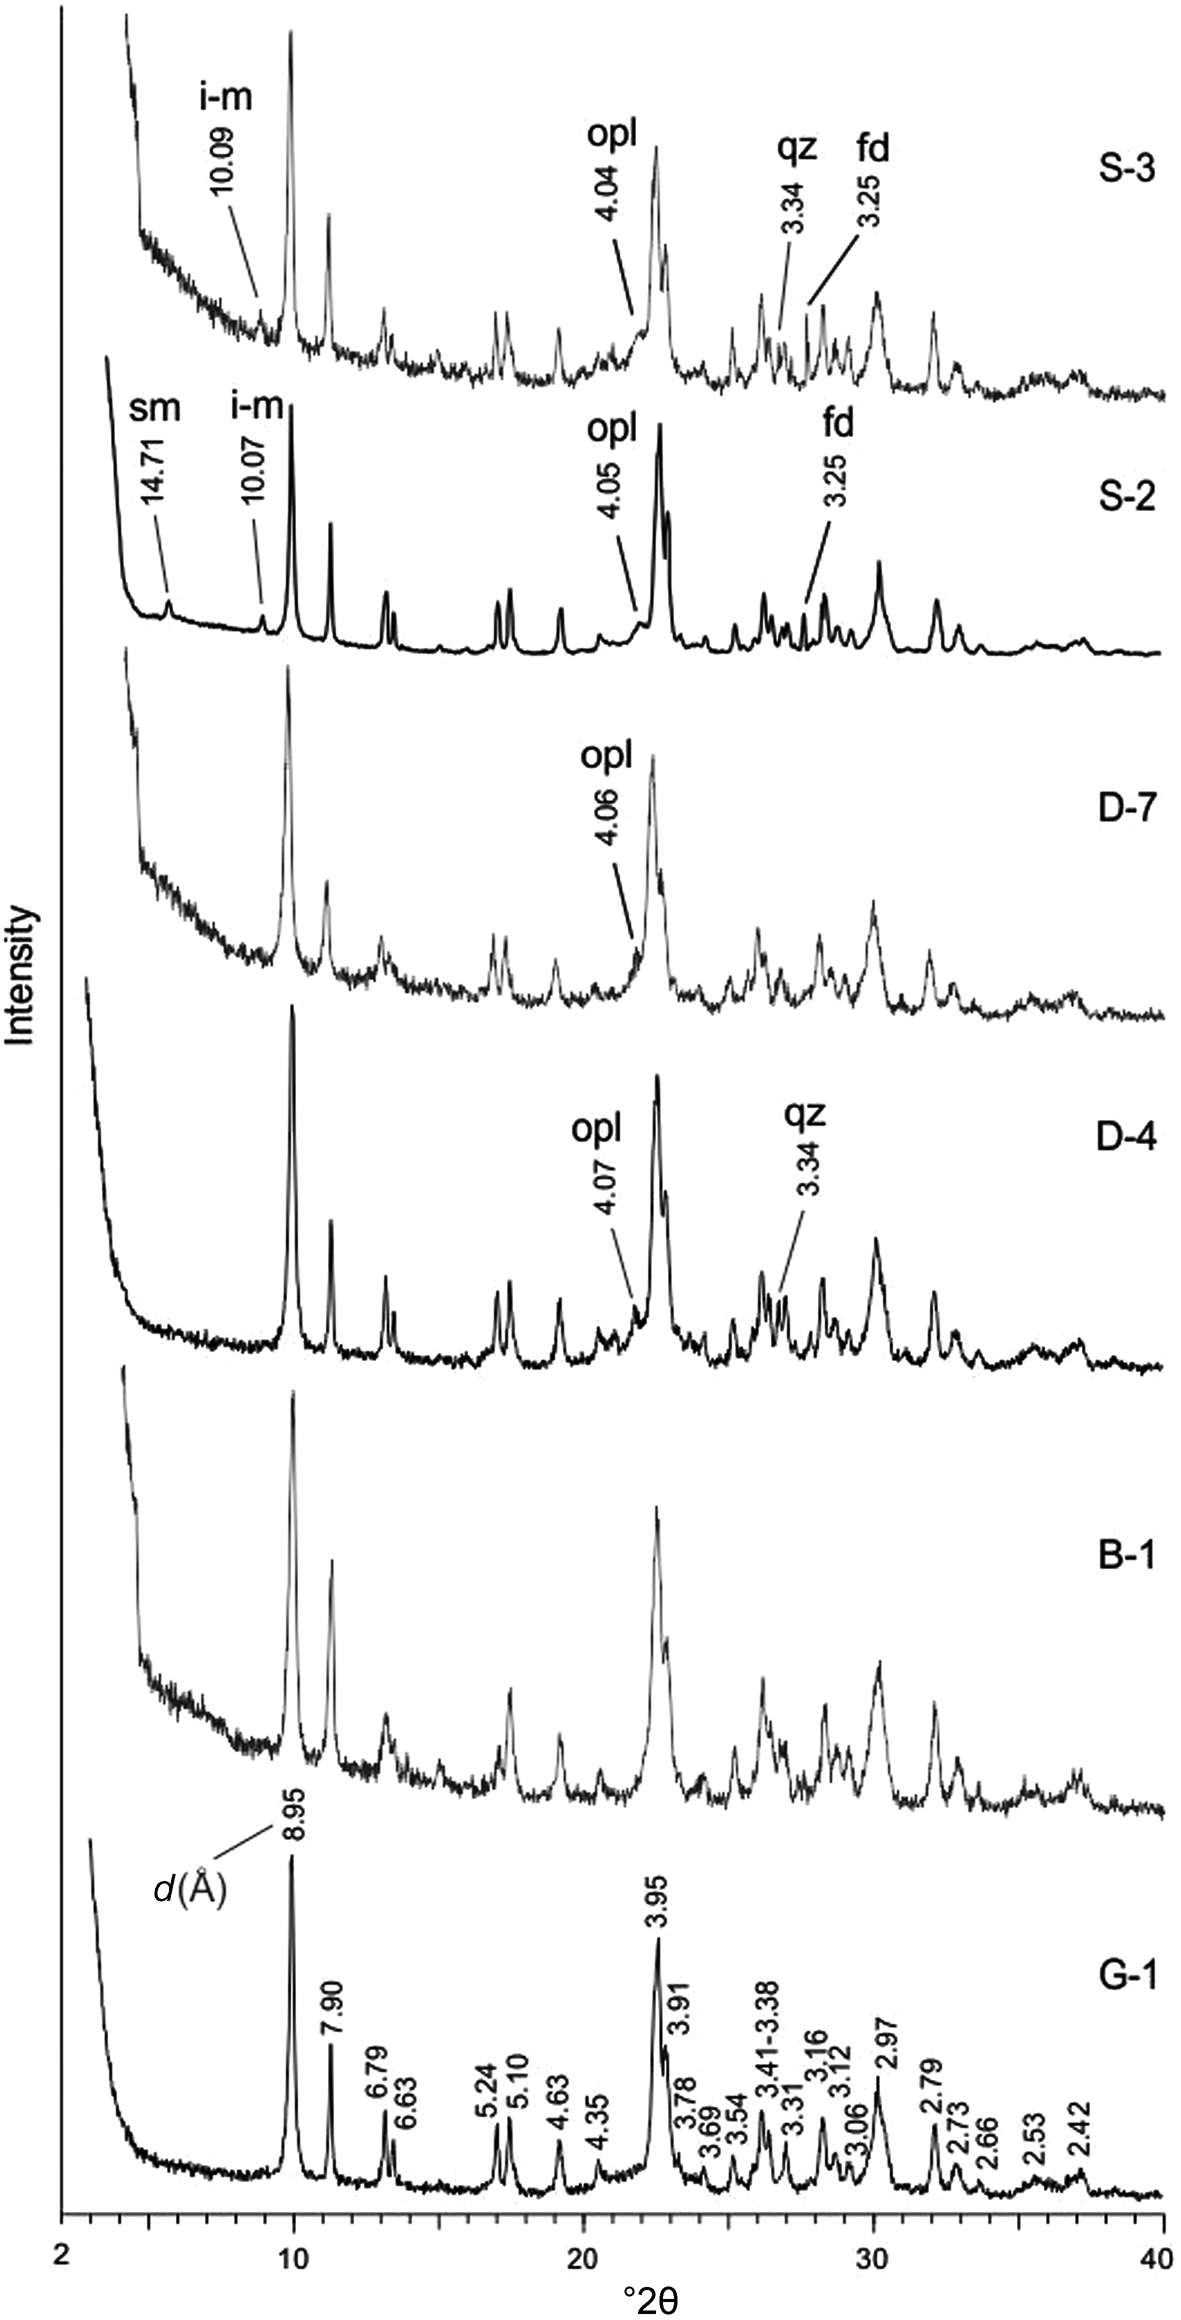
Figure 1. XRD traces of representative samples. Samples G-1 and B-1 contain only hul/cpt minerals. The remaining samples (D-4, D-7, S-2 and S-3) contain small and trace amounts of opal-CT (opl), quartz (qz), feldspar (fd), illite–mica (i-m) and smectite (sm) in addition to hul/cpt.
Table 1. Modal mineralogical compositions (wt.%) determined using XRD of the studied zeolite-rich pyroclastic rock samples from the Demirci (D), Gördes (G), Bigadiç (B) and Şaphane (S) regions.
The SEM images of some of the studied samples (B-1, S-1, S-2 and D-7) are shown in Fig. 2a–d, and some were also reported by Esenli & Özpeker (Reference Esenli and Özpeker1993) and Esenli (Reference Esenli and Malhotra1995). Hul/cpt grains formed by the transformation of volcanic glass are generally <15 μm long, <10 μm wide and <3 μm thick. They locally coexist with flaky smectites and opal-CT spheres in some samples (Fig. 2b,d). Smectite and opal-CT generally formed from transformation of volcanic glass and also from earlier authigenic minerals (smectite from hul/cpt and opal-CT and opal-CT from hul/cpt).
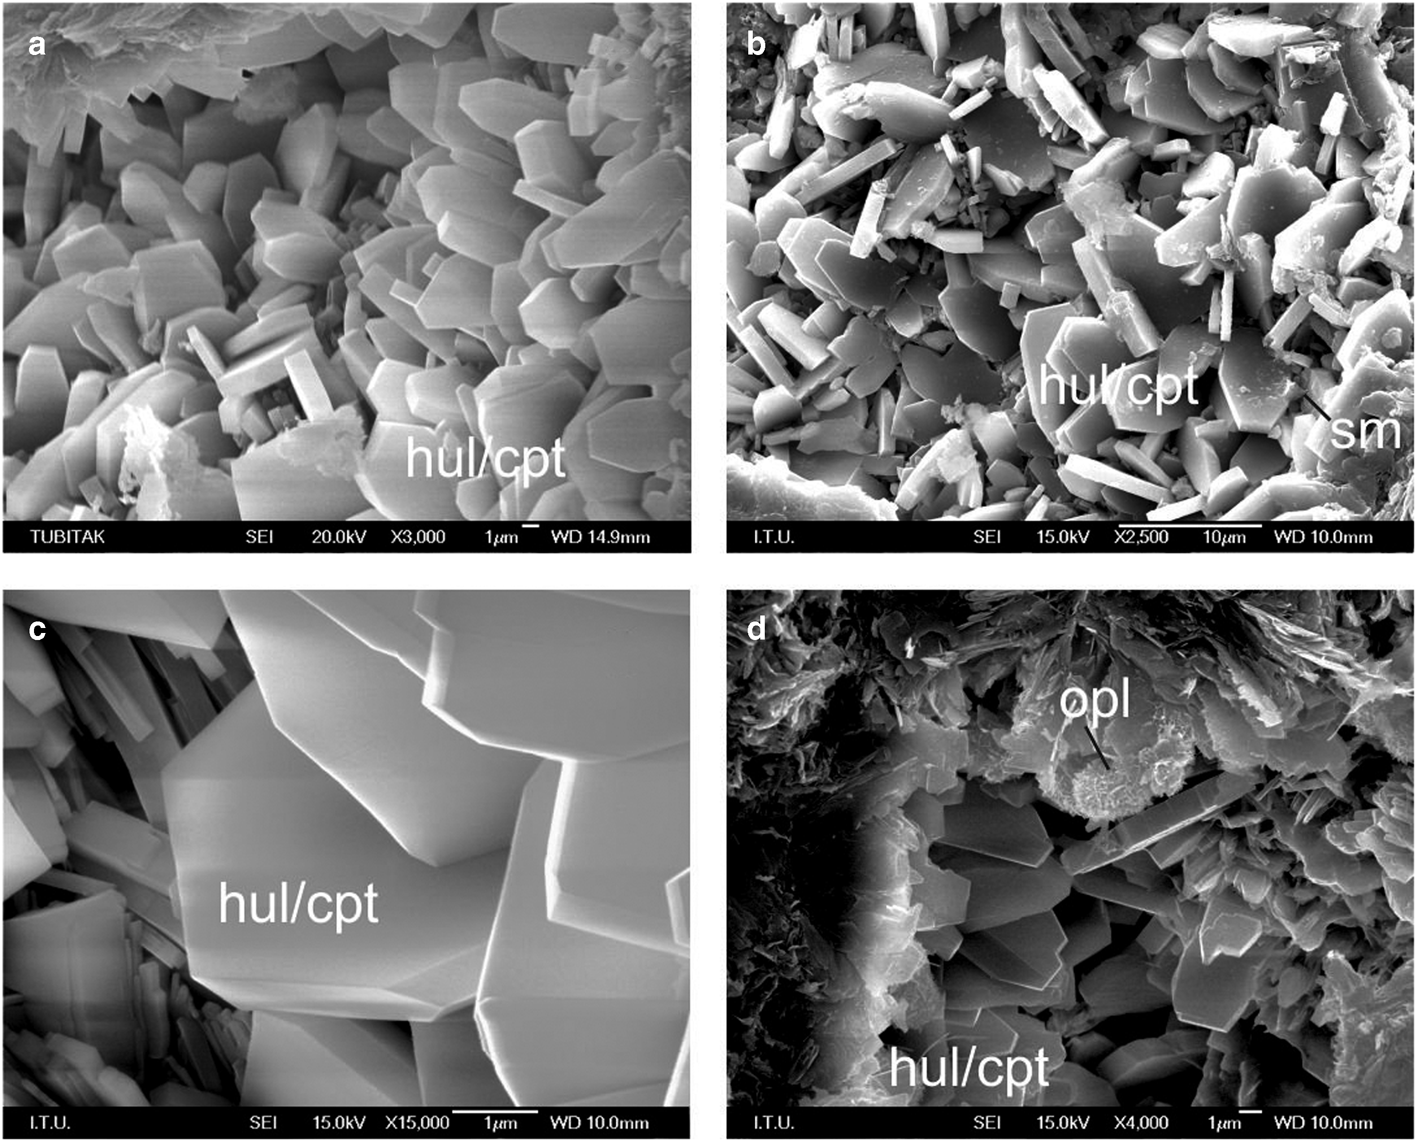
Figure 2. SEM images of the hul/cpt minerals in the studied samples. (a–d) Monoclinic plate-shaped hul/cpt grains in samples B-1, S-1, S-2 and D-7. (b) Flaky smectite (sm) formation in sample S-2 and (d) opal-CT (opl) spheres of 2–5 μm formed by thin crystallite blades in sample D-7.
Chemical composition (SEM-EDX)
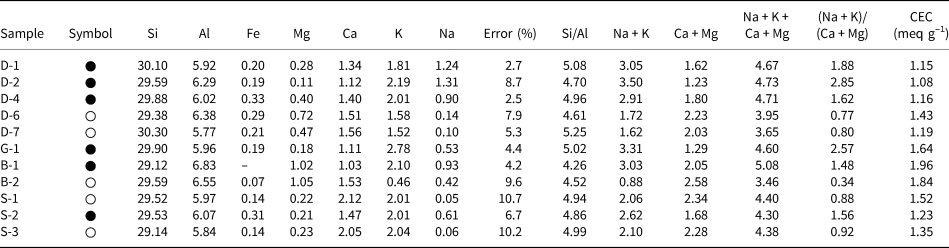
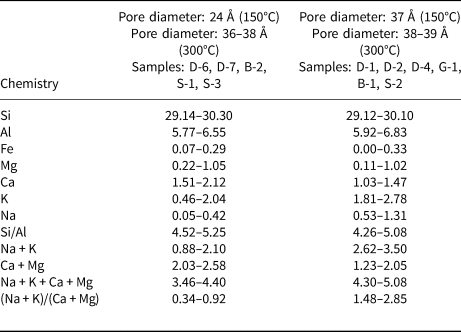
A list of unit-cell cations (SEM-EDX) and some chemical parameters of the hul/cpt minerals and also CEC values of the hul/cpt-rich tuff samples are listed in Table 2. The Si and Al contents are 29.12–30.30 and 5.77–6.83, respectively. The samples have a wide range of extra-framework cations (Mg: 0.11–1.05, Ca: 1.03–2.12, K: 0.46–2.78, Na: 0.05–1.31). The Fe content is <0.33 atoms in all samples. The Si/Al and the (Na + K)/(Ca + Mg) ratios, two of the most critical parameters for hul/cpt, are 4.26–5.25 and 0.34–2.85, respectively. The (Na + K)/(Ca + Mg) ratio is <1 in five samples (0.34–0.92; hul composition; D-6, D-7, B-2, S-1 and S-3) and >1 in six samples (1.48–2.85; cpt composition; D-1, D-2, D-4, G-1, B-1 and S-2; Table 2). The sum of the extra-framework cations (Na + K + Ca + Mg) ranges from 3.46 to 5.08 in all studied samples. This value is 4.30–5.08 in the samples with (Na + K)/(Ca + Mg) > 1 and 3.46–4.40 in the samples with (Na + K)/(Ca + Mg) < 1. The CEC of hul/cpt-rich tuff samples ranges from 1.08 to 1.96 meq g–1. The Bigadiç (B) samples have the highest CEC, whereas the Demirci (D) samples have the lowest CEC (Table 2).
Table 2. The unit-cell elemental compositions on the basis of 72 O atoms and cationic ratios of the studied hul/cpt minerals (SEM/EDX chemical analyses) and CECs of the whole-rock samples. Full circles correspond to samples with a (Na + K)/(Ca + Mg) ratio > 1 and white circles correspond to samples with a (Na + K)/(Ca + Mg) ratio < 1.
Surface characteristics (BET-specific surface area, pore volume and pore diameter)
The BET-specific surface areas, pore volumes (BJH desorption, DH desorption, HK and SF) and pore diameters (BJH desorption, DH desorption, DA, HK and SF) of the hul/cpt-rich tuff samples degassed at 150°C (12 h) are listed in Table 3. The BET-specific surface areas vary between 13.6 and 60.3 m2 g–1. Among the four regions, the Demirci (D) samples have the highest surface areas (24.9–60.3 m2 g–1 for the five samples). The pore volume (desorption) values of the samples determined using the BJH and DH methods are comparable, and the pore volumes determined using the HK and SF methods are almost identical. The pore volumes determined using the HK and SK methods are approximately a third or a quarter of those determined using the BJH and DH methods, respectively. Regardless of the method used, the pore volume differences between the samples follow the same trends.
Table 3. The specific surface area (SA), pore volume (PV) and pore diameter (PD) values of the hul/cpt-rich tuff samples degassed at 150°C under vacuum for 12 h (symbols are the same as in Table 2).
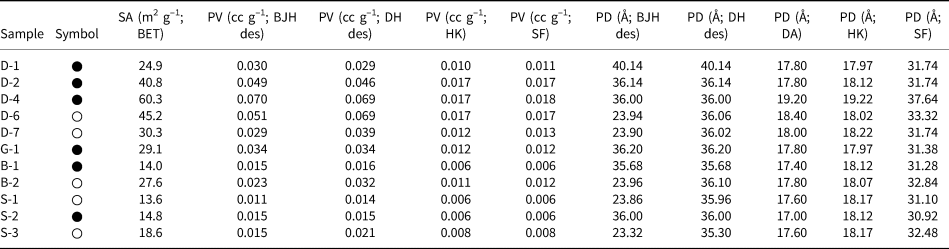
des = desorption.
To interpret comparatively the effect of degassing at different temperatures, the adsorption data of representative samples are given in Table 4. Degassing at elevated temperature resulted in a significant increase of the specific surface area and the pore volume for most of the samples. The specific surface areas increase by ~1.5 times compared to their counterparts obtained after degassing at 150°C in four of the seven samples and by four times in one sample. By contrast, a decrease in the specific surface area is observed for the D4 sample. The increase with increasing degassing temperature is much more pronounced for the pore volume (Table 4). The pore volumes displayed a 2.5–8.0-fold increase with increasing degassing temperature. Similar pore diameters were obtained as the temperature increased, which nevertheless can be divided into two groups with slightly different values (Table 4). The pore diameter values of ~24 and 37 Å after degassing at 150°C increased to 36–38 and 38–39 Å, respectively, after degassing at 300°C. There is a difference in the pore diameters of the two sample groups with different cationic compositions after treatment at both temperatures. However, this difference is large after low-temperature treatment and very small after high-temperature treatment.
Table 4. Comparison of specific surface area (SA), pore volume (PV) and pore diameter (PD) values of some of the studied samples degassed at 150°C and 300°C under vacuum for 12 and 10 h (symbols and abbreviations are the same as in Table 2).
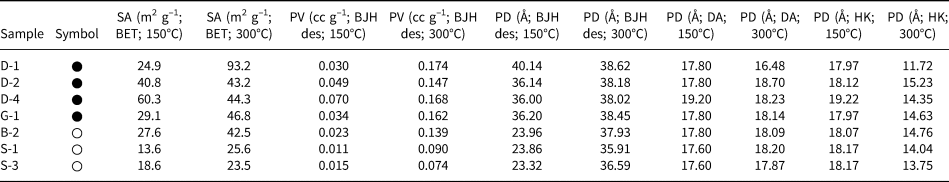
des = desorption.
Correlations of elemental compositions and cationic ratios vs physicochemical results
Degassing at 150°C for 12 h
Diagrams showing BET-specific surface area, pore volume and pore diameters (BJH desorption; 150°C) vs elemental compositions and ratios and CECs are given in Fig. 3, and the relations between the surface areas, pore volumes and pore diameters are shown in Fig. 4. The full circles correspond to samples with (Na + K)/(Ca + Mg) ratios > 1 and white circles correspond to samples with (Na + K)/(Ca + Mg) ratios < 1. There is no clear relationship between the specific surface areas of the samples and the chemical results (Fig. 3 & Tables 2 & 3). In addition, there seems to be a non-linear relationship between the CEC and specific surface area and pore volume (Fig. 3). However, a linear relationship holds between the specific surface area and pore volume (BJH desorption); with increasing pore volume, the specific surface area increases (Fig. 4 & Table 3). The relationship between specific surface area and pore volume (HK) is partially linear. However, no significant relationship is observed between the specific surface area values and the pore volumes calculated using the DH and SF methods.
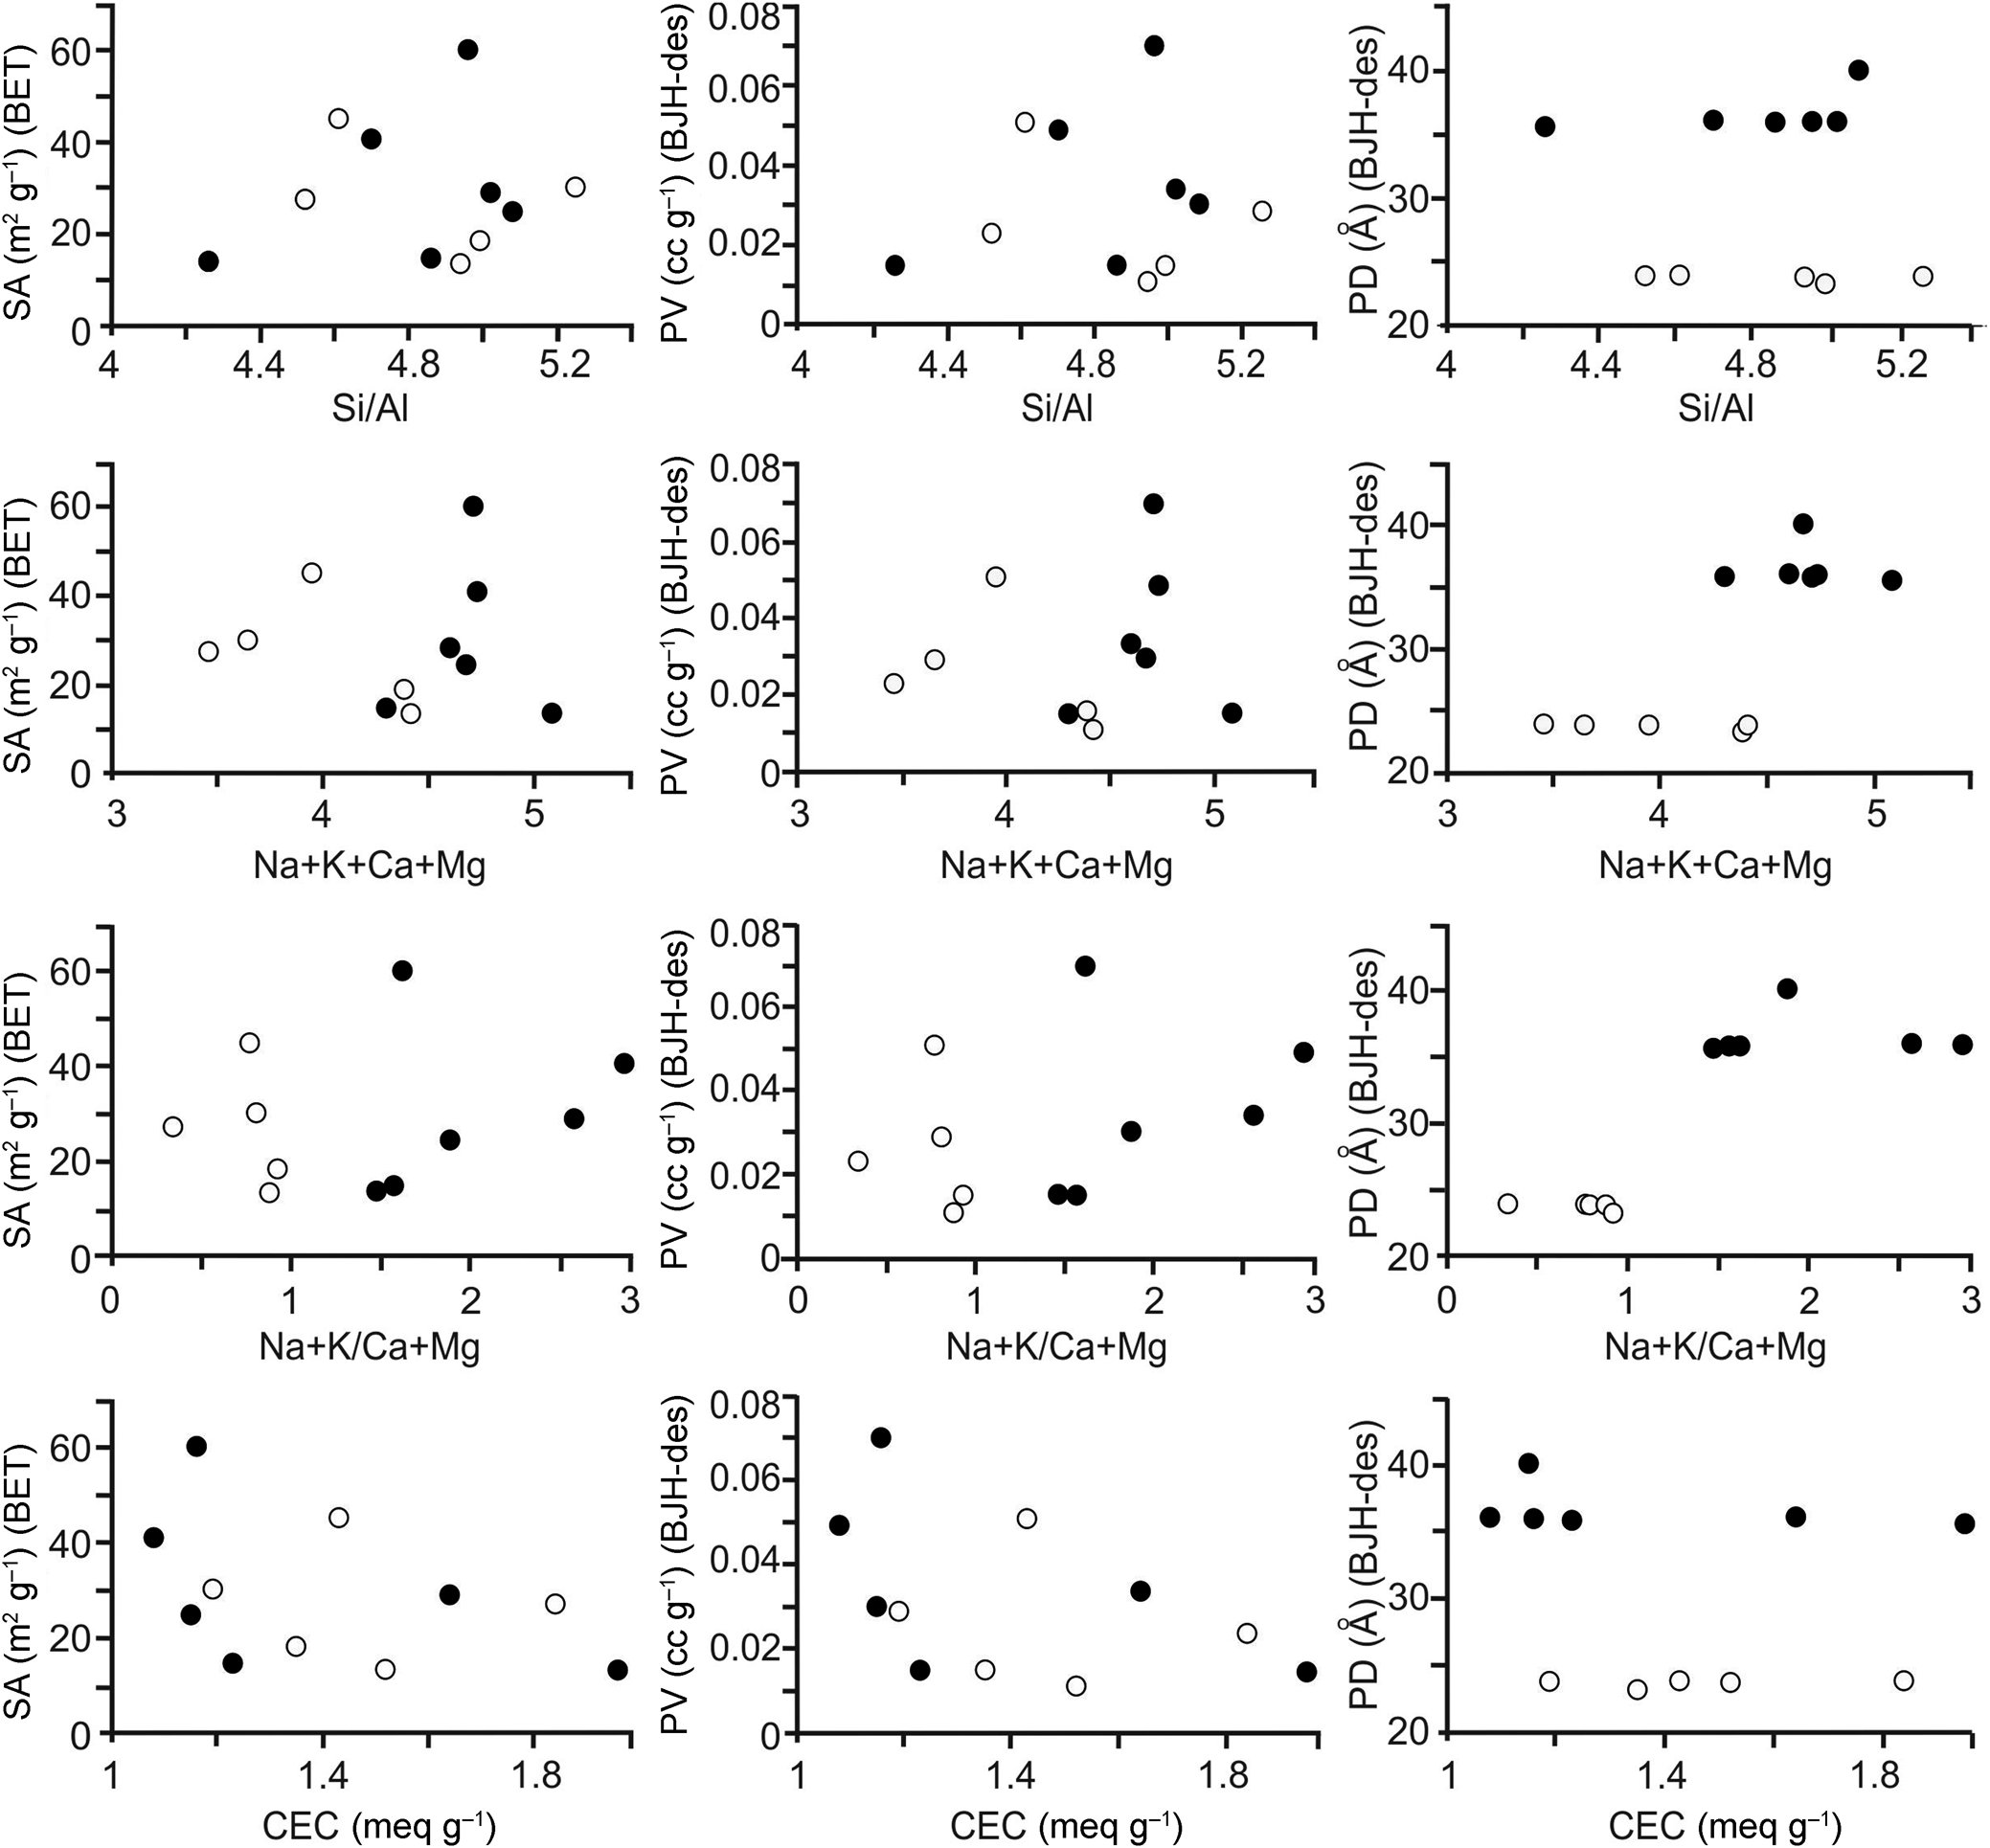
Figure 3. Diagrams of the elemental compositions and ratios vs physicochemical results for the samples degassed at 150°C for 12 h (full circles: samples with (Na + K)/(Ca + Mg) ratios > 1; white circles: samples with (Na + K)/(Ca + Mg) ratios < 1). des = desorption; PD = pore diameter; PV = pore volume; SA = surface area.
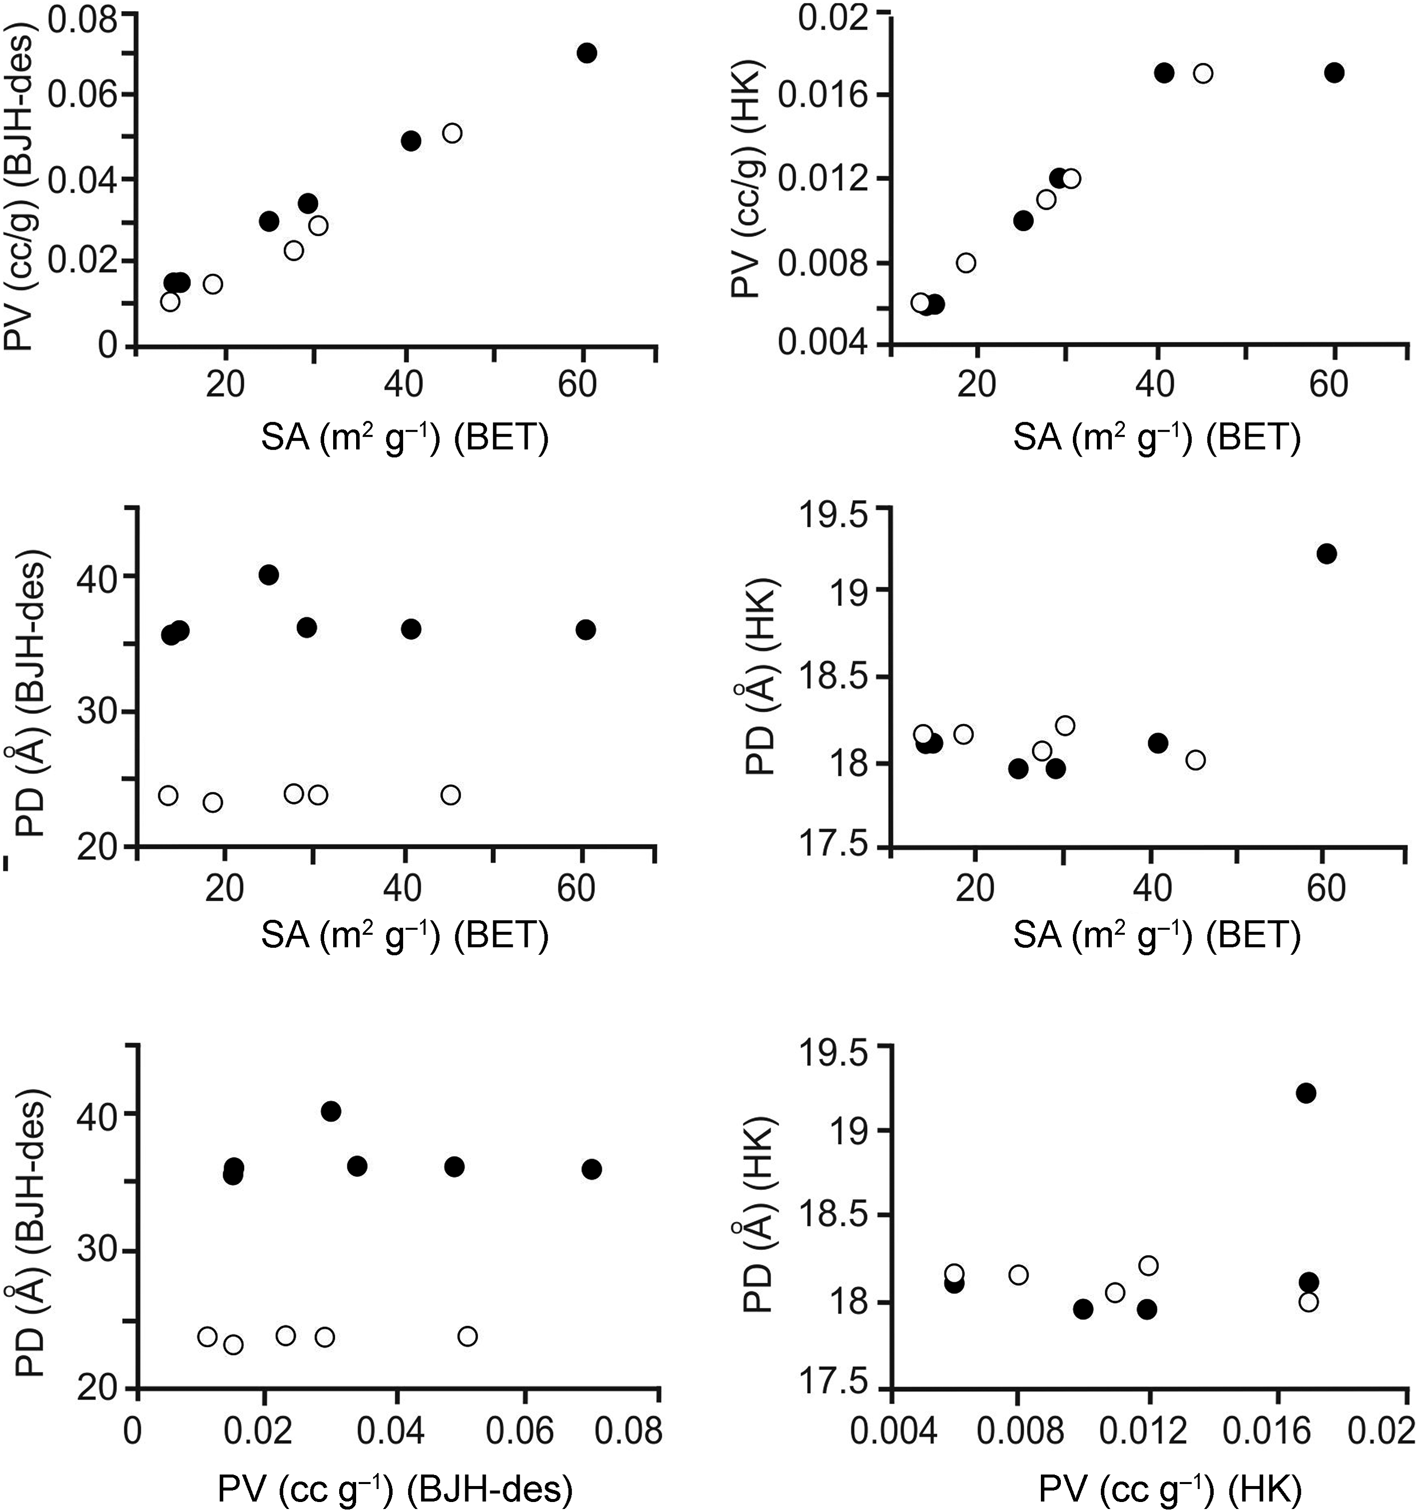
Figure 4. Diagrams showing the relationships between specific surface area (SA), pore volume (PV) and pore diameter (PD) for the samples degassed at 150°C for 12 h (full circles: samples with (Na + K)/(Ca + Mg) ratios > 1; white circles: samples with (Na + K)/(Ca + Mg) ratios < 1). des = desorption.
The pore diameters (BJH desorption) of the samples can be classified into two different groups: one group with ~24 Å pore size for five samples (range: 23.32–23.96 Å, average: 23.79 Å) and a second with ~ 37 Å pore size for six samples (range: 35.68–40.14 Å, average: 36.69 Å). Samples with pore diameters of 24 and 37 Å are located on two different sides in the diagrams of pore diameters (BJH desorption) vs the (Na + K)/(Ca + Mg) ratio and vs sum Na + K + Ca + Mg (Fig. 3). However, there are no grouping on the diagrams of chemical results vs BET surface area and pore volumes (BJH desorption; Fig. 3). There is no such grouping for the pore diameters obtained using other methods. In addition, there is no significant relationship between the pore volumes and pore diameters obtained using methods other than the BJH and the chemical results (Tables 2 & 3).
Degassing at 300°C for 10 h
The specific surface area, pore volume and pore diameter values increased with increasing degassing temperature (Table 4). The relationships between the physicochemical results and CEC and the chemical compositions are comparable for both of the degassing temperatures. Additionally, the difference between the pore volumes of the two groups with different cationic parameters is seen much more clearly in the high-temperature results.
Similar to the results observed for the samples degassed at 150°C, a linear relationship was observed between the pore volumes (BJH desorption) and the BET-specific surface areas of the samples degassed at 300°C. The specific surface area increased with increasing pore volume. No significant changes were observed in the pore diameter–specific surface area and pore diameter–pore volume relationships after degassing at 300°C.
Discussion
Several previous studies on the pore properties of hul/cpt-group zeolites yielded contradictory results because the pore sizes of hul/cpt-group zeolites did not differ between these two members. Tsitsishvili et al. (Reference Tsitsishvili, Andronikashvili, Kirov and Filizova1992) reported that cpt has different microporosity (<2 nm), mesoporosity (between 2 and 50 nm) and macroporosity (>50 nm) than hul. The same authors also reported that the unit-cell parameters and channel sizes of natural zeolites are modified with dehydration; therefore, the use of channel diameters in adsorption applications is not appropriate. Mansouri et al. (Reference Mansouri, Rikhtegar, Panahi, Atabi and Shahraki2013) reported that the porous parameter data for cpt are also ambiguous. In contrast to these previous studies, this work showed that pore size can be a distinguishing criterion for hul/cpt-group zeolites.
The cation ratios vary between the sample groups with 24 and 37 Å pore sizes (Table 5), although there is no significant difference in Si, Al, Fe and Mg cations and Si/Al and CEC values (Table 2) for the groups with different pore sizes. Christidis et al. (Reference Christidis, Moraetis, Keheyan, Akhalbedashvili, Kekelidze and Gevorkyan2003) reported that the CECs of natural hul/cpt samples from Armenia, Georgia and Greece were not associated directly with surface properties. CEC is probably more controlled by the petrographic and mineralogical characters of the parent rock and is related to the selectivity of cations for the zeolite. The presence of both zeolites and smectites in pyroclastic rocks has a positive impact on CEC. However, CEC mainly depends on the amount of zeolite in these rocks (Esenli & Sirkecioğlu, Reference Esenli and Sirkecioğlu2005; Karakaya et al., Reference Çelik-Karakaya, Karakaya and Yavuz2015). Therefore, the CEC of the samples is anticipated to increase with the zeolite content. However, it is challenging to evaluate the mineralogical differences among the samples, as all of the samples used in this study contain >80 wt.% zeolite. Apparent differences in the groups regarding Ca, K and Na are observed. The abundances of these three cations are different in groups with different pore sizes. The sum of Na + K + Ca + Mg exchangeable cations is 3.46–4.40 for the group with a 24 Å pore size and 4.30–5.08 for the group with a 37 Å pore size. The presence of a large pore size (37 Å) might indicate a higher exchangeable cation occupancy in the channels. Alberti (Reference Alberti1975) reported that hul and cpt have the same framework but that cpt has one more cation site than hul. The value of 4.4 for the sum of Na + K + Ca + Mg appears to be a boundary between the two groups. The group with a sum of Na + K + Ca + Mg higher than this value has a large pore size (37 Å), whereas the group with a sum of exchangeable cations lower than this value has a relatively narrow pore size (24 Å). The total values of monovalent (Na + K) and divalent (Ca + Mg) cations also correlate with the pore sizes. Na + K ranges from 0.88 to 2.10 for the group of samples with a 24 Å pore size and from 2.62 to 3.50 for the group of samples having a larger pore size of ~37 Å (Table 5). The boundary value for Na + K can be taken as ~2.4, with samples having a lower Na + K occupancy than this value belonging the 24 Å group and samples having a higher Na + K occupancy than this value belonging to the 37 Å group. The value of 2.04 can be considered as the boundary for Ca + Mg occupancy. Those samples with greater Ca + Mg occupancy belong to the 24 Å group (Ca + Mg: 2.03–2.58), whereas samples with lower Ca + Mg occupancy belong to the 37 Å group (Ca + Mg: 1.23–2.05). Finally, the (Na + K)/(Ca + Mg) ratios are in the range of 0.34–0.92 for the 24 Å group and 1.48–2.85 for the 37 Å group, with 1.2 being the boundary value.
Table 5. The ranges of elemental compositions and ratios in the hul/cpt minerals of the studied samples with different pore diameters (BJH desorption) degassed at 150°C and 300°C.
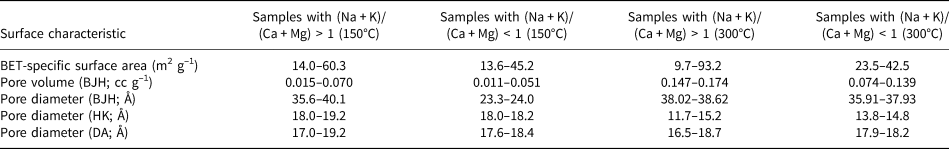
The BET-specific surface area, pore volume (BJH desorption) and pore diameter (BJH desorption, DA and HK) values of the sample groups with (Na + K)/(Ca + Mg) ratios greater and lower than 1 that were degassed at 150°C and 300°C are given in Table 6. The BET-specific surface area and pore volume results are comparable; only the pore diameters obtained using the BJH method show variations. It seems that the BJH method is more suitable for the analysis of pores in hul/cpt-group zeolites than the other methods assessed. According to Musa et al. (Reference Musa, Yin and Savory2011), the BJH method is more appropriate than the HK method for determining pore-volume distribution in zeolites and covers a far more extensive range of pore sizes.
Table 6. Surface characteristics of sample groups with (Na + K)/(Ca + Mg) ratios higher and lower than 1 after degassing at 150°C and 300°C.
The pores of hul/cpt minerals are due to their channels. The Si/Al framework and exchangeable cations and water content affect the structural arrangement in the channels, and changes in cation composition modify the amount and structural distribution of water molecules (Armbruster & Gunter Reference Armbruster and Gunter1991, Gunter et al., Reference Gunter, Armbruster, Kohler and Knowles1994; Bish & Boak, Reference Bish, Boak, Bish and Ming2001). Three cationic positions were reported in the channels of cpt (Alberti, Reference Alberti1975), and four extra-framework cation positions in the hul/cpt minerals were reported by Koyama & Takeuchi (Reference Koyama and Takeuchi1977); three of them (M1, M2 and M3) are occupied by Na, K and Ca, and the fourth (M4) is occupied by Mg. The M1 and M2 sites are rich in Na and K in cpt and rich in Ca in hul, and the occupancy of K in the M3 site is higher in cpt than in hul (Koyama & Takeuchi, Reference Koyama and Takeuchi1977; Smyth et al., Reference Smyth, Spaid and Bish1990; Armbruster & Gunter, Reference Armbruster and Gunter1991; Gunter et al., Reference Gunter, Armbruster, Kohler and Knowles1994). However, Yang & Armbruster (Reference Yang and Armbruster1996) reported additional cation sites for Rb- and Cs-exchanged hul. The gas-adsorption properties of cpt are controlled by the extra-framework cations (Ackley & Yang, Reference Ackley and Yang1991; Kouvelos et al., Reference Kouvelos, Kesore, Steriotis, Grigoropoulou, Bouloubasi and Theophilou2007; Alver & Sakızcı, Reference Alver and Sakızcı2015; Spiridonov et al., Reference Spiridonov, Sokolova, Okhlopkova, Koryakina, Shits, Argunova and Nikiforov2015; Karousos et al., Reference Karousos, Sapalidis, Kouvelos, Romanos and Kanellopoulos2016). However, it is debatable whether the extra-framework cations rather than the structures themselves control the gas-adsorption properties of cpt, inasmuch as the channels in which these cations are located have different sizes. The samples studied have two groups of pore sizes, independent of the cation content within each group. For example, when we consider the samples with 24 Å pores, the pore sizes are ~24 Å regardless of the cation type and amount. This is also the case for the samples with 37 Å pores. Therefore, there are only two groups of pore sizes, regardless of the type and amount of the exchangeable cations. This indicates a structural difference that is not controlled by the type of exchangeable cations.
Many researchers have reported the structural modifications and changes in symmetry in the structures of hul/cpt-group zeolites due to heating and dehydration. Bish & Carey (Reference Bish, Carey, Bish and Ming2001) reported that thermally induced dehydration and contractions and migration of extra-framework cations cause partial structural modifications in hul/cpt. Significant cation diffusion occurs in channels parallel to the (010) plane in the hul structure (Yang et al., Reference Yang, Stolz, Armbruster and Gunter1997). Armbruster (Reference Armbruster1993) and Uzunova & Mikosch (Reference Uzunova and Mikosch2013) reported that dehydration causes cation diffusion within the channels, and cations can migrate from a narrow channel to a large channel via Al–Si substitution and heating. Armbruster (Reference Armbruster2001) also observed that the symmetry in some cation-exchanged huls changed from C2/m topological symmetry to Cm or C1 due to partial Si,Al ordering and the low-symmetry site preference of extra-framework cations. Although diffusion causes the migration of cations, it might not change the pore size, at least not significantly. However, Christidis et al. (Reference Christidis, Moraetis, Keheyan, Akhalbedashvili, Kekelidze and Gevorkyan2003) reported that both microporosity and specific surface area decreased in hul after heating due to partial decomposition and/or sintering of the hul crystals.
Chemical and thermal stability data are already used for hul/cpt definitions and distinctions. Thermal stability data for three of the samples studied (G-1, B-1 and B-2) have been reported by Esenli & Kumbasar (Reference Esenli and Kumbasar1998). These samples were heated at 400°C and 550°C for 12 h and then were analysed using XRD to determine the changes in the position and intensity of the 020 peaks on the hul/cpt XRD traces. There was an insignificant loss of intensity of the 020 peaks after heating at 550°C in both G-1 (cpt) and B-1 (cpt). In the B-2 sample, the 020 peak was still observed despite a great loss of intensity after heating at 550°C (type-2, hul). Samples G-1 and B-1, thermally defined as cpt, are amongst the samples with the highest Na + K and the lowest Ca + Mg (Table 2). The opposite is the case for the cation contents of the B-2 sample, thermally defined as hul. Interestingly, the surface areas and pore volumes are different in the G-1 and B-1 samples, which can be considered to be cpt due to the type of exchangeable cations and the thermal character. However, the specific surface area and pore volume of sample B-2, considered to be hul, after degassing at 150°C and 300°C are very similar to those of sample G-1 (cpt). Alberti & Vezzalini (Reference Alberti and Vezzalini1983) explained the thermal stability in hul/cpt as a structural feature rather than being due to chemical properties. They reported a shifting in a cation site related to the occupancy of cations after thermal treatment. Although our study did not control this change, the maximum increase in pore volume values (from 0.023 to 0.139 cc g–1) with increasing degassing temperature occurred in the B-2 sample, which had the lowest cation occupancy (Na + K + Ca + Mg: 0.34; Tables 2 & 3). However, when the degassing temperature increased from 150°C to 300°C, the pore diameters of the samples with a hul composition changed markedly, whereas they remained almost unchanged in the samples with a cpt composition.
Conclusions
Nitrogen adsorption on hul/cpt-group natural zeolites is more dependent on the pore size of the zeolite minerals than on other characteristics. Although the differences are related to the different exchangeable cations of these minerals, the main difference is in the pore dimensions. The specific surface areas and pore volumes of the hul/cpt-rich natural tuff samples are not related to the pore sizes of the samples and the chemical compositions of the hul/cpt minerals. However, the pore size is related to the extra-framework cation types and occupancy in the hul/cpt minerals. Degassing at 150°C allowed for the categorization of the samples into two groups based on their pore sizes: a group with a pore diameter of ~24 Å and another with a pore diameter of ~37 Å. The sums of exchangeable cations (Na + K + Mg + Ca) and the (Na + K)/(Ca + Mg) ratios differ significantly between these two groups. However, only slight differences in pore size were observed after degassing at 300°C. With increasing degassing temperature, the pore size increased significantly in the group with (Na + K)/(Ca + Mg) < 1 and became slightly larger in the group with (Na + K)/(Ca + Mg) > 1. The specific surface area and pore volume increased with temperature, but no significant differences were observed between the various cationic groups. Consequently, the pore size obtained via gas adsorption may be useful in identifying hul/cpt minerals and can be considered to be structural parameter.
Acknowledgements
We thank the anonymous reviewers and the Principal Editor, George Christidis, for their constructive reviews, suggestions and editorial comments that significantly improved the quality of the paper.
Conflicts of interest
The authors declare none.


 Open access