1 Introduction
Electric vehicles (EVs) are a transportation alternative that can reduce greenhouse gas (GHG) emissions and increase energy security. The environmental and social benefits of EVs can be realized only through massive public adoption. A recent review of major EV markets in USA, European Union, and East Asia showed that government investment through public policy can lead to EV market growth (Mock & Yang Reference Mock and Yang2014). A quantitative investigation on the relationship among policy, market share, and consumer preferences for the US and Chinese markets reported in Helveston et al. (Reference Helveston, Liu, Feit, Fuchs, Klampfl and Michalek2015) showed that preference differences across the two cultures result in distinct EV adoption patterns.
A variety of policies have been implemented in different countries, including (a) investment in research and development, (b) infrastructure subsidies (e.g., for building charging stations), and (c) customer-related incentives (e.g., purchase bonus, reduced tax, and electricity cost discount). Mock & Yang (Reference Mock and Yang2014) showed how policy emphasis shapes markets differently; for instance, Norway now has the largest Battery EV (BEV) market share due to its high BEV incentives (e.g., low electricity cost and low taxes) and high fuel cost; the Netherlands has the fastest-growing market in Plug-in Hybrid Electric Vehicles (PHEV) due to substantially higher incentives than other markets. While that study confirmed qualitatively the impact of public policy on EV adoption, it remains unclear how policies should be designed to shape the market according to government desired roadmaps. As Morrow et al. (Reference Morrow, Gallagher, Collantes and Lee2010) highlighted in a recent US EV market study, implementing existing policy instruments alone will fail to meet the 2020 GHG emission goal set by the US government.
A similar study of the Chinese market by Hao et al. showed that implementing policy measures and assuming full compliance still yields a passenger fleet in 2020 that produces twice the government’s GHG emissions target (Hao, Wang & Ouyang Reference Hao, Wang and Ouyang2011). A marketing study by Helveston et al. conducted in USA and China reports that while US and Chinese subsidies are similar in favoring vehicles with larger battery packs, differences in customer preferences lead to different adoption outcomes (Helveston et al. Reference Helveston, Liu, Feit, Fuchs, Klampfl and Michalek2015). These studies show that government policies may not always lead to intended government goals, and suggest that a more quantitative understanding of the interacting decisions by all stakeholders in the EV market would be valuable in analyzing potential policy decisions.
This article looks at the EV market as a product–service system. We model the EV market quantitatively using a game-theoretic approach (Michalek, Papalambros & Skerlos Reference Michalek, Papalambros and Skerlos2004; Shiau & Michalek Reference Shiau and Michalek2009a ,Reference Shiau and Michalek b ; Frischknecht, Whitefoot & Papalambros Reference Frischknecht, Whitefoot and Papalambros2010), as established in previous research in design for market systems (Wassenaar & Chen Reference Wassenaar and Chen2003; Michalek, Feinberg & Papalambros Reference Michalek, Feinberg and Papalambros2005; Lewis, Chen & Schmidt Reference Lewis, Chen and Schmidt2006; Michalek et al. Reference Michalek, Ebbes, Adigüzel, Feinberg and Papalambros2011), and we specifically include service infrastructure (charging station) decisions. We assume three stakeholders – government, manufacturers, and infrastructure operators – can make decisions toward their own goals or for shared goals. Further, we assume the government considers three types of public investment related to EVs, as realized in USA: (a) Manufacturer subsidy for EV production, (b) infrastructure subsidy for building charging stations and electricity cost cut, and (c) one-time EV purchase discount and annual tax cut for consumers. Policies on research investment have a long-term effect and are not considered here.
The model assumes the EV manufacturer positions its product (a BEV or PHEV) by setting the vehicle price and designing its battery and powertrain system. The market also comprises a single conventional vehicle with fixed design. The charging station operator determines the number and locations of charging stations and sets the charging service fee. The government decides where and how much to invest. We compare optimal decisions by the three stakeholders under different scenarios: (S1a) All three share the objective to maximize emissions reduction without losing money, (S1b) same as (S1a) but the objective is to maximize profit; (S2) the EV manufacturer seeks maximum profit, while the government owns the charging service and seeks minimum emissions; (S3) the manufacturer and charging station operator maximize their individual profit, while the government minimizes emissions. The model considers profit due only to the product design decisions under consideration.
These scenarios correspond to business models that may be adopted by the stakeholders. The optimization results, obtained under typical assumptions, indicate how the government budget should be allocated to the EV manufacturer, consumer, and charging station operator to meet the government’s goal. Parametric studies further explore how different budget levels affect emission reduction and profits. Additional model assumptions are detailed below.
The remainder of the paper is structured as follows. Section 2 provides background knowledge and reviews existing research in EV modeling, public policy, and product–service design optimization. Section 3 introduces the proposed framework and elaborates on modeling details and assumptions for the selected cities of Ann Arbor, Michigan, USA, and Beijing, China. Section 4 presents the game equilibrium results for the three scenarios above and for various parameter settings, and examines causes for the differences in results from these scenarios. Section 5 provides conclusions and suggestions for future work.
2 Background
To understand how public policy impacts the EV market sector, several models must be connected: (i) An engineering model simulates vehicle performance and GHG emissions for different mechanical and electrical designs; (ii) a business model for charging service estimates expected profit by considering charging station allocation, service fee, infrastructure cost, and government subsidy; and (iii) a marketing demand model estimates preferences to predict consumer purchase decisions for given product, service and incentive alternatives. A large body of research has addressed such models, individually or in combination. In this section, we provide some background on the extant literature and related modeling work. We also summarize assumptions made to enable tractable search for the market equilibrium solution.
2.1 Public policy and the EV market
Several studies have been conducted to understand how public policy affects consumer choices, manufacturer decisions, and EV market growth. Gallagher et al. studied US vehicle market trends from 2000 to 2006 and associated them with state and federal public policies implemented during the same period (Gallagher & Muehlegger Reference Gallagher and Muehlegger2011). Their findings suggest that growth in EV adoption is mostly caused by rising gasoline prices and social preferences rather than by implementing public policies; among all policy measures, sales tax incentives have the greatest effect, being perceived as an instant monetary return. A more recent study by Morrow et al. showed that sales tax incentives would be too expensive to implement, with an unintended effect of decreasing new conventional vehicle fuel economy (Morrow et al. Reference Morrow, Gallagher, Collantes and Lee2010). Consistent with Gallagher & Muehlegger (Reference Gallagher and Muehlegger2011), Morrow et al. favor a fuel tax increase ahead of EV sales tax incentives as the most effective measure for GHG emission reduction. Egbue and Long’s survey suggested that investments in non-tax-related measures such as education on EV technologies, battery swap programs, and strong warranties on batteries are necessary for improving EV adoption (Egbue & Long Reference Egbue and Long2012). Scant knowledge regarding fuel economy by US consumers was also pointed out in (Greene & Plotkin Reference Greene and Plotkin2011). Skerlos and Winebrake suggested tax credits be targeted at regions where PHEV technology has high social benefits (e.g., with high vehicle miles traveled (VMT) and availability of charging infrastructure), and be dependent on consumer income (Skerlos & Winebrake Reference Skerlos and Winebrake2010).
Beyond the US market, Brand et al. investigated the role of a variety of consumer-related incentives in the UK (Brand, Anable & Tran Reference Brand, Anable and Tran2013). Their study also showed that car purchase taxes and ‘feebates’ are more effective in accelerating EV adoption than road taxes and scrappage incentives (scrappage schemes co-funded with the manufacturers aim at increasing automobile demand). Hao et al. analyzed a set of policy instruments for the Chinese market, with constrained vehicle license and vehicle downsizing being the most effective measures, followed by EV promotion and strengthened fuel economy standard (Hao et al. Reference Hao, Wang and Ouyang2011). The study, however, assumed full compliance to the policies by all stakeholders in the market.
Yabe et al. proposed an optimization framework for passenger EVs and the power grid. Their analysis predicted trends of EV adoption rate along with battery unit change and EV life cycle costs from 2010 to 2050, assuming that consumers switch to EVs once their life cycle costs become more economical than conventional vehicles. Their results also suggested the necessity of government intervention for EV penetration (Yabe et al. Reference Yabe, Shinoda, Seki, Tanaka and Akisawa2012). The study by Helveston et al. (Reference Helveston, Liu, Feit, Fuchs, Klampfl and Michalek2015) modeled consumer preferences for conventional, hybrid electric, plug-in hybrid electric, and battery EVs in China and USA using 2012–13 data from choice-based conjoint surveys. They found gasoline vehicles to be most attractive in both countries and a much lower relative willingness to pay for BEVs in USA. They also found that with or without each country’s 2012–13 subsidies, Chinese consumers were willing to adopt current BEVs and mid-range PHEVs at similar rates as the respective gasoline vehicles, whereas US consumers preferred low-range PHEVs despite subsidies.
Besides consumer choices, manufacturers’ decisions are affected by public policies, occasionally in unintended ways. Michalek et al. proposed to analyze the influence of government policies by combining decision models of consumers and manufacturers. Within a game-theoretic framework, they showed that policies trigger manufacturers to produce more efficient vehicles of higher costs (Michalek et al. Reference Michalek, Papalambros and Skerlos2004). Nonetheless, in investigating the automakers’ reactions to revised US Corporate Average Fuel Economy (CAFE) standards, Whitefoot et al. predicted an increase in market share of companies that choose to violate the 2011 US CAFE standard by offering heavier pickup trucks, thus offsetting potential fuel efficiency improvements by the standard (Whitefoot & Skerlos Reference Whitefoot and Skerlos2012). Frischknecht and Papalambros investigated quantitatively the trade-off between the public goal of GHG emission reduction and the private pursuits of profit under degrees of alignment of the two (Frischknecht & Papalambros Reference Frischknecht and Papalambros2008). Concerning the charging station operators’ role, Schroeder and Traber predicted that low EV adoption rate and competition between public and private charging facilities will cause low profitability for public fast-charging services in Germany. They also suggested temporally variable grid tariff exemption be the treatment to incentivize charging operators and investors (Schroeder & Traber Reference Schroeder and Traber2012).
These reports suggest that a more elaborate, holistic assessment of a policy’s impact may be gained with comprehensive quantitative models that connect all stakeholders in the EV market.
2.2 EV engineering design
The powertrain design of an EV directly governs its fuel economy. A typical BEV powertrain consists of a battery pack and one or more motors connecting to wheels through a final (reduction) drive. In addition to these, a PHEV has an internal combustion engine and a transmission that combines and distributes the power from the engine and motors to the final drive. Figure 1 shows the BEV and PHEV powertrain systems for the Nissan Leaf and Toyota Prius models, respectively, along with powertrain components. A battery pack consists of battery cells connected in series to form a branch, and multiple branches connected in parallel. The battery voltage and current limits are dependent on the number of series and parallel connections, respectively, and these further limit the power output from the motors. In addition, the size of the battery pack influences the weight of the vehicle and thus its MPG, acceleration performance, and emissions.

Figure 1. Typical EV powertrain systems and components: Nissan Leaf and Toyota Prius powertrain diagrams.
The final drive transforms high speed and low torque input from the transmission (or directly from the motor in BEVs) to low speed and high torque output to the wheels. The ratio between the input and output speed is the final drive ratio: a higher ratio leads to larger torque for launching the vehicle from a lower to a higher speed and thus better acceleration performance, while a lower ratio allows higher maximum vehicle speed. The final drive ratio significantly affects vehicle fuel economy and emissions, and must be fine-tuned for given vehicle specifications and driving conditions. Some HEVs and PHEVs use planetary (epicyclic) gear sets to decouple the engine from external power requirements in order to run in higher efficiency speed–torque regions.
Fuel economy and emissions can be improved at three levels: component, Architecture, and control. At the component level, the battery, motor(s), and engine are sized to meet target driving requirements, e.g., short-range city drive or long-range highway drive. A detailed review of battery technology choices for PHEV applications can be found in Axsen, Burke & Kurani (Reference Axsen, Burke and Kurani2008). The components are connected through a transmission to form a driving mode. Multiple driving modes can be integrated and switched over to allow high torque and fuel efficiency for different driving conditions, e.g., vehicle launching (high torque, low speed) or highway cruising (low torque, high speed). The collection of driving modes is referred to as an architecture or configuration. Notable architectures include the single-mode Toyota hybrid system (Hermance Reference Hermance1999; Liu, Peng & Filipi Reference Liu, Peng and Filipi2005) and the four-mode Volt plug-in hybrid system (Zhang et al. Reference Zhang, Li, Kum and Peng2012). For a given architecture, a control unit is designed to convert ‘throttle’ signals from the driver to operation commands to the engine and motor(s), so as to achieve near-optimal fuel consumption while meeting performance requirements such as 0–60 mph acceleration. In the vehicle design phase, offline optimal control policies are determined using Dynamic Programming (DP), Pontryagin’s Minimum Principle (PMP) or Equivalent Consumption Minimization Strategy (ECMS), and are implemented into rule-based online control strategies. Existing research has addressed modeling and design of both mechanical and electrical components (Liu et al. Reference Liu, Peng and Filipi2005; Zhang et al. Reference Zhang, Li, Kum and Peng2012; Ahn, Bayrak & Papalambros Reference Ahn, Bayrak and Papalambros2013), architectures (Liu Reference Liu2007; Raghavan, Bucknor & Hendrickson Reference Raghavan, Bucknor and Hendrickson2007; Liu & Peng Reference Liu and Peng2010; Bayrak, Ren & Papalambros Reference Bayrak, Ren and Papalambros2013; Zhang, Peng & Sun Reference Zhang, Peng and Sun2013; Bayrak, Kang & Papalambros Reference Bayrak, Kang and Papalambros2015), and optimal control policies for particular architectures (Paganelli et al. Reference Paganelli, Delprat, Guerra, Rimaux and Santin2002; Delprat et al. Reference Delprat, Lauber, Guerra and Rimaux2004; Liu et al. Reference Liu, Peng and Filipi2005; Ahn, Cho & Cha Reference Ahn, Cho and Cha2008; Kim, Kim & Kim Reference Kim, Kim and Kim2008; Serrao, Onori & Rizzoni Reference Serrao, Onori and Rizzoni2009; Stockar et al. Reference Stockar, Marano, Rizzoni and Guzzella2010; Kim, Cha & Peng Reference Kim, Cha and Peng2011).
2.3 Design for market systems
Design for market systems research emerged from looking at products from the perspective of the producer who aims to maximize expected value (e.g., profit and social welfare) from selling a product rather than the purely engineering perspective of optimizing functional performance metrics, even if including cost (Wassenaar & Chen Reference Wassenaar and Chen2003; Michalek et al. Reference Michalek, Feinberg and Papalambros2005; Lewis et al. Reference Lewis, Chen and Schmidt2006; Michalek et al. Reference Michalek, Ebbes, Adigüzel, Feinberg and Papalambros2011). Product design for market systems is cast as a mathematical optimization problem to find the optimal design that maximizes the expected profit while satisfying engineering and other constraints. To formulate the optimization problem, the relations between functionality and design decisions derived typically in engineering analysis through physics-based models and simulations must be augmented by economic models that link design decisions with profit via product demand and production cost.
Quantitative demand models are used in marketing extensively to express customer preferences (demand) as a function of design attributes and price. To incorporate such demand models in the design problem we must also express the design attributes as functions of the design variables that the designer can control directly. Deriving the mapping from design attributes to design variables is not always straightforward, particularly for subjective attributes such as aesthetics, and is a research problem in its own right. An example of a social constraint is government regulation, such as on vehicle fuel economy and safety.
We now briefly review how design decisions are modeled quantitatively. We represent a product or system design in the market with a vector of design attributes
![]() $\mathbf{a}$
that are the product properties perceived by the user. These attributes have a particular set of values for a particular market instantiation of the product. Attributes must be then expressed as functions of the design variables
$\mathbf{a}$
that are the product properties perceived by the user. These attributes have a particular set of values for a particular market instantiation of the product. Attributes must be then expressed as functions of the design variables
![]() $\mathbf{x}$
that are the actual decisions made by the producer/designer. In EV design, design variables may be the number of battery cells and final drive ratio, while design attributes may be vehicle fuel economy and acceleration. The predicted market demand for a design can be expressed as
$\mathbf{x}$
that are the actual decisions made by the producer/designer. In EV design, design variables may be the number of battery cells and final drive ratio, while design attributes may be vehicle fuel economy and acceleration. The predicted market demand for a design can be expressed as
![]() $q(\mathbf{a})$
where
$q(\mathbf{a})$
where
![]() $\mathbf{a}$
includes design attributes and price
$\mathbf{a}$
includes design attributes and price
![]() $p$
. With unit production cost denoted as
$p$
. With unit production cost denoted as
![]() $c(\mathbf{x})$
, the profit maximization design problem is stated as
$c(\mathbf{x})$
, the profit maximization design problem is stated as
The feasibility of
![]() $\mathbf{x}$
is expressed by a potentially large and complicated set of constraint functions, possibly computed through simulations, that assure the product’s functionality, manufacturability, and satisfaction of regulatory and other requirements. These constraints are functions of the design variables
$\mathbf{x}$
is expressed by a potentially large and complicated set of constraint functions, possibly computed through simulations, that assure the product’s functionality, manufacturability, and satisfaction of regulatory and other requirements. These constraints are functions of the design variables
![]() $\mathbf{x}$
.
$\mathbf{x}$
.
The market demand
![]() $q(\mathbf{a})$
is forecast by multiplying the market potential (market size)
$q(\mathbf{a})$
is forecast by multiplying the market potential (market size)
![]() $s$
and the choice probability (expected share of the market)
$s$
and the choice probability (expected share of the market)
![]() $P(\mathbf{a})$
. Determining the function
$P(\mathbf{a})$
. Determining the function
![]() $P(\mathbf{a})$
is referred to as preference elicitation or preference learning, a subject of study in marketing research. In a market consisting of
$P(\mathbf{a})$
is referred to as preference elicitation or preference learning, a subject of study in marketing research. In a market consisting of
![]() $M$
pre-existing competing products with design attributes
$M$
pre-existing competing products with design attributes
![]() $\mathbf{a}^{(m)}$
for
$\mathbf{a}^{(m)}$
for
![]() $m=1,\ldots ,M$
, the commonly used logit model estimates the choice probability
$m=1,\ldots ,M$
, the commonly used logit model estimates the choice probability
![]() $P(\mathbf{a})$
for the new product design as
$P(\mathbf{a})$
for the new product design as
where the vector
![]() $\mathbf{w}$
contains the individual attribute part worths, a set of weights that reflect the importance of each design attribute for the target customer group. The vector product
$\mathbf{w}$
contains the individual attribute part worths, a set of weights that reflect the importance of each design attribute for the target customer group. The vector product
![]() $\mathbf{w}^{T}\mathbf{a}$
represents the utility of a design, i.e., how much consumers prefer the design. The term
$\mathbf{w}^{T}\mathbf{a}$
represents the utility of a design, i.e., how much consumers prefer the design. The term
![]() $e^{V}$
reflects the utility,
$e^{V}$
reflects the utility,
![]() $V$
, of choosing none of the products. When a variety of preferences exists in a consumer group (market heterogeneity), the mixed logit model can be used. This model assumes that the individual part worths follow a probability distribution of given type, typically either discrete (latent class) or multivariate normal (McFadden & Train Reference McFadden and Train2000; Train Reference Train2009).
$V$
, of choosing none of the products. When a variety of preferences exists in a consumer group (market heterogeneity), the mixed logit model can be used. This model assumes that the individual part worths follow a probability distribution of given type, typically either discrete (latent class) or multivariate normal (McFadden & Train Reference McFadden and Train2000; Train Reference Train2009).
The data required for the choice probability estimation above can be collected through either existing market sales data (revealed preferences) or questionnaires answered by potential customers (stated data). The latter is more common for studying customer response to novel products, such as EVs. A classical questionnaire for part-worth estimation is the Choice-Based Conjoint (CBC) analysis (or discrete choice analysis) (Netzer et al. Reference Netzer, Toubia, Bradlow, Dahan, Evgeniou, Feinberg, Feit, Hui, Johnson and Liechty2008; Train Reference Train2009). The questionnaire consists of a series of choice questions. In each question, a set of designs with different attribute combinations is presented to the participant and one of them must be chosen as a preferred one. In some questionnaires, the participant is also allowed to choose none of the alternatives if none are acceptable.
In the mixed logit model, prior specification of the type of consumer part-worth distribution and the actual participant responses collected from the CBC study are used to estimate the posterior individual-level part-worth distribution. The estimation of the part-worth distribution and inference of individual part worths is done using either hierarchical Bayes estimation (Train Reference Train2001; Rossi, Allenby & McCulloch Reference Rossi, Allenby and McCulloch2005) or convex optimization (Evgeniou, Pontil & Toubia Reference Evgeniou, Pontil and Toubia2007). Accuracy and efficiency of part-worth estimation can be improved by introducing social (Brock & Durlauf Reference Brock and Durlauf2001) and contextual (He et al. Reference He, Chen, Hoyle and Yannou2012) information, and by utilizing adaptive questionnaires (Abernethy et al. Reference Abernethy, Evgeniou, Toubia and Vert2008; Ren, Scott & Papalambros Reference Ren, Scott and Papalambros2013).
While general market share prediction modeling has mature theory and available computational tools, the particular prediction of future EV adoption is an ongoing research challenge, requiring, for example, quantification of consumers’ knowledge in EV technology to measure adoption barriers (Egbue & Long Reference Egbue and Long2012).
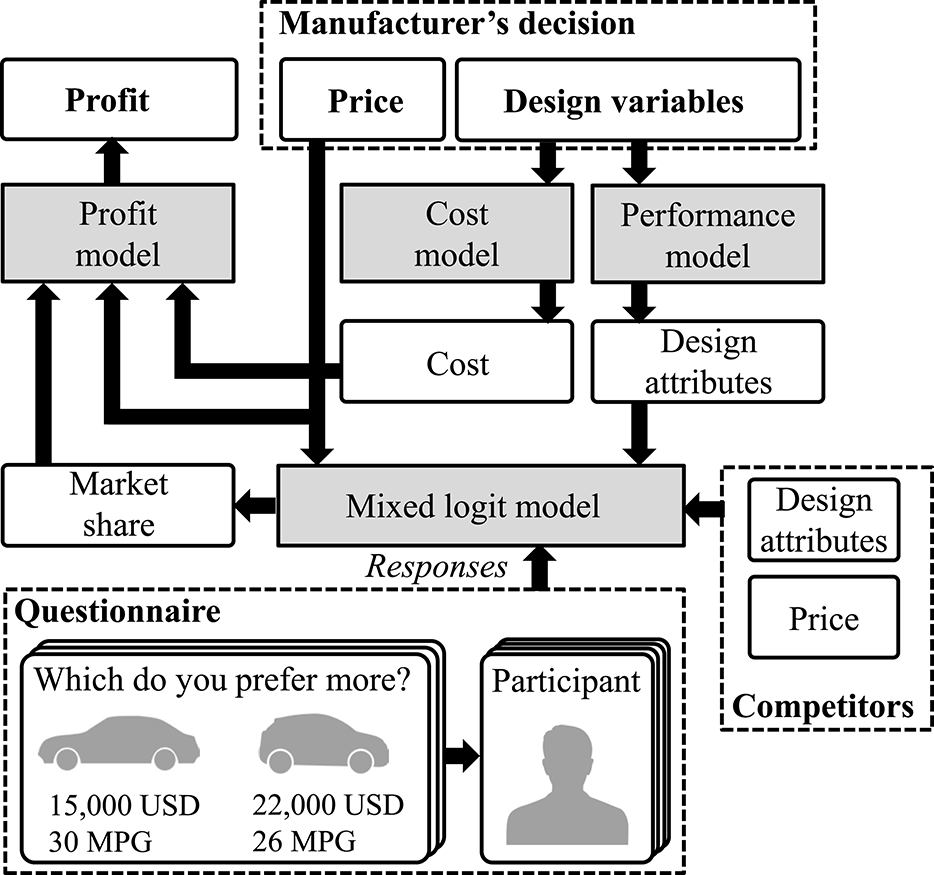
The information flow for modeling the profit maximization problem from the EV manufacturer’s perspective is summarized in Figure 2.
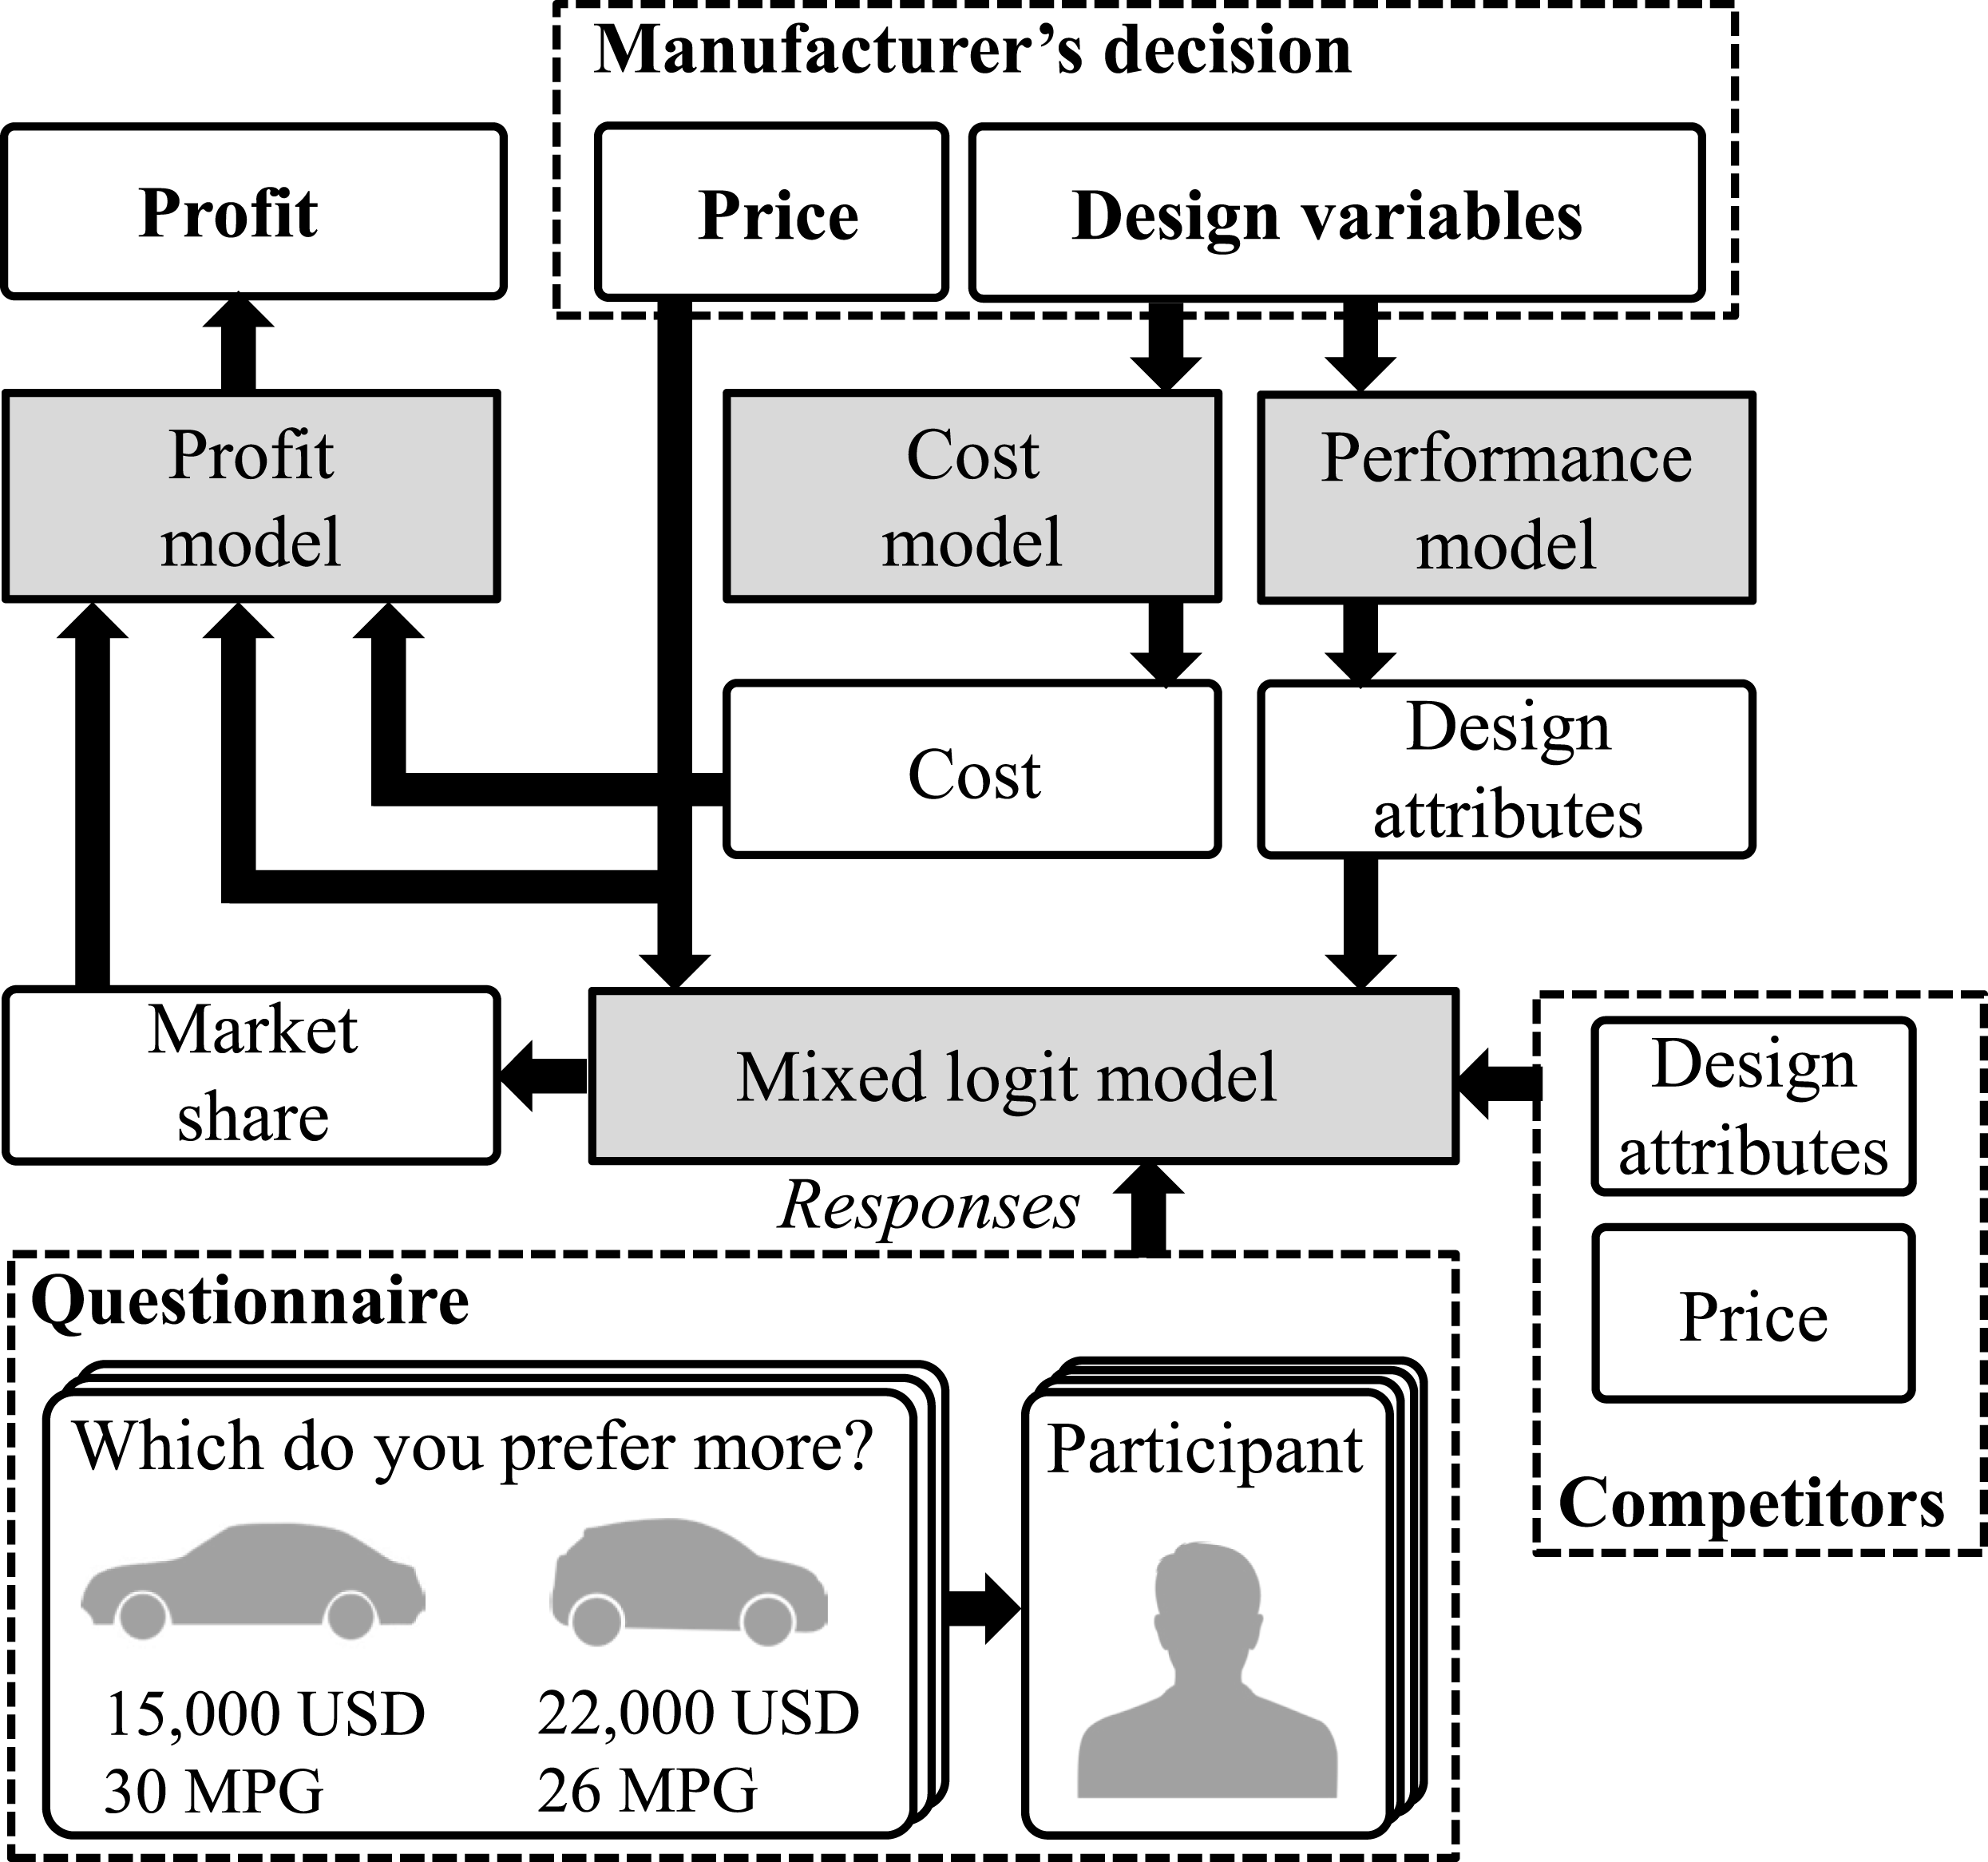
Figure 2. Information flow for the EV manufacturer’s profit maximization model.
In a market with multiple stakeholders, each stakeholder has its own objective. Depending on the scenario, the stakeholders could combine their objectives in the optimization formulation (a collaboration scenario) or aim to optimize their own profit (a cooperation scenario that assumes all information is shared by all stakeholders). In the latter case, a game-theoretic model for the market can be set up to reach an equilibrium where no further decisions are made. When the first order optimality conditions of equilibrium can be derived analytically, the solution to these conditions can be found numerically; see Morrow and Skerlos on finding Bertrand–Nash equilibrium prices for product market models based on the mixed logit model (Morrow & Skerlos Reference Morrow and Skerlos2011). However, most engineering models rely on simulations and experimental data, and analytical derivation of first order conditions is rarely possible. In this situation, optimization for each stakeholder can be performed sequentially until no further improvement in any of the individual objectives can be made; see Michalek et al. (Reference Michalek, Papalambros and Skerlos2004), Shiau & Michalek (Reference Shiau and Michalek2009a ,Reference Shiau and Michalek b ), and Frischknecht et al. (Reference Frischknecht, Whitefoot and Papalambros2010) for examples.
2.4 EV product–service system design
Service optimization aims to maximize service profit accounting for consumer preferences with respect to service attributes (Pullman & Moore Reference Pullman and Moore1999; Easton & Pullman Reference Easton and Pullman2001; Goodale, Verma & Pullman Reference Goodale, Verma and Pullman2003). Product–service systems design recognizes that in many instances services are tied to products and consumer preferences are affected by relationships between product and service attributes (Cohen & Whang Reference Cohen and Whang1997; Verma et al. Reference Verma, Thompson, Moore and Louviere2001). Cohen & Whang (Reference Cohen and Whang1997) addressed trade-offs between product price and after-sales service price and quality to design a profit-maximizing product–service ‘bundle’ using game theory to find the equilibrium point between the producer and service operator. Verma et al. (Reference Verma, Thompson, Moore and Louviere2001) proposed a product–service design framework to address operations difficulties in meeting market demand, for example, for a pizza design and delivery system.
Research in design for market systems, initially focused on products, has been expanded to product–service system design. Several recent studies have explored the integration of marketing, engineering, and operations models for product–service system design optimization (Kang Reference Kang2014; Kang et al. Reference Kang, Emmanoulopoulos, Ren, Feinberg and Papalambros2015; Kang, Feinberg & Papalambros Reference Kang, Feinberg and Papalambros2015a ,Reference Kang, Feinberg and Papalambros b ). Kang et al. showed that when multiple product and service providers compete in the same market, trade-offs exist between product and service profits, in which case co-designing products and services can be more profitable than separately designing the product and the service.
In the EV market, products and services are closely related when the refueling service station operations are included in the system. Range anxiety (concern regarding how far one can drive on a single charge) is a major reason for slow EV adoption (Melaina & Bremson Reference Melaina and Bremson2008; Vardera Reference Vardera2010; Egbue & Long Reference Egbue and Long2012). This concern comes not only from the relatively low driving range of current EVs but also from the sparseness of public charging stations. In both US and Chinese markets, EV manufacturers and charging station operators have started to collaborate to overcome this adoption barrier (ChargePoint 2014; ECOtality 2014; JRJ.com 2015). Early studies for a US market indicate that a collaboration between vehicle producers and charging station operators is necessary to reach overall profitability (Kang et al. Reference Kang, Feinberg and Papalambros2015a ,Reference Kang, Feinberg and Papalambros b ). When the two stakeholders work in partnership, the charging station operators can build more stations even with a loss, which is mitigated by profit from EV sales. Aggressive investment in charging station infrastructure can relieve range anxiety of EV users leading to more EV sales (Kang et al. Reference Kang, Feinberg and Papalambros2015b ). Regarding charging service design, specifically, a study of the Beijing market has shown that a distribution of mixed charging services (including charging stations, charging posts, and battery swap stations) will be needed to accommodate the growing EV adoption rate without significant disturbances to the power grid Liu (Reference Liu2012). The relationship between charging capacity and charging service profit has been studied by Li & Ouyang (Reference Li and Ouyang2011), showing that high station load is important for keeping the service profitable.
2.5 Modeling assumptions
Several assumptions are made throughout the modeling framework described here. Some are intrinsic to the models themselves; others are simply parameter values assumed in the application study and can be modified without changing the model itself. In the latter case, the models can be rerun with different values and different conclusions may be reached. Results for some parametric changes are included in the application study. Additional assumptions are noted in the relevant model descriptions.
∙ The study focuses only on subsidy-related policies and market equilibria resulting from them; it does not consider other policies such as zero-emission vehicle sales mandates. In addition, the fixed gasoline vehicle design used in the study is assumed to satisfy all fuel economy and emission standards. This is reasonable since the paper does not aim to establish optimal choice of powertrain and emission technologies. Further, behavioral interventions such as energy consumption feedback to users (see Allcott & Mullainathan (Reference Allcott and Mullainathan2010) for example) are not considered as a policy alternative.
∙ All models are time-independent, representing a steady state of the market. This assumes that responses to public policies and design decisions are instantaneous, and currency depreciation and loan interests are not modeled. Nonetheless, we will perform parametric studies on the gas price, which is time sensitive in reality and has significant influence on the market equilibrium. We will discuss the validity of major findings of this study for varying gas prices. It should be noted that the steady state assumption sidesteps important dynamics in the EV market, e.g., the existence of early adopter and mainstream consumers, and the rebound effect for improved fuel economy (which is shown to be moderate in the US market, see Greening, Greene & Difiglio (Reference Greening, Greene and Difiglio2000), and Small & Van Dender (Reference Small and Van Dender2007)). However, the proposed framework has the potential to be extended to equilibria of time-dependent decisions optimized for all stakeholders.
∙ The market consists of only two manufacturers: one offers a BEV and a PHEV for which optimal designs need to be determined; the other offers a conventional gasoline vehicle with a fixed design. Our model essentially clusters the decisions of manufacturers into two groups, EV and gasoline, and assumes that each group shares the same goal and technology, financial, and manufacturing capabilities; see, for example, Whitefoot, Fowlie & Skerlos (Reference Whitefoot, Fowlie and Skerlos2011) for more discussion in this direction. This largely simplified model allows us to focus on differentiating the main trends in EV market penetration for the US and China markets (different in size, consumer preferences, and policies), without further complicating conclusions by incorporating heterogeneous firm-wise decisions. We acknowledge that adding these details would improve the realism of the study, but it will cause the model to be too complicated (with all parameters characterizing manufacturers) as an initial study to effectively reveal the key factors linking public policies and engineering design decisions that influence the markets. Our analysis focuses on revealing how EVs would be designed at market equilibrium, but does not inform manufacturers on strategies to differentiate their products from competitors.
∙ This study focused on the two markets (central area of Beijing and Ann Arbor) where chargers can be installed in public parking spots relatively cheaply. We acknowledge, however, that the actual building and land cost will be high for installing charging stations in suburban areas or along interstate highways, in both USA and China. In addition, all chargers installed in stations use Direct Current (DC) fast chargers that can recharge a battery within 30 min. All charging stations are operated either by a private company or by the government.
∙ In the calculations for fuel economy and emissions the driving cycles used are Federal Test Procedure (FTP-75) and New European Driving Cycle (NEDC) for the US and Chinese markets, respectively. The GHG emission values are calculated based on $\text{CO}_{2}$
emission from both gasoline consumption and electricity production (for EVs). For the latter, an existing method for the US market (EIA 2015) is applied to both markets.
$\text{CO}_{2}$
emission from both gasoline consumption and electricity production (for EVs). For the latter, an existing method for the US market (EIA 2015) is applied to both markets.∙ Baseline tax and plate fees for EVs are the same as the ones for gasoline vehicles. All reductions are considered as a government investment. Tax and plate fees are not considered as government income. Currently, USA has a one-time tax for vehicles, while China has an annual tax.
∙ The following parameters are assumed in the comparison study: gas prices for Ann Arbor and Beijing are $2.51/gallon and $4.77/gallon, respectively. One US dollar equals 6.26 Yuan. Discount rate is 10 % per a year. EV use life is set at ten years.
The next section describes how the decisions by the three stakeholders, government, vehicle producer and infrastructure operator, are combined in a single framework to estimate the resulting market equilibrium.
3 Stakeholders and decision framework
We consider three stakeholders (government, vehicle producer and infrastructure operator) in the decision framework. The government determines public policies; the EV manufacturer determines vehicle powertrain and battery designs for its BEV and PHEV products and the vehicle price, and the charging station (CS) operator determines the number of charging stations, their locations and the charging fee. The market shares of EV, PHEV and conventional vehicles are then estimated by vehicle and charging service design attributes, given a consumer preference model derived from survey questionnaire results. Figure 3 summarizes the interactions among stakeholders and Table 1 lists input decision variables, parameters, and output responses for each model.
Table 1. Input decision variables, parameters, and output responses for each model
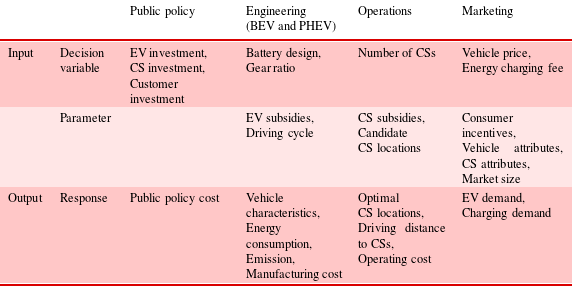

Figure 3. Multidisciplinary decision-making framework for the EV market.
In addition, we use market-specific parameters, namely, drive cycle, candidate charging station locations, market size, and unit energy cost (gas and electricity), to investigate how optimal policy changes for different parameter values, which are fixed during each optimization. Among these parameters, drive cycle and station locations directly affect decisions made by the manufacturer and the charging station operator. Market size affects the charging service demand, which in turn affects the number of chargers required. Unit energy cost affects consumers’ preferences toward electric and gasoline vehicles.
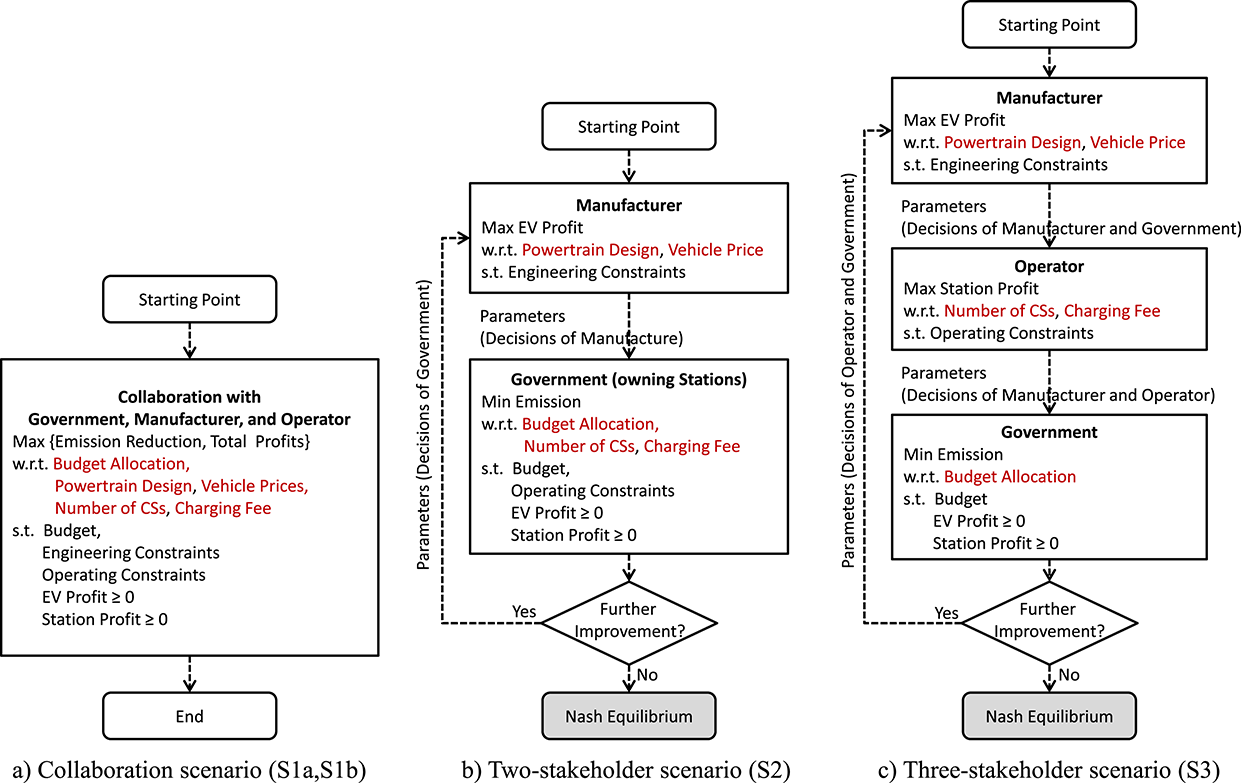
We examine four decision-making scenarios; their formulation is shown in Figure 4: scenarios S1a and S1b represent collaborations where the three stakeholders share a common interest in optimizing either emission reduction in S1a or profit from vehicle sales and charging service in S1b. Scenario S2 has two stakeholders where the vehicle manufacturer considers only its own profit, and the government minimizes emissions within a given budget limit by operating the CSs and collecting fees from this government-owned charging service. The government invests in both the EV manufacturer and CS operator and utilizes CS income to offset any losses. The charging station cost includes only installation and operation cost of chargers and no building or land cost. Lastly, S3 is a three-stakeholder scenario where all stakeholders reach equilibrium by optimizing their individual objectives independently. Scenarios S2 and S3 assume that equilibrium for all stakeholders is reached for the given models and parameters. We define as ‘optimal policy’ the public policy at equilibrium. In all scenarios we assume full information is shared among all parties and that the conventional vehicle producer does not change its design. Note that we constrain government policies in a way that they lead to non-negative profits for both manufacturers and station operators across all scenarios. Engineering constraints are also applied to ensure feasible vehicle designs.

Figure 4. Three business scenarios for optimal decision making.
To summarize, the formulation for problem S1a and associated notation is given below.
with respect to
 $$\begin{eqnarray}\displaystyle \bar{\mathbf{x}} & = & \displaystyle [\mathbf{x}_{gov},\mathbf{x}_{man},\mathbf{x}_{\mathit{CS}}]\nonumber\\ \displaystyle \mathbf{x}_{gov} & = & \displaystyle [I_{\mathit{EV}},I_{\mathit{CS}},I_{cu}]\nonumber\\ \displaystyle \mathbf{x}_{manu} & = & \displaystyle [P_{\mathit{BEV}},\mathbf{B}_{\mathit{BEV}},G_{\mathit{BEV}},P_{\mathit{PHEV}},\mathbf{B}_{\mathit{PHEV}},G_{\mathit{PHEV}}]\nonumber\\ \displaystyle \mathbf{x}_{oper} & = & \displaystyle [P_{\mathit{CS}},N_{\mathit{CS}}]\end{eqnarray}$$
subject to
 $$\begin{eqnarray}\begin{array}{@{}c@{}}\displaystyle lb\leqslant \bar{\mathbf{x}}\leqslant ub\\ \displaystyle g_{gov}(\bar{\mathbf{x}})-\mathit{budget}\leqslant 0\\ \displaystyle \mathbf{g}_{eng}(\mathbf{A}_{\mathit{BEV}},\mathbf{A}_{\mathit{PHEV}})\leqslant 0\\ \displaystyle g_{oper}(N_{\mathit{CS}},D_{\mathit{CS}})\leqslant 0\\ \displaystyle \unicode[STIX]{x1D6F1}_{\mathit{BEV}}+\unicode[STIX]{x1D6F1}_{\mathit{PHEV}}\geqslant 0\\ \displaystyle \unicode[STIX]{x1D6F1}_{\mathit{CS}}\geqslant 0\end{array}\end{eqnarray}$$
where
 $$\begin{eqnarray}\displaystyle & & \displaystyle [\mathit{EM}_{\mathit{BEV}},\mathbf{A}_{\mathit{BEV}},\mathit{EM}_{\mathit{PHEV}},\mathbf{A}_{\mathit{PHEV}}]\nonumber\\ \displaystyle & & \displaystyle \quad =f_{eng}(\mathbf{B}_{\mathit{BEV}},G_{\mathit{BEV}},\mathbf{B}_{\mathit{PHEV}},G_{\mathit{PHEV}},D_{\mathit{CS}})\nonumber\\ \displaystyle & & \displaystyle [D_{\mathit{BEV}},D_{\mathit{PHEV}},D_{\mathit{CS}}]\nonumber\\ \displaystyle & & \displaystyle \quad =f_{\mathit{demand}}(P_{\mathit{BEV}},\mathbf{A}_{\mathit{BEV}},P_{\mathit{PHEV}},\mathbf{A}_{\mathit{PHEV}},P_{\mathit{CS}},N_{\mathit{CS}})\nonumber\\ \displaystyle & & \displaystyle [C_{\mathit{BEV}},C_{\mathit{PHEV}},C_{\mathit{CS}}]\nonumber\\ \displaystyle & & \displaystyle \quad =f_{\mathit{cost}}(\mathbf{B}_{\mathit{BEV}},D_{\mathit{BEV}},\mathbf{B}_{\mathit{PHEV}},D_{\mathit{PHEV}},N_{\mathit{CS}},D_{\mathit{CS}})\nonumber\\ \displaystyle & & \displaystyle [\unicode[STIX]{x1D6F1}_{\mathit{BEV}},\unicode[STIX]{x1D6F1}_{\mathit{PHEV}},\unicode[STIX]{x1D6F1}_{\mathit{CS}}]\nonumber\\ \displaystyle & & \displaystyle \quad =f_{\mathit{profit}}(P_{\mathit{BEV}},D_{\mathit{BEV}},C_{\mathit{BEV}},P_{\mathit{PHEV}},D_{\mathit{PHEV}},C_{\mathit{PHEV}},P_{\mathit{CS}},D_{\mathit{PHEV}},C_{\mathit{CS}})\nonumber\\ \displaystyle & & \displaystyle\end{eqnarray}$$
Here Eq. (3) is the objective function to be minimized. The emissions from BEVs, PHEVs, and gasoline vehicles are denoted as
![]() $\mathit{EM}_{\mathit{BEV}}$
,
$\mathit{EM}_{\mathit{BEV}}$
,
![]() $\mathit{EM}_{\mathit{PHEV}}$
, and
$\mathit{EM}_{\mathit{PHEV}}$
, and
![]() $\mathit{EM}_{gas}$
, respectively; they are functions of the decision variables
$\mathit{EM}_{gas}$
, respectively; they are functions of the decision variables
![]() $\mathbf{x}_{gov}$
,
$\mathbf{x}_{gov}$
,
![]() $\mathbf{x}_{manu}$
, and
$\mathbf{x}_{manu}$
, and
![]() $\mathbf{x}_{oper}$
defined in Eq. (4), representing decisions to be made by the government, the manufacturer, and the operator, respectively. Government investments in the manufacturer, the charging operator, and customers are denoted as
$\mathbf{x}_{oper}$
defined in Eq. (4), representing decisions to be made by the government, the manufacturer, and the operator, respectively. Government investments in the manufacturer, the charging operator, and customers are denoted as
![]() $I_{\mathit{EV}}$
,
$I_{\mathit{EV}}$
,
![]() $I_{\mathit{CS}}$
, and
$I_{\mathit{CS}}$
, and
![]() $I_{cu}$
. We use
$I_{cu}$
. We use
![]() $P_{\mathit{BEV}/\mathit{PHEV}}$
for vehicle prices, and
$P_{\mathit{BEV}/\mathit{PHEV}}$
for vehicle prices, and
![]() $P_{\mathit{CS}}$
for the charging service price. Battery design variables are represented by the vector
$P_{\mathit{CS}}$
for the charging service price. Battery design variables are represented by the vector
![]() $\mathbf{B}$
, gear ratio by
$\mathbf{B}$
, gear ratio by
![]() $G$
, and the number of charging stations by
$G$
, and the number of charging stations by
![]() $N_{\mathit{CS}}$
. Eq. (5) lists boundary and inequality constraints: the overall government expense
$N_{\mathit{CS}}$
. Eq. (5) lists boundary and inequality constraints: the overall government expense
![]() $g_{gov}$
is limited by the specified budget; engineering performance
$g_{gov}$
is limited by the specified budget; engineering performance
![]() $\mathbf{g}_{eng}$
is modeled as function of vehicle attributes
$\mathbf{g}_{eng}$
is modeled as function of vehicle attributes
![]() $\mathbf{A}_{\mathit{BEV}/\mathit{PHEV}}$
;
$\mathbf{A}_{\mathit{BEV}/\mathit{PHEV}}$
;
![]() $g_{oper}$
calculates the gap between charging service supply and demand; and
$g_{oper}$
calculates the gap between charging service supply and demand; and
![]() $\unicode[STIX]{x1D6F1}_{\mathit{BEV}/\mathit{PHEV}}$
are EV profits. Functions
$\unicode[STIX]{x1D6F1}_{\mathit{BEV}/\mathit{PHEV}}$
are EV profits. Functions
![]() $f_{eng}$
,
$f_{eng}$
,
![]() $f_{\mathit{demand}}$
,
$f_{\mathit{demand}}$
,
![]() $f_{\mathit{cost}}$
, and
$f_{\mathit{cost}}$
, and
![]() $f_{\mathit{profit}}$
in Eq. (6) calculate engineering, demand, cost, and profit responses, respectively. Their modeling is discussed in detail in the rest of this section. Lastly, we denote market demands of BEV, PHEV and charging service by
$f_{\mathit{profit}}$
in Eq. (6) calculate engineering, demand, cost, and profit responses, respectively. Their modeling is discussed in detail in the rest of this section. Lastly, we denote market demands of BEV, PHEV and charging service by
![]() $D_{\mathit{BEV}/\mathit{PHEV}/\mathit{CS}}$
, respectively, and their costs by
$D_{\mathit{BEV}/\mathit{PHEV}/\mathit{CS}}$
, respectively, and their costs by
![]() $C_{\mathit{BEV}/\mathit{PHEV}/\mathit{CS}}$
.
$C_{\mathit{BEV}/\mathit{PHEV}/\mathit{CS}}$
.
The above problem formulation is applied for the city of Ann Arbor (called the US case hereafter) and for Beijing (called the Chinese case). For comparison, we use US Dollar as a monetary measure for both cases and, as mentioned earlier, set 1 USD to 6.26 Yuan (the ratio on March 14, 2015 according to Bloomberg Business (2015)). Also as mentioned earlier, all profits are calculated considering net present value for 10 years with a 10 % discount rate, assuming an EV life span of ten years. For scenarios S1b, the objective is changed to profit; for S2 and S3, each stakeholder will have its own optimization formulation, yet the models developed, as described presently, will be shared across all scenarios.
3.1 Public policy model
We model EV-related public policies currently implemented in USA and China according to Mock & Yang (Reference Mock and Yang2014), consisting of EV subsidies for consumers and manufacturers, and subsidies for charging station operators. The total amount of subsidies has an upper bound set to the government’s approved budget limit.
3.1.1 US case policy model
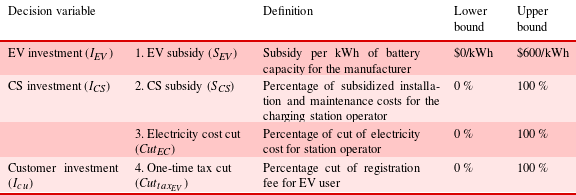
For the US case, four public policies are considered as decision Variables; see Table 2 for definitions and bounds.
Table 2. Public policy decision variables for U.S
Let
![]() $S_{\mathit{EV}}$
be the subsidy on unit (kWh) battery energy,
$S_{\mathit{EV}}$
be the subsidy on unit (kWh) battery energy,
![]() $BC_{\mathit{BEV}/\mathit{PHEV}}$
and
$BC_{\mathit{BEV}/\mathit{PHEV}}$
and
![]() $D_{\mathit{BEV}/\mathit{PHEV}}$
be the battery capacity and market demand, respectively. The total subsidy allocated to the manufacturer,
$D_{\mathit{BEV}/\mathit{PHEV}}$
be the battery capacity and market demand, respectively. The total subsidy allocated to the manufacturer,
![]() $I_{\mathit{EV}}$
, can be calculated as
$I_{\mathit{EV}}$
, can be calculated as
The total subsidy on the charging station operator,
![]() $I_{\mathit{CS}}$
, can be formulated as
$I_{\mathit{CS}}$
, can be formulated as
where
![]() $S_{\mathit{CS}}$
and
$S_{\mathit{CS}}$
and
![]() $\mathit{Cut}_{\mathit{EC}}$
are the unit charging station subsidy and the electricity cost discount, respectively;
$\mathit{Cut}_{\mathit{EC}}$
are the unit charging station subsidy and the electricity cost discount, respectively;
![]() $N_{\mathit{CS}}$
is the number of stations;
$N_{\mathit{CS}}$
is the number of stations;
![]() $C_{inst}$
and
$C_{inst}$
and
![]() $C_{main}$
are costs for installing and maintaining a charging station;
$C_{main}$
are costs for installing and maintaining a charging station;
![]() $C_{\mathit{EC}}$
is the electricity cost;
$C_{\mathit{EC}}$
is the electricity cost;
![]() $D_{\mathit{CS}_{\mathit{BEV}/\mathit{PHEV}}}$
is the charging demand.
$D_{\mathit{CS}_{\mathit{BEV}/\mathit{PHEV}}}$
is the charging demand.
For subsidies allocated to consumers,
![]() $I_{cu}$
, we have
$I_{cu}$
, we have
where
![]() $\mathit{Cut}_{tax_{\mathit{EV}}}$
is a one-time tax cut for EV users, and
$\mathit{Cut}_{tax_{\mathit{EV}}}$
is a one-time tax cut for EV users, and
![]() $Tax_{gas}$
is a one-time tax for a gasoline vehicle.
$Tax_{gas}$
is a one-time tax for a gasoline vehicle.
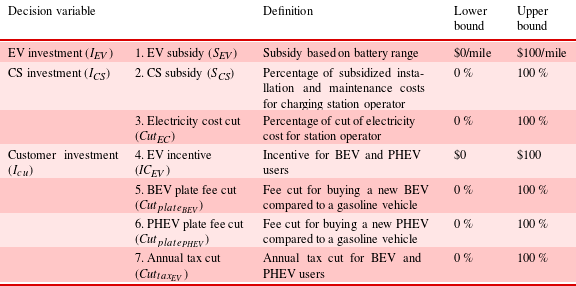
Table 3. Public policy decision variables for China
3.1.2 Chinese case policy model
Seven public policies are considered for Beijing, see Table 3. There are several differences between the Chinese and US cases.
In China, the manufacturer subsidy is proportional to the battery range rather than the capacity, so instead of Eq. (7) we have
where
![]() $R_{\mathit{BEV}/\mathit{PHEV}}$
is the battery range. On the consumer side, issuance of new vehicle license plates is restricted in major cities such as Beijing and Shanghai. In Shanghai, a lottery system is used for conventional vehicles and an amount of 10–15k USD is charged for a plate (Net Reference Net2015c
) upon winning the lottery. In Beijing, lottery participation is restricted based on criteria including city residence and at least 5 years of tax payments. See Net (Reference Net2015b
) for a complete restriction list. In our comparison study, we assume that the ‘effort’ for obtaining a plate in Beijing is the same as for Shanghai. Hence we set the plate cost,
$R_{\mathit{BEV}/\mathit{PHEV}}$
is the battery range. On the consumer side, issuance of new vehicle license plates is restricted in major cities such as Beijing and Shanghai. In Shanghai, a lottery system is used for conventional vehicles and an amount of 10–15k USD is charged for a plate (Net Reference Net2015c
) upon winning the lottery. In Beijing, lottery participation is restricted based on criteria including city residence and at least 5 years of tax payments. See Net (Reference Net2015b
) for a complete restriction list. In our comparison study, we assume that the ‘effort’ for obtaining a plate in Beijing is the same as for Shanghai. Hence we set the plate cost,
![]() $F_{plate\_gas}$
, for a conventional vehicle in Beijing at the same level as in ShanghaiFootnote
1
.
$F_{plate\_gas}$
, for a conventional vehicle in Beijing at the same level as in ShanghaiFootnote
1
.
For EV adopters, a plate discount of
![]() $\mathit{Cut}_{plate\_\mathit{BEV}/\mathit{PHEV}}$
percent applies in addition to a
$\mathit{Cut}_{plate\_\mathit{BEV}/\mathit{PHEV}}$
percent applies in addition to a
![]() $\mathit{Cut}_{tax\_\mathit{EV}}$
percent discount on annual tax and a one-time purchase subsidy of
$\mathit{Cut}_{tax\_\mathit{EV}}$
percent discount on annual tax and a one-time purchase subsidy of
![]() $\mathit{IC}_{\mathit{EV}}$
USD. Therefore, the total government investment on consumer subsidies can be stated as follows:
$\mathit{IC}_{\mathit{EV}}$
USD. Therefore, the total government investment on consumer subsidies can be stated as follows:
 $$\begin{eqnarray}\displaystyle I_{cu} & = & \displaystyle \mathit{IC}_{\mathit{EV}}\times (D_{\mathit{BEV}}+D_{\mathit{PHEV}})\nonumber\\ \displaystyle & & \displaystyle +\,\mathit{Cut}_{plate\_\mathit{BEV}}\times F_{plate\_gas}\times D_{\mathit{BEV}}\nonumber\\ \displaystyle & & \displaystyle +\,\mathit{Cut}_{plate\_\mathit{PHEV}}\times F_{plate\_gas}\times D_{\mathit{PHEV}}\nonumber\\ \displaystyle & & \displaystyle +\,\mathit{Cut}_{tax\_\mathit{EV}}\times Tax_{gas}\times D_{\mathit{PHEV}},\end{eqnarray}$$
where
![]() $F_{plate_{gas}}$
and
$F_{plate_{gas}}$
and
![]() $Tax_{gas}$
are the license plate fee and the annual tax for conventional (gasoline) vehicles, respectively. For the comparison study, we set
$Tax_{gas}$
are the license plate fee and the annual tax for conventional (gasoline) vehicles, respectively. For the comparison study, we set
![]() $F_{plate_{gas}}$
to 25k USD and
$F_{plate_{gas}}$
to 25k USD and
![]() $Tax_{gas}$
to 50 USD per engine displacement, respectively.
$Tax_{gas}$
to 50 USD per engine displacement, respectively.
Business models for charging services in USA and China are still under exploration. Therefore, we use the same CS subsidies, Eqs. (9) and (8), for both cases.
3.2 Engineering functionality model
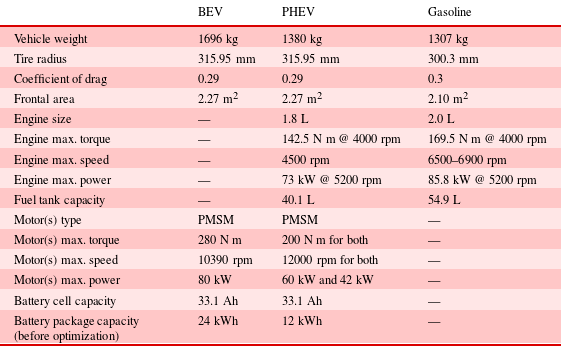
Our market model assumes one manufacturer designs and sells one BEV and one PHEV product, and competes with another manufacturer who sells a conventional gasoline vehicle with a fixed design. Three vehicle simulation models for BEV, PHEV and gasoline vehicles are built in the AMESim (AMESim 2014) simulation environment, as shown in Figure 5. The vehicle models follow specifications similar to the Nissan Leaf, Toyota Prius (PHEV version), and Volkswagen Jetta. We use battery cell specifications from the Nissan Leaf for both the BEV and the PHEV (EERE 2011a , b ). All component specifications are listed in Table 4. Note that the simulation models are meant to approximate these representative vehicles rather than to provide high-fidelity models for them.
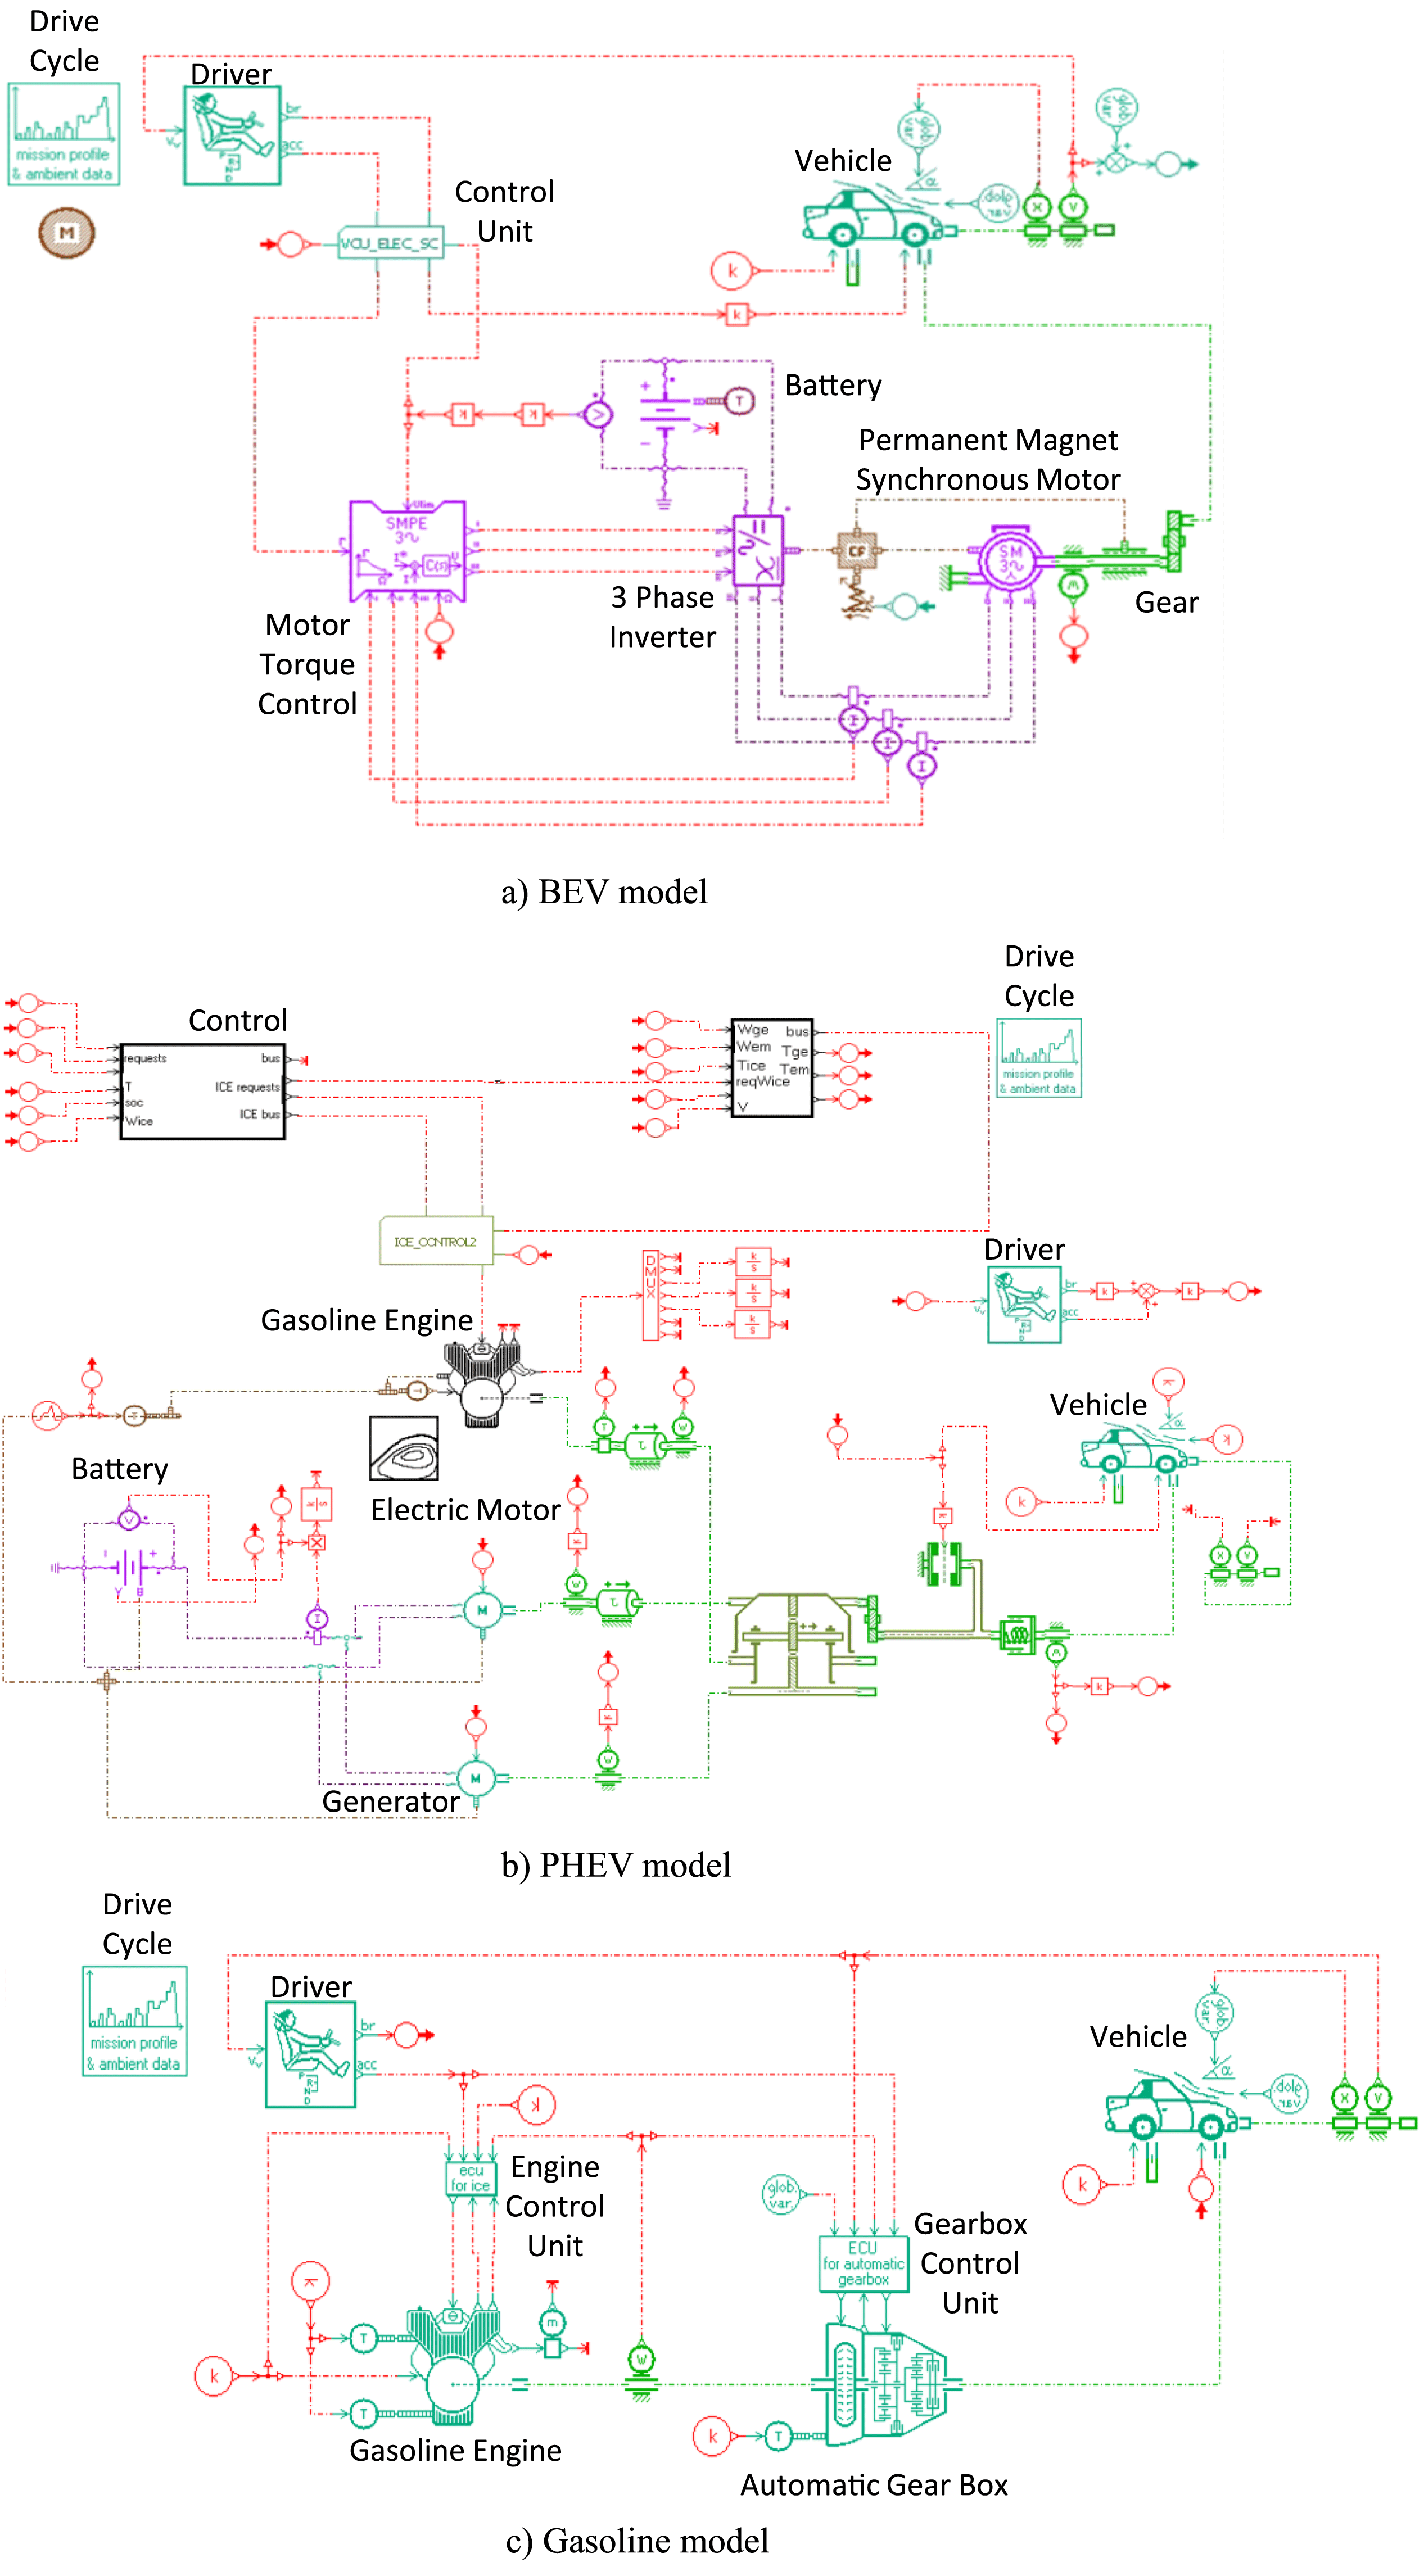
Figure 5. Engineering simulation models.
Table 4. Vehicle component specifications
Each vehicle model has a drive cycle as input and uses a Proportional–Integral–Derivative (PID) controller to represent the driver that follows the drive cycle. The PID controller is a standard control-loop feedback mechanism that attempts to minimize the error between a measured state variable and its desired value (Aström & Hägglund Reference Aström and Hägglund1995). The PID control gains are fixed in all vehicle simulations. Two sources of GHG emission are considered: for the PHEV and the gasoline vehicle, emission from usage of gasoline is accounted for through a driving simulation; for the PHEV and the BEV, emission from electricity production is predicted based on electricity usage (kWh) of EVs during the drive cycles, using the method from (EIA 2015). PHEV uses only battery power at the outset, and switches to the gasoline engine once the battery drains. The PHEV powertrain energy management (control) strategy is tuned to maximize electric-only range for the given drive cycle, rather than for sustaining the State Of Charge (SOC) of the battery. The initial state of charge is set at 80 %, which is the assumed SOC after visiting a fast-charging station.
Because the PHEV initially uses only the battery, and engages the gasoline engine only later, in the model, batteries are not recharged by the engine and emissions are estimated based on gasoline engine usage only. In the operations model, the constraint for charger capacity for both EVs and PHEVs is included because both EV and PHEV users can use charging stations. In the consumer demand model, we assume that PHEV purchasers would not care about availability of charging stations because PHEVs have alternate charging options.
Table 5. Engineering design variables
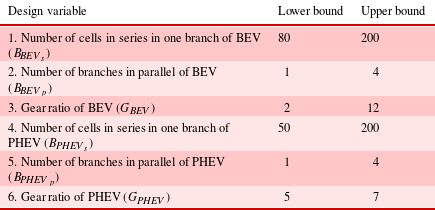
We consider three design variables within the engineering model as listed in Table 5: the number of battery cells in series in one branch, the number of branches in parallel, and the final drive gear ratio. Other vehicle parameters, e.g., mass and coefficient of drag, are fixed since they can be designed independently from the drive cycles. For a given set of input variable values, the simulation outputs the emissions, range, battery/fuel consumption, top speed, 0–60 mph acceleration, and vehicle manufacturing cost. Emissions minimization is the government objective. Vehicle cost is decomposed into battery cost and cost for other parts, both of which are calculated following Kang et al. (Reference Kang, Feinberg and Papalambros2015b ). From the outputs, range, and battery/fuel consumption are parameters used as inputs to the market demand model, while top speed and acceleration serve as engineering constraints. A feasible design should have a top speed greater than 70 mph, and a 0–60 mph acceleration time less than 20 s. We use the same engineering simulation models for both USA and China but with different drive cycles: the Federal Test Procedure (FTP)-75 drive cycle for USA and the New European Driving Cycle (NEDC) for China. Due to the high computation cost of simulations, metamodels are built from the simulation results and used to speed up the optimization. Specifically, for both BEV and PHEV, we generate 20,000 vehicle designs using Latin Hypercube sampling, each yielding vehicle performance (e.g., MPG, 0–60, range, etc.) through simulation using AMESim. We then create a neural network with 15 hidden neurons through the Matlab Neural Network Toolbox (MathWorks 2015). The resultant models have test R values close to 0.99.
3.3 Charging service model
For each city, the charging service model determines the best station locations and charging fee based on the number of charging stations. The model assumes DC fast-charging stations that can recharge a 24 kWh battery to 80 % capacity within 30 min. We adopt the
![]() $p$
-median model (Tansel, Francis & Lowe Reference Tansel, Francis and Lowe1983) to determine the optimal set of stations: the optimal location selection of
$p$
-median model (Tansel, Francis & Lowe Reference Tansel, Francis and Lowe1983) to determine the optimal set of stations: the optimal location selection of
![]() $p$
stations minimizes the average Euclidean distance between any EV on the map and its closest station. The model then calculates the average distance to the closest station from any EV user, assuming that users are uniformly distributed in a given city area.
$p$
stations minimizes the average Euclidean distance between any EV on the map and its closest station. The model then calculates the average distance to the closest station from any EV user, assuming that users are uniformly distributed in a given city area.
Table 6. Optimal charging station locations in Ann Arbor (A to O)
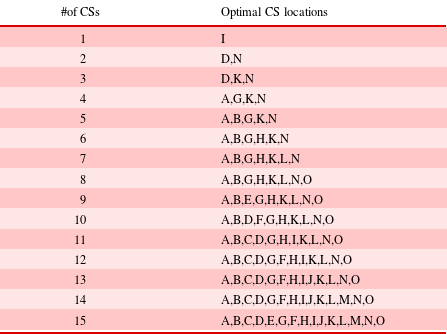
We define the average driving distance for recharging as the aforementioned Euclidean distance multiplied by a parameter
![]() $\unicode[STIX]{x1D6FC}$
, which is dependent on city road and traffic conditions (Burns, Jordan & Scarborough Reference Burns, Jordan and Scarborough2013). This distance is used as a parameter in the consumer preference model to estimate market share. The number of stations should be such that every charger can serve at least 12 EV users per day. This lower bound stems from estimates that each public charger will be used 6 h a day (ECOtality 2013) and that each charging service requires 30 min. Consider the total EV demand
$\unicode[STIX]{x1D6FC}$
, which is dependent on city road and traffic conditions (Burns, Jordan & Scarborough Reference Burns, Jordan and Scarborough2013). This distance is used as a parameter in the consumer preference model to estimate market share. The number of stations should be such that every charger can serve at least 12 EV users per day. This lower bound stems from estimates that each public charger will be used 6 h a day (ECOtality 2013) and that each charging service requires 30 min. Consider the total EV demand
![]() $D_{\mathit{BEV}}+D_{\mathit{PHEV}}$
as the EV market size, and denote
$D_{\mathit{BEV}}+D_{\mathit{PHEV}}$
as the EV market size, and denote
![]() $D_{\mathit{CS}_{daily}}$
as the number of charging services needed by each vehicle per day,
$D_{\mathit{CS}_{daily}}$
as the number of charging services needed by each vehicle per day,
![]() $N_{\mathit{CS}}$
as the number of stations, and
$N_{\mathit{CS}}$
as the number of stations, and
![]() $N_{charger}$
as the number of chargers per station. This constraint can be written as
$N_{charger}$
as the number of chargers per station. This constraint can be written as
3.3.1 US case charging station location model
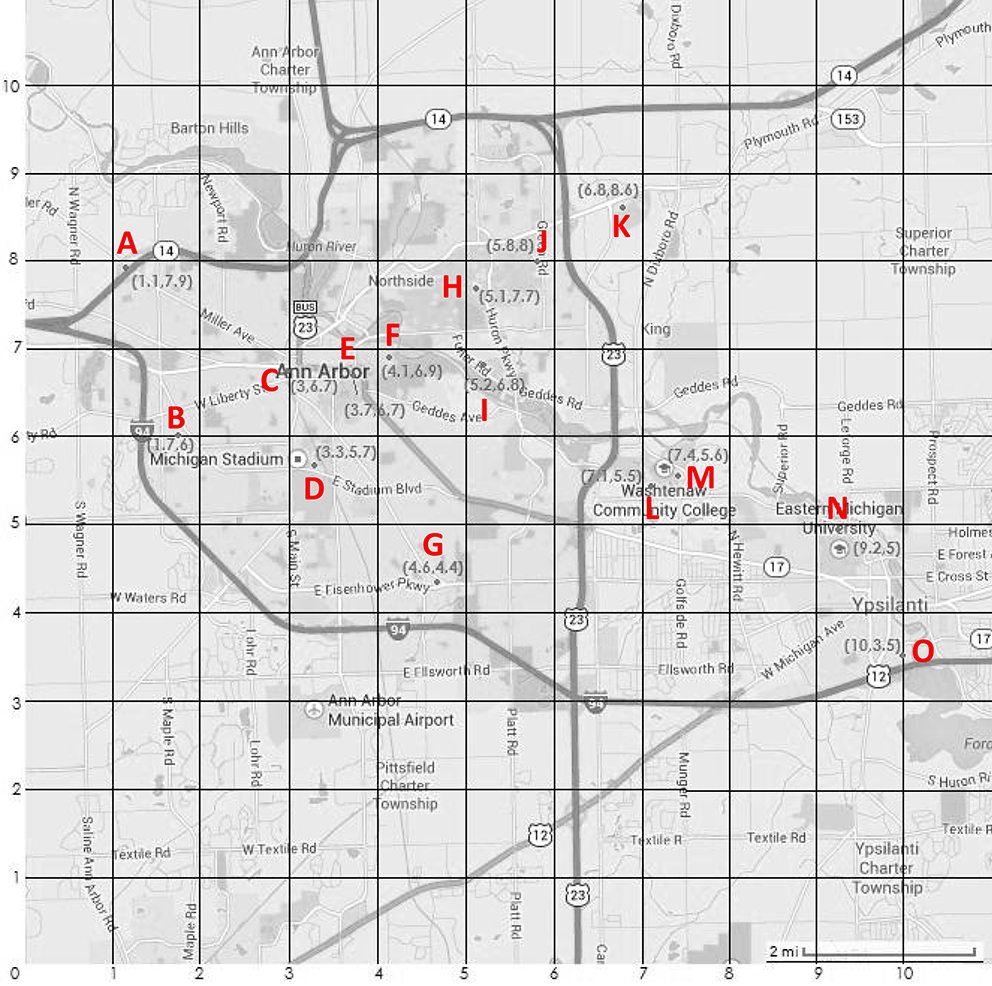
The US Case model is based on an 11 mile by 11 mile area that approximates the city of Ann Arbor with 15 candidate charging station locations selected among its existing public parking lots. This area and candidate station locations are shown in Figure 6. As a pre-process, the optimal locations are computed for 1–15 stations (see Table 6) and the corresponding average distances are recorded. For example, if we plan to build five charging stations, locations A, B, G, K, and N in the figure will be chosen. This look-up table of optimal charging station locations and average distances is used for system level optimization. We set the proportional parameter
![]() $\unicode[STIX]{x1D6FC}=1.2$
based on an estimate for the most ‘straight’ route on Google maps. We assume that each charging station has two chargers.
$\unicode[STIX]{x1D6FC}=1.2$
based on an estimate for the most ‘straight’ route on Google maps. We assume that each charging station has two chargers.
The total cost of running the charging stations consists of installment, maintenance, and electricity costs (Kang et al.
Reference Kang, Feinberg and Papalambros2015b
). For Ann Arbor, we set $75,000 for installing a charger, $5,500 for annual maintenance, and
![]() $10.28$
cents per kWh for electricity (Schroeder & Traber Reference Schroeder and Traber2012; EIA 2014).
$10.28$
cents per kWh for electricity (Schroeder & Traber Reference Schroeder and Traber2012; EIA 2014).

Figure 6. Candidate charging station locations in Ann Arbor (A to O).
3.3.2 Chinese case charging station location model
While the Beijing downtown area is similar in size to Ann Arbor (
![]() $11\times 11$
miles), charging station operator and public policy decisions could be different. Twenty candidate charging station locations are selected among existing major public parking lots (see Figure 7), and the optimal locations are identified (see Table 7).
$11\times 11$
miles), charging station operator and public policy decisions could be different. Twenty candidate charging station locations are selected among existing major public parking lots (see Figure 7), and the optimal locations are identified (see Table 7).

Figure 7. Candidate charging station locations in Beijing (A to T).
Table 7. Optimal charging station locations in Beijing (A to T)
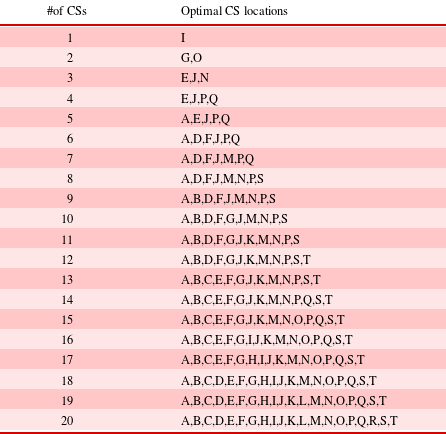
We set the parameter
![]() $\unicode[STIX]{x1D6FC}$
to
$\unicode[STIX]{x1D6FC}$
to
![]() $1.4$
, higher than that in the Ann arbor case, to reflect the more complex road structure in Beijing. Each charging station is assumed to have 34 chargers so that the chargers per station ratio between Beijing and Ann Arbor equals that of the potential market sizes (100,000 and 5,800). Installment and annual maintenance costs for one station are set at $300,000 USD (Xinhuanet 2015)Footnote
2
and $9,600 USD (Sina 2015)Footnote
3
, respectively. Electricity cost for charging EVs is set at
$1.4$
, higher than that in the Ann arbor case, to reflect the more complex road structure in Beijing. Each charging station is assumed to have 34 chargers so that the chargers per station ratio between Beijing and Ann Arbor equals that of the potential market sizes (100,000 and 5,800). Installment and annual maintenance costs for one station are set at $300,000 USD (Xinhuanet 2015)Footnote
2
and $9,600 USD (Sina 2015)Footnote
3
, respectively. Electricity cost for charging EVs is set at
![]() $15$
cents per kWh according to Sohu (2015)Footnote
4
.
$15$
cents per kWh according to Sohu (2015)Footnote
4
.
3.4 Market model
The market model predicts the market shares of a set of products based on product attributes and consumer preferences. We build the US and Chinese Case models based on responses collected from surveys we conducted in the two countries. Specifically, Choice-Based Conjoint (CBC) studies were executed in the two countries; details appear below. We then used a Hierarchical Bayesian (HB) approach (Rossi et al. Reference Rossi, Allenby and McCulloch2005; Orme Reference Orme2009) to estimate the part worths (the weights on product attributes that reflect preferences of the consumer group). The HB analysis leverages responses from all subjects during the estimation of individual part worths, and accounts for preference heterogeneity across subjects. The average market demand is estimated as
where
![]() $q(\mathbf{a})$
is the EV demand based on all design attributes
$q(\mathbf{a})$
is the EV demand based on all design attributes
![]() $\mathbf{a}$
, including engineering, price and service, scaled by the market potential
$\mathbf{a}$
, including engineering, price and service, scaled by the market potential
![]() $s$
. The choice probability of the
$s$
. The choice probability of the
![]() $i$
th survey participant,
$i$
th survey participant,
![]() $P_{i}$
, is calculated following Eq. (2), where
$P_{i}$
, is calculated following Eq. (2), where
![]() $I$
is the total number of survey participants. We assumed that the vehicle market size of Ann Arbor is proportional to that of USA as a whole. This gives us an estimated market of 5,800 in Ann Arbor. For Beijing, the market size is approximately 100,000 according to Xinhuanet (2013)Footnote
5
. We used $2.51 per gallon for gas price in Ann Arbor and $4.77 per gallon in Beijing, according to market prices on March 23rd, 2015.
$I$
is the total number of survey participants. We assumed that the vehicle market size of Ann Arbor is proportional to that of USA as a whole. This gives us an estimated market of 5,800 in Ann Arbor. For Beijing, the market size is approximately 100,000 according to Xinhuanet (2013)Footnote
5
. We used $2.51 per gallon for gas price in Ann Arbor and $4.77 per gallon in Beijing, according to market prices on March 23rd, 2015.
3.4.1 US market model
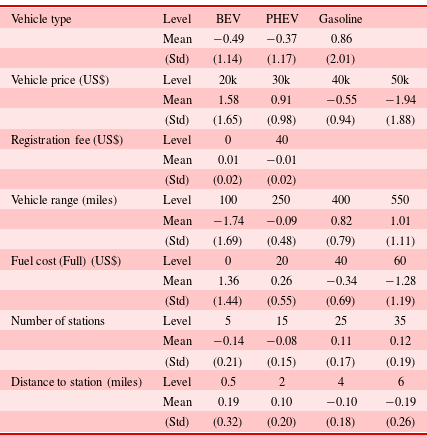
Three price variables are of interest in modeling US market demand: retail prices for BEV and PHEV, and charging station fee. To estimate market demand, our CBC study included seven product attributes: (1) Vehicle type (BEV, PHEV or Gasoline), (2) vehicle price taking EV subsidy into account, (3) registration fee, (4) vehicle range, (5) fuel (electricity) cost to fully refuel (recharge) the vehicle, (6) number of charging stations, and (7) average distance to a station. We gathered responses from 213 subjects living in US cities that have similar population size and area to Ann Arbor. The survey was conducted in November 2014, using Sawtooth Software (Orme Reference Orme2009) for data analysis and ClearVoice Research (Clearvoice 2015) for participant recruitment and screening. Demographic information of the participant group is as follows. The subjects were 41 % male and 59 % female; 3 % were 18 to 24 years of age, 17 % were 25 to 34 years of age, 17 % were 35 to 44 years of age, 23 % were 45 to 54 years of age, 25 % were 55 to 64 years of age, and 15 % were more than 65 years of age. Attribute levels and estimated part worths (means and standard deviations) are summarized in Table 8.
Table 8. Attributes levels and their part worths for US case
3.4.2 Chinese market model
For Beijing, we use the same variables: BEV and PHEV retail prices, and charging fee. The CBC study for this case used eight attributes: (1) Vehicle type (BEV, PHEV or Gasoline), (2) vehicle price taking EV subsidy into account, (3) one-time license plate fee, (4) annual tax, (5) vehicle range, (6) fuel (energy) cost to fully refuel (or recharge) the vehicle, (7) the number of charging stations, and (8) the average distance to the station. We gathered responses from 170 subjects living and working in Beijing or Shanghai. The survey was conducted in April, 2015, using the same tools as in the US case. Demographic information is as follows: the subjects were 68 % male and 32 % female; 3 % were 18–24 years of age, 42 % were 25 to 34 years of age, 30 % were 35–44 years of age, 17 % were 45 to 54 years of age, 7 % were 55–64 years of age, and 1 % were more than 65 years of age.
In this survey we used driving time instead of distance to a station. This is based on the hypothesis that people living in central metropolis areas in China tend to describe driving distances by time, probably because distance does not directly reflect the cost (by taking time into consideration) of travel with the presence of high uncertainty in traffic conditions, while people are commonly sensitive to time. In post-survey analysis, we converted this time attribute back to a distance, using an average driving speed of 7.5 mph in central Beijing according to Tejada (Reference Tejada2015). Attribute levels and resulting part worths (means and standard deviations) are summarized in Table 9.
Table 9. Attributes levels and their part worths for China case
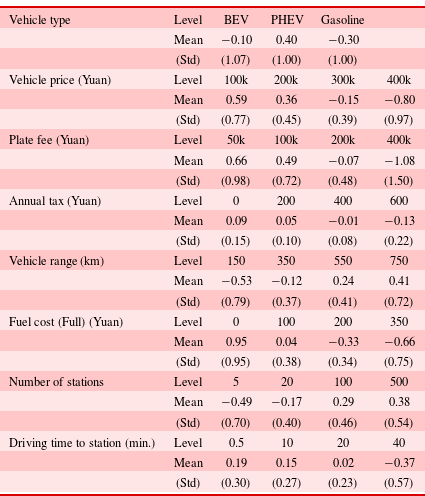
Here we should note some preference differences between consumers in the two countries observed from the survey data, as these will help contextualize optimal policy and market behavior results later on. (1) Chinese consumers prefer PHEVs more than conventional vehicles. We found that PHEVs are well-regarded in Beijing, while in Ann Arbor neither EV type is as well accepted as the gasoline alternative (which is consistent with the recent US studies in Carley et al. (Reference Carley, Krause, Lane and Graham2013), Helveston et al. (Reference Helveston, Liu, Feit, Fuchs, Klampfl and Michalek2015)). However, this result is partially inconsistent with the China market survey reported in Helveston et al. (Reference Helveston, Liu, Feit, Fuchs, Klampfl and Michalek2015) (during 2012–2013), where Chinese consumers strongly preferred HEVs instead of PHEVs. One reason could be the recent policy change that terminated HEV purchase subsidies and license issuance benefits, in addition to the ever-increasing restriction on license plate issuance for gasoline vehicles. One support for our result is a more recent (2015) survey in Shanghai that showed a total of 75.6 % of respondents considering buying PHEVs, compared to 15.0 % for BEVs (Daily Reference Daily2015). (2) US consumers are more sensitive to price and range. While price and range play an important role in purchase decisions across both markets, US consumers are more sensitive to these attributes. For example, the probability for a US consumer to buy an low-range EV (100 miles) is approximately one-third of that for a Chinese consumer. (3) Chinese consumers care about charging service attributes as much as price and range, while US consumers do not (relatively) value these attributes.
Note that, in discrete choice models, part worths reflect not only the importance of various attributes, but the extent to which they drive choice probabilities away from equality across options; the latter interpretation does account for differences in error scale. As such, differences between USA and China can be assessed by parametric differences to the extent that they reflect their relative populations. This is consistent with the work of Louviere and co-authors on the topic, see, e.g., Swait & Louviere (Reference Swait and Louviere1993) and Fiebig et al. (Reference Fiebig, Keane, Louviere and Wasi2010).
3.4.3 Charging demand model
We assume that the charging demand (
![]() $De_{\mathit{CS}\_\mathit{EV}}$
) is proportional to the number of EVs on the road, which is approximated as the demand for EVs (
$De_{\mathit{CS}\_\mathit{EV}}$
) is proportional to the number of EVs on the road, which is approximated as the demand for EVs (
![]() $De_{\mathit{EV}}$
):
$De_{\mathit{EV}}$
):
Here the parameter
![]() $De_{\mathit{CS}\_daily}$
is the average daily charging frequency. Following Smart & Schey (Reference Smart and Schey2012), ECOtality (2013), we assume that on average there are 1.05 charging events per vehicle day, while 4.64 % of these events occur at DC fast-charging stations. Therefore,
$De_{\mathit{CS}\_daily}$
is the average daily charging frequency. Following Smart & Schey (Reference Smart and Schey2012), ECOtality (2013), we assume that on average there are 1.05 charging events per vehicle day, while 4.64 % of these events occur at DC fast-charging stations. Therefore,
![]() $De_{\mathit{CS}\_daily}=1.05\times 4.64\,\%=4.87\,\%$
. We assume the EV useful life
$De_{\mathit{CS}\_daily}=1.05\times 4.64\,\%=4.87\,\%$
. We assume the EV useful life
![]() $L_{\mathit{EV}}$
to be ten years. The charging demand is translated into a lower bound of the number of charging stations.
$L_{\mathit{EV}}$
to be ten years. The charging demand is translated into a lower bound of the number of charging stations.
4 Optimization and parametric study
We compute results for all scenarios described in Figure 4. Abbreviations of scenarios are described in Table 10. Note that the two sub-scenarios, S1a and S1b, are used to find two endpoints of the Pareto curve for a bi-objective collaboration scenario.
Table 10. Abbreviations of scenarios used in the case study
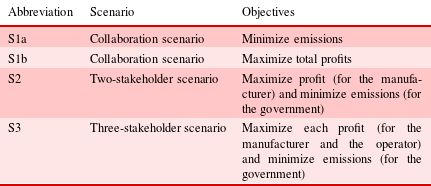
The government investment budget level is a decision model parameter fixed during optimization, and optimization results are obtained for a range of budget levels to reveal the sensitivity of optimal decisions and market behaviors with respect to budget. For fair comparison, the budget levels for the two markets are both varied from $0 to $20M. Since the Chinese market has a much larger capacity for government investment, we computed results for two more budget levels at $500M and $1B.
In all four scenarios, the discrete variables (number of battery cells and branches and number of charging stations) were relaxed as continuous variables. The resultant continuous optimization problem was solved using Sequential Quadratic Programming (SQP) and the relaxed optimal values were rounded to feasible discrete values. We employed a multistart process using ten independent SQP runs with randomized initial solutions to find the best locally optimal solution. In addition, to perform parametric studies, we initialized the optimization runs at a higher budget level with optimal solutions derived from the current level. This treatment allowed the optimization algorithm to avoid abrupt changes in the solution along the budget.
For scenarios S1a and S1b, we solved an all-in-one optimization problem using this multistart technique to find optimal decisions for all stakeholders. For scenarios S2 and S3, computing the market equilibrium reliably or justifying its uniqueness is a challenging problem in its own right, even with analytic objectives (see Morrow & Skerlos (Reference Morrow and Skerlos2011) for example). Since the objective evaluation in this study involves non-analytic vehicle simulations, we adopted an approach similar to Michalek et al. (Reference Michalek, Papalambros and Skerlos2004): the aforementioned multistart optimization was performed for every objective in turn, by fixing variables from the other stakeholders and treating them as parameters during individual stakeholder optimization. The calculation of market equilibria for all budget levels required 21 h on on a standard desktop (Intel i7 CPU 860@2.80 GHz and 8.00 GB RAM).
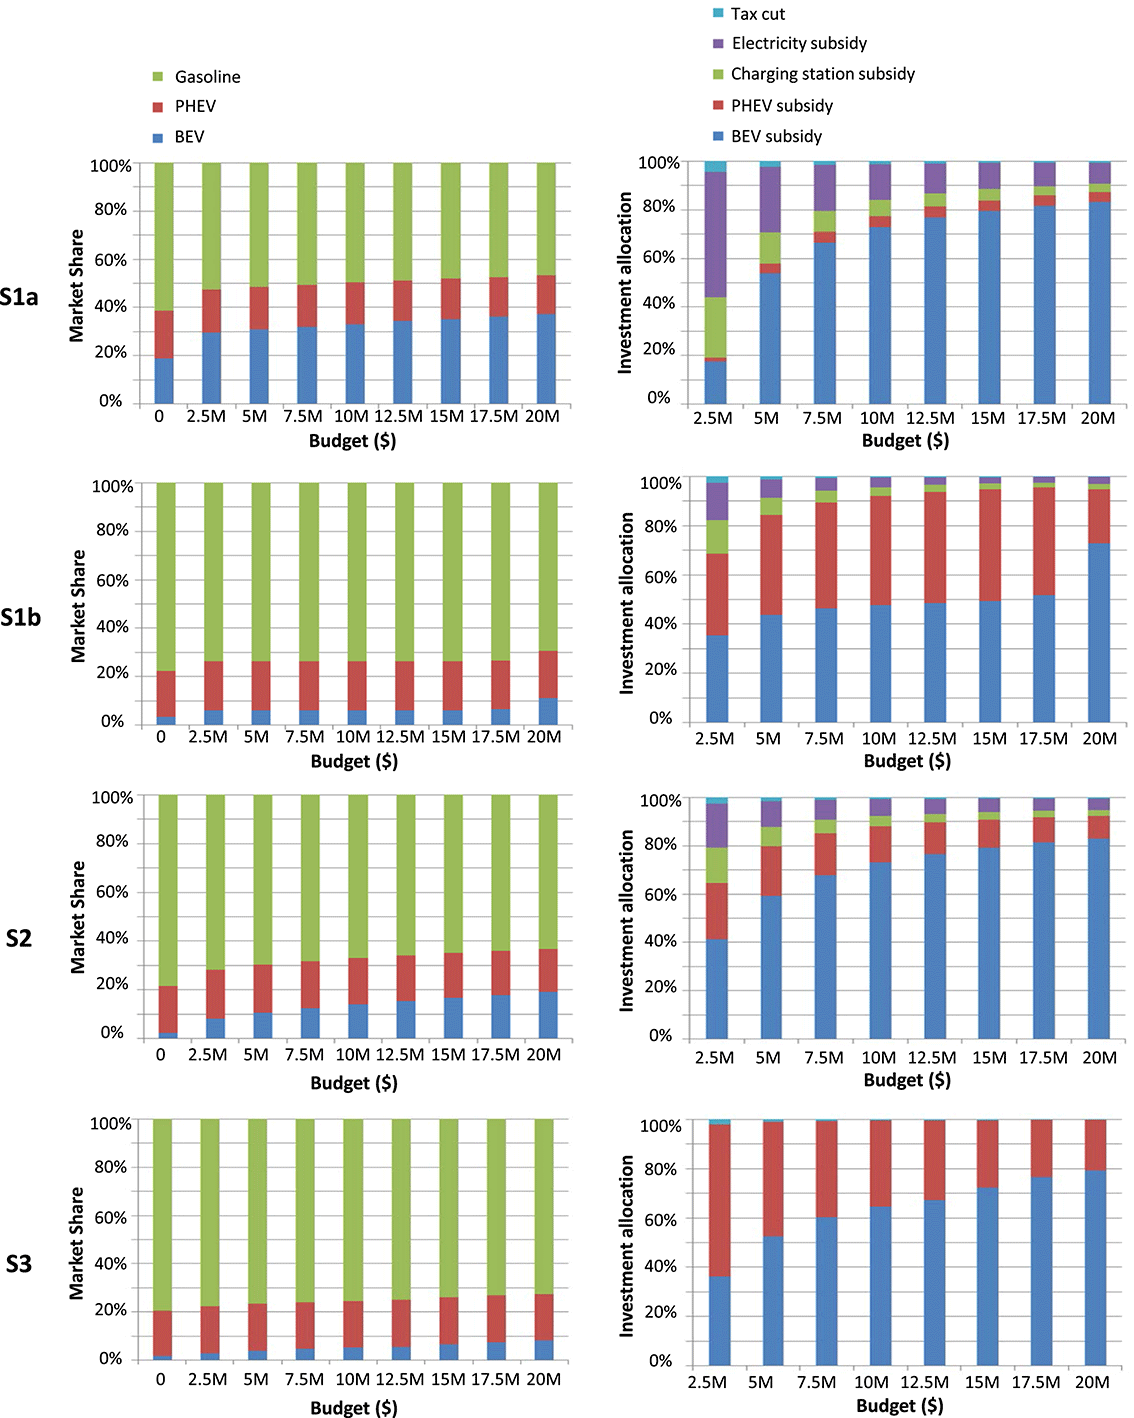
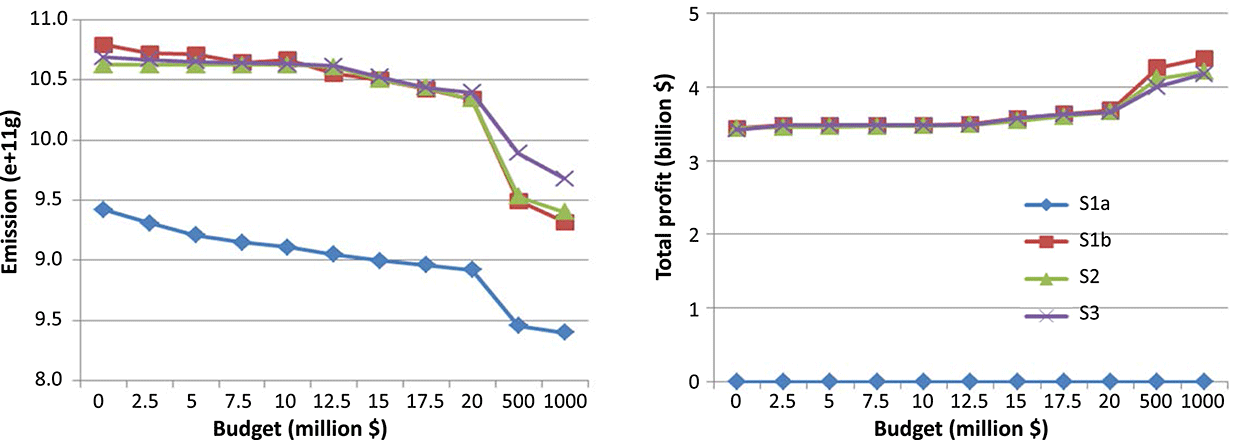
The optimal policies and market responses for the US and Chinese markets are summarized in Figures 8 and 9, respectively. The corresponding emission reduction and profit results are shown in Figures 10 and 11.
In order to compare the two markets, we list the optimal decisions and outcomes of the two markets for the same budget level $20M: a US market in Tables 11 and 12, and a Chinese market in Tables 13 and 14, respectively. In addition, a parametric study was performed by changing gas prices (
![]() $+$
30 % and
$+$
30 % and
![]() $-$
30 % from the base price) for each market with a $20M budget as shown in Figures 12 and 13.
$-$
30 % from the base price) for each market with a $20M budget as shown in Figures 12 and 13.
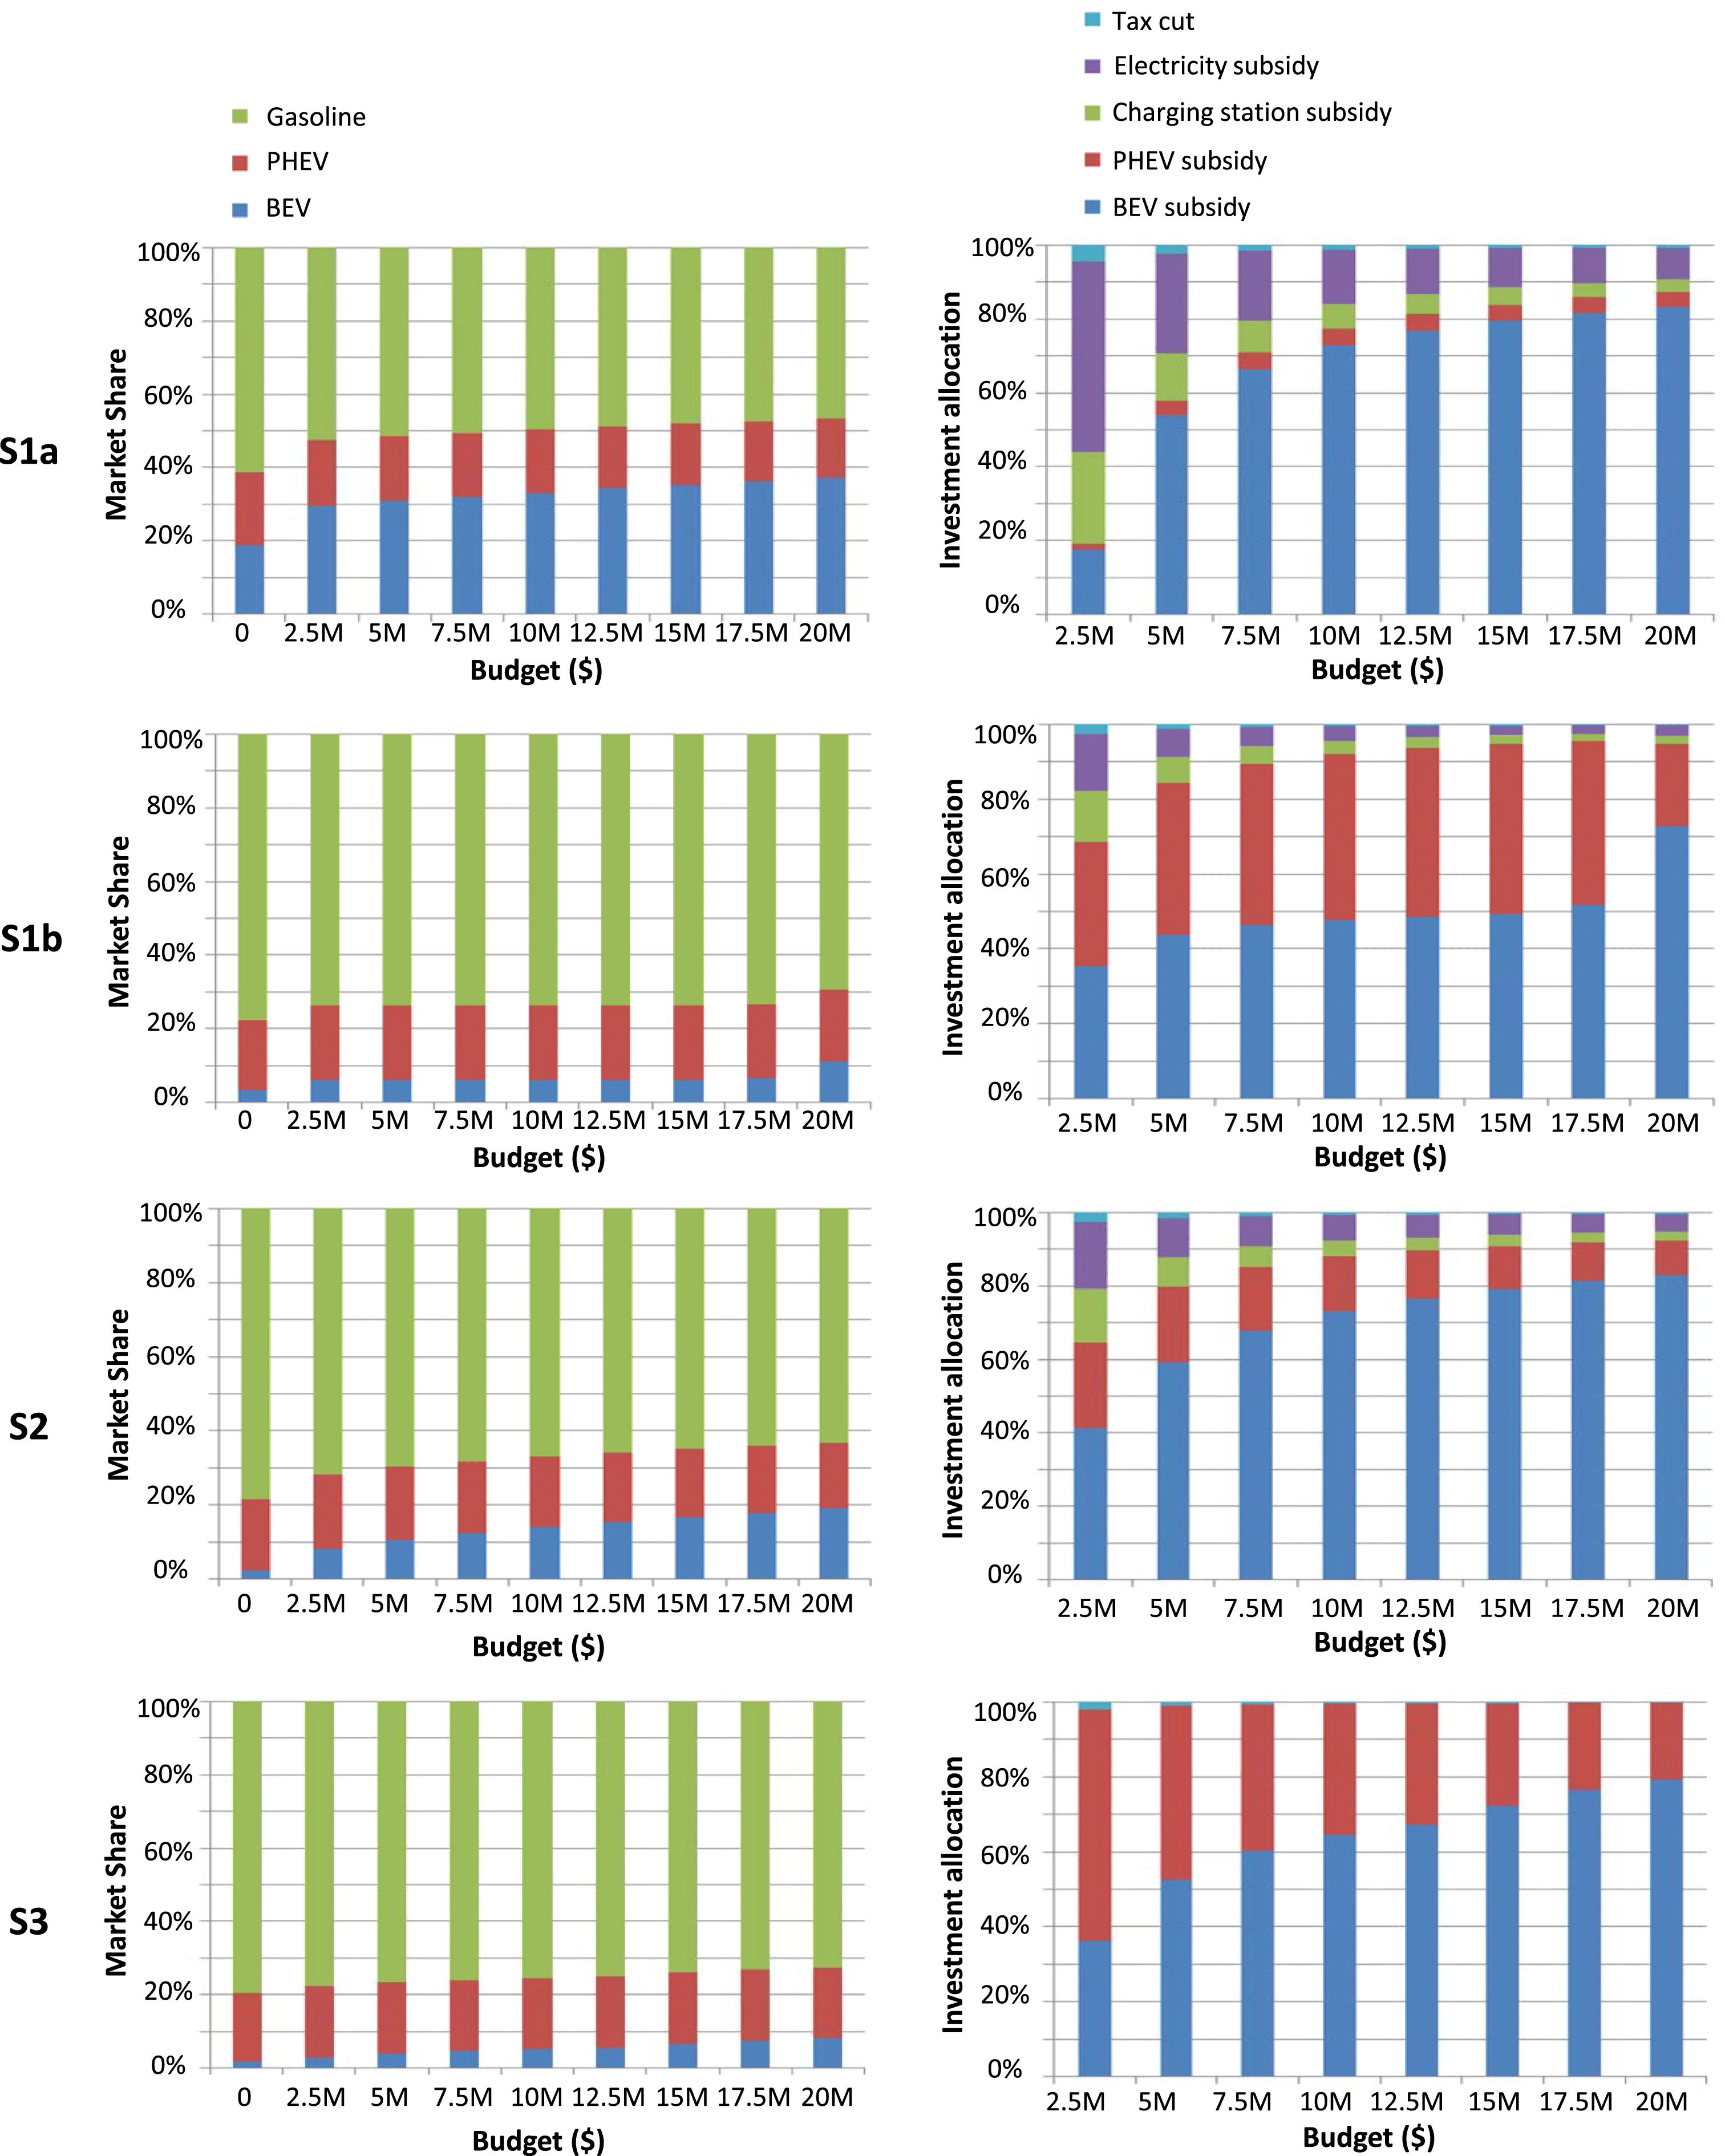
Figure 8. Optimal policies and market responses for the U.S. market.
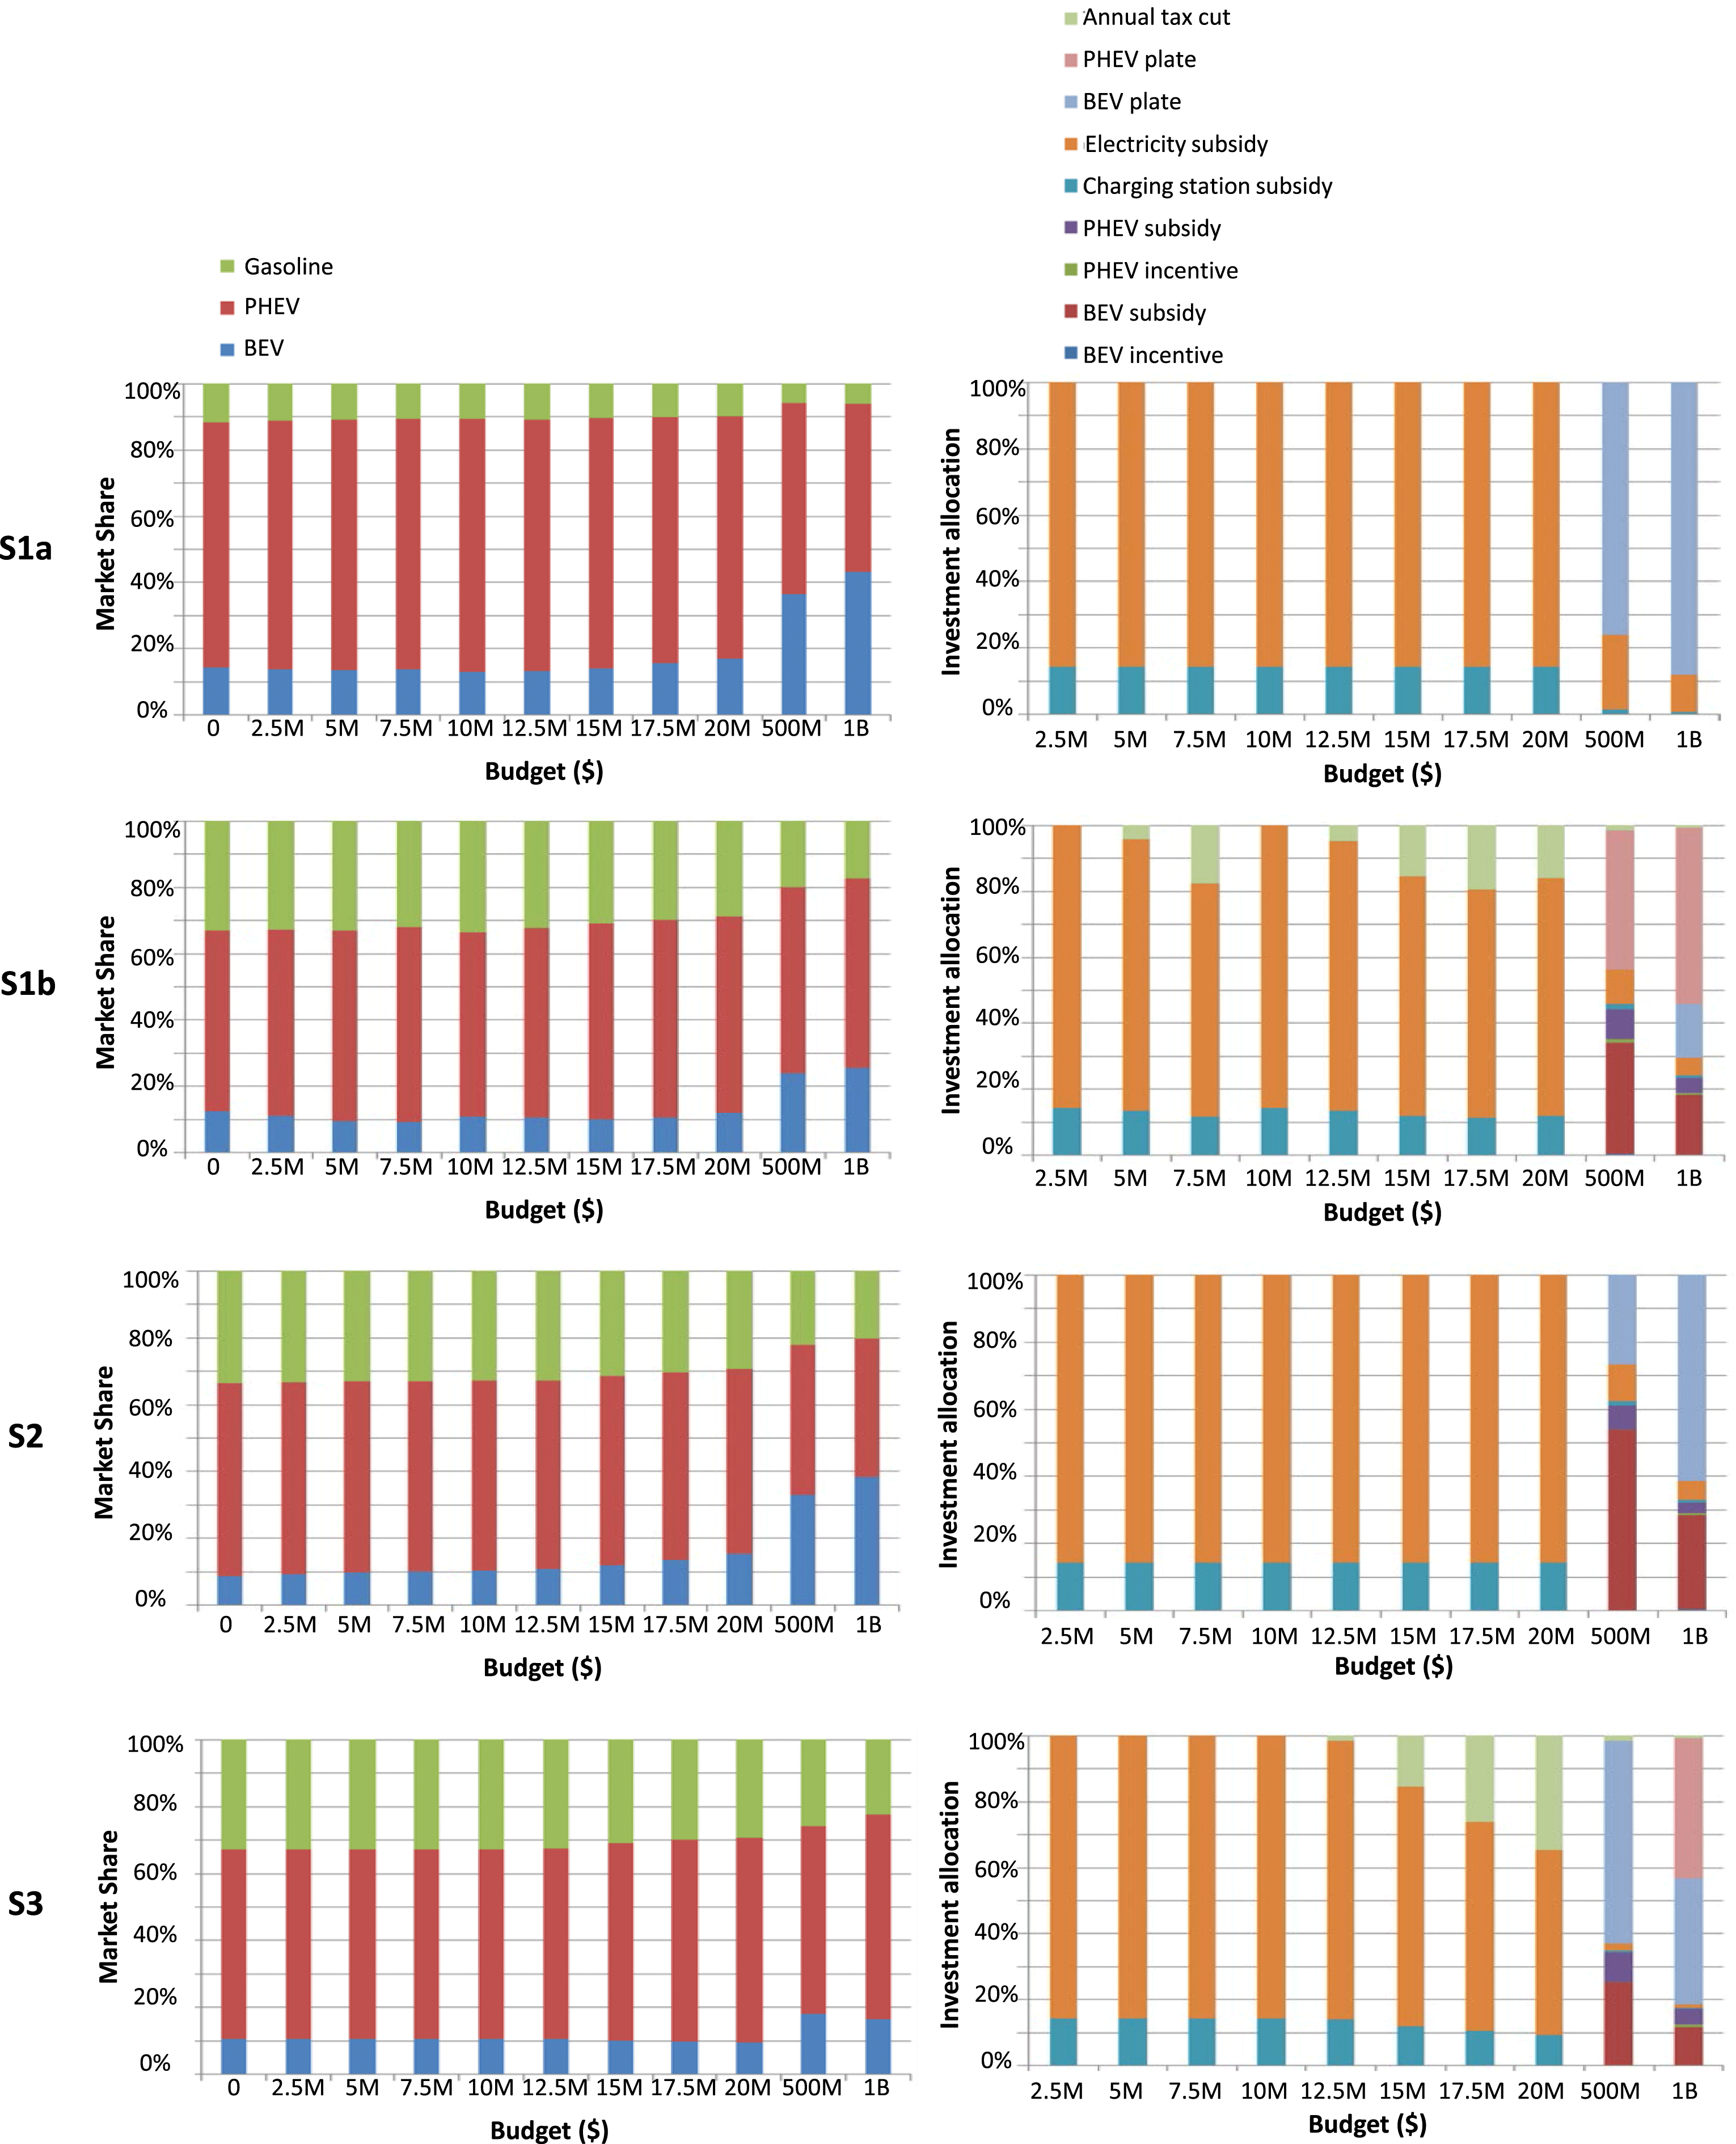
Figure 9. Optimal policies and market responses for the Chinese market.
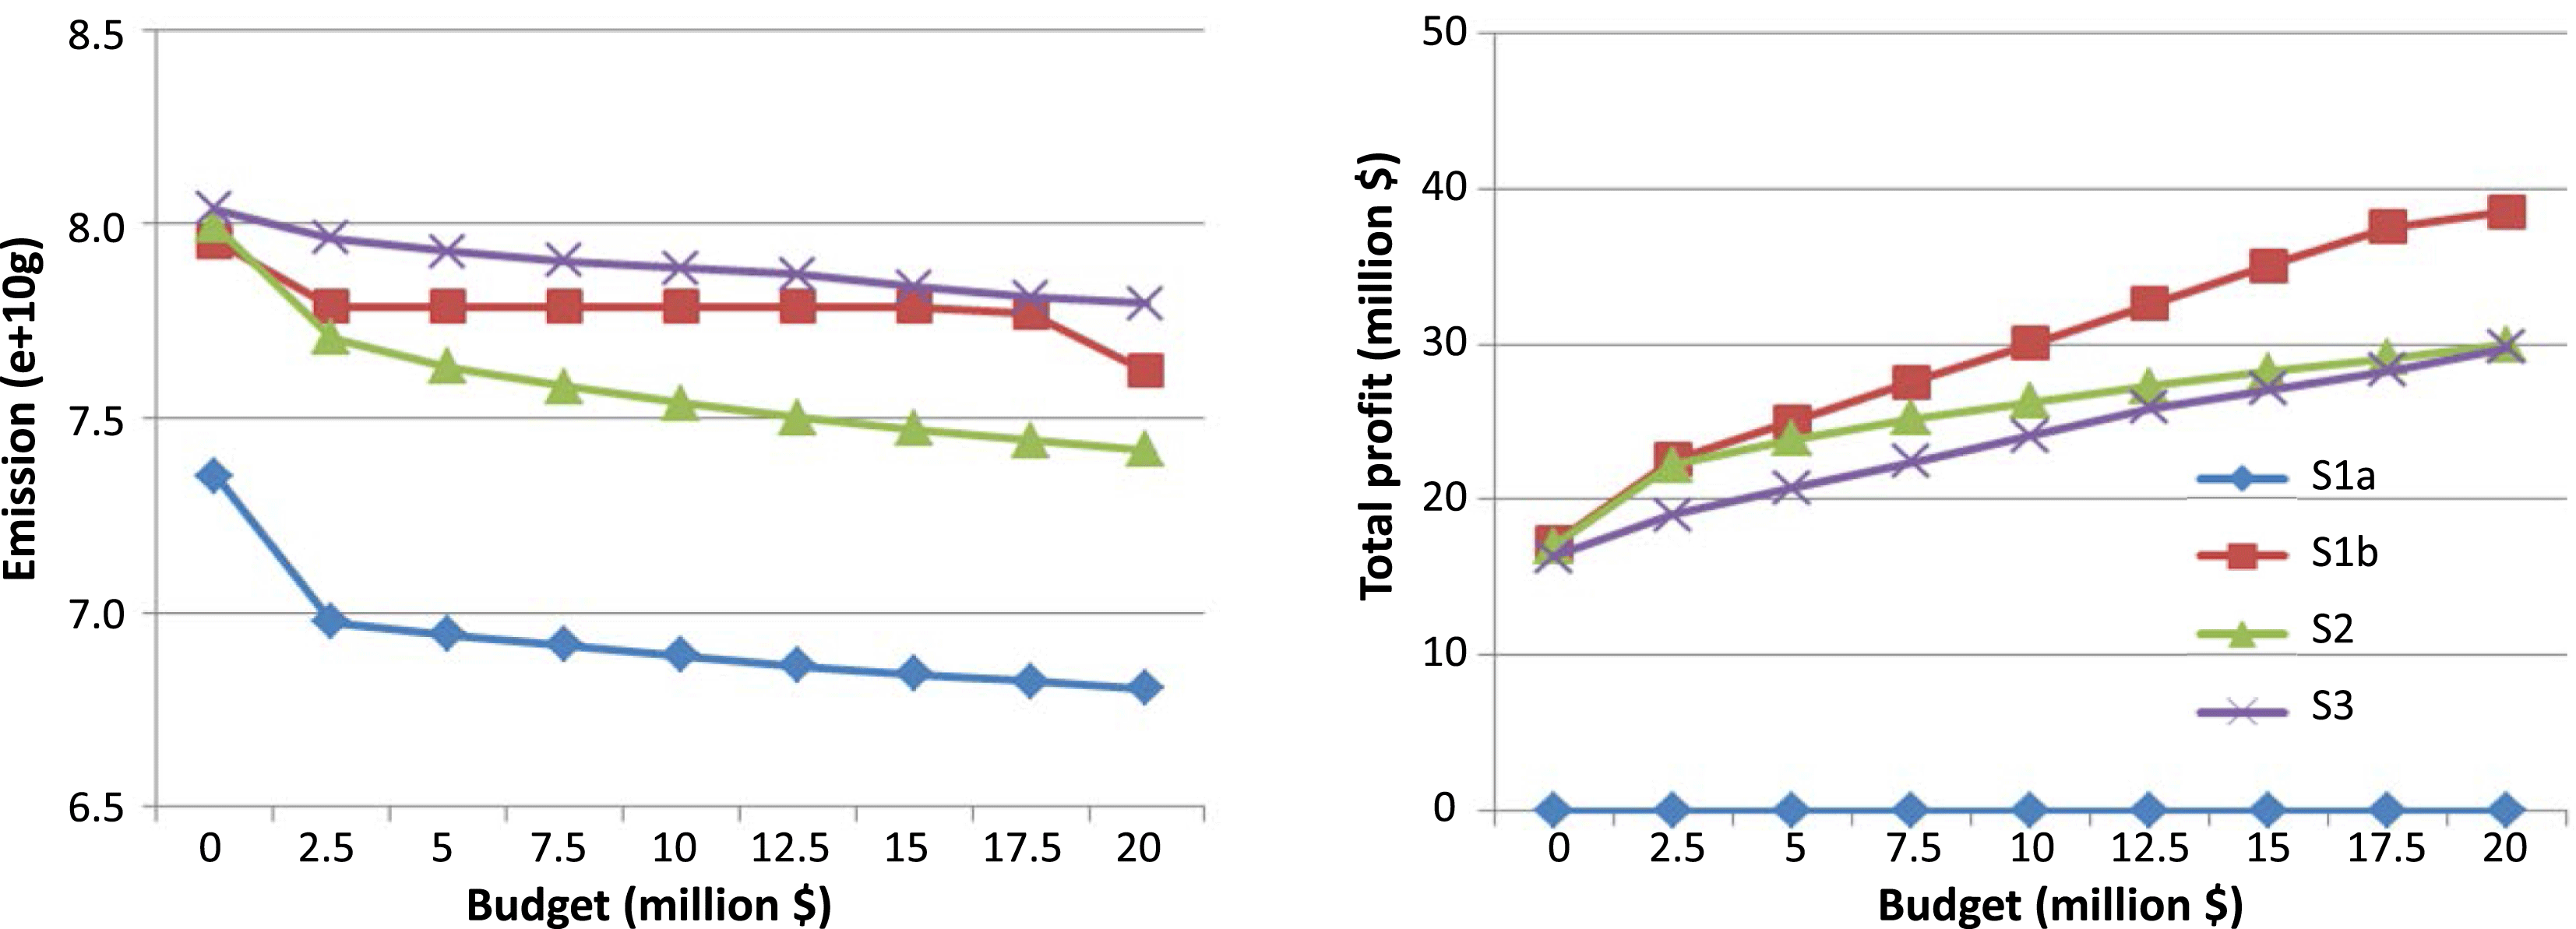
Figure 10. Emissions and profits for different government investment levels for Ann Arbor.
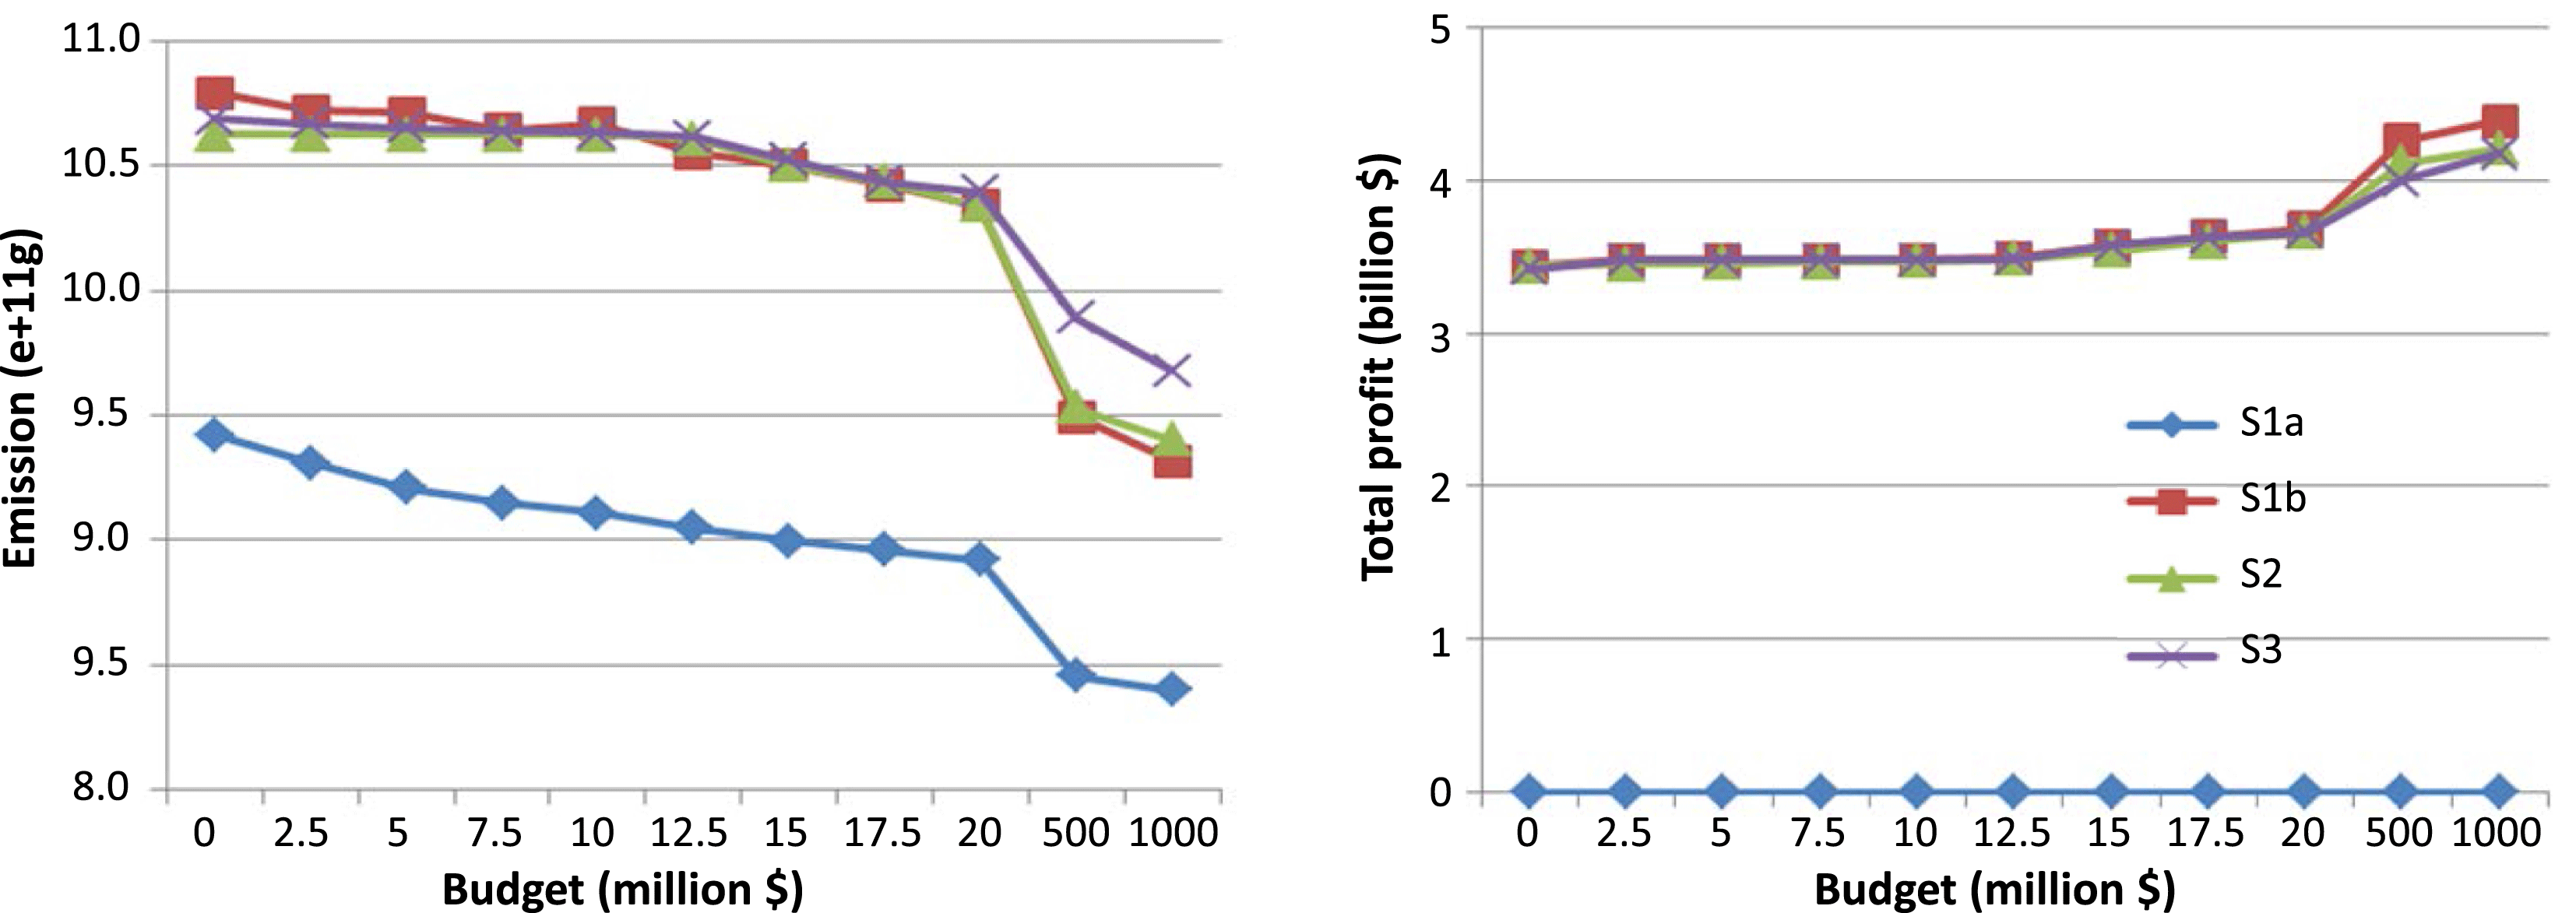
Figure 11. Emissions and profits for different government investment levels for Beijing.
Table 11. Optimal policy with $20M budget for Ann Arbor
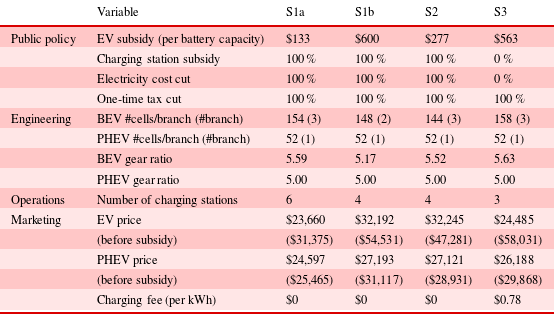
Table 12. Optimal outcomes with $20M budget for Ann Arbor
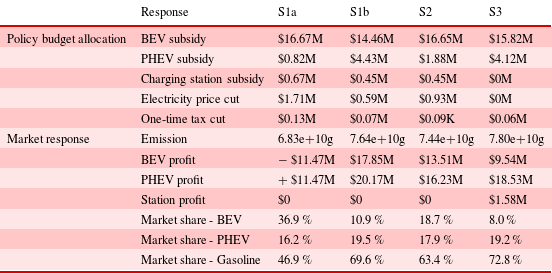
Table 13. Optimal policy with $20M budget for Beijing
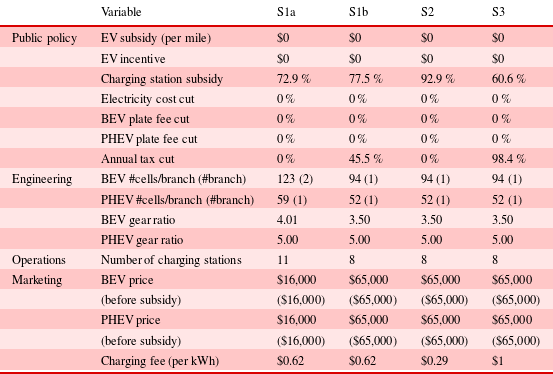
Table 14. Optimal outcomes with $20M budget for Beijing
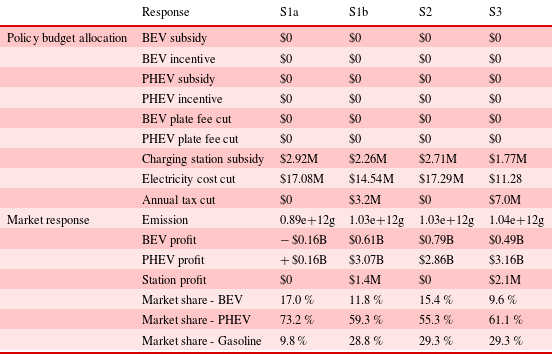

Figure 12. Parametric study for gas prices in Ann Arbor with $20M budget.

Figure 13. Parametric study for gas prices in Beijing with $20M budget.
Combining all results presented, we now discuss market-independent findings and interpret differences in results between the two markets.
Collaboration is the winning strategy. A clear pattern across the two markets is that collaboration among the three stakeholders creates significant advantages. As shown in Figures 10 and 11, Scenario S1a outperforms S2 and S3 by a large margin in terms of GHG emission reductions. On profit maximization, the collaborative solutions from S1b yield the highest profits. The collaboration between government and charging station operator in S2 also outperforms the non-collaborative solution of S3, with respect to both maximizing profit and minimizing emissions.
The collaboration in S1a is so effective that even with zero government investment, it still leads to higher EV adoption than S3 with a $20M budget. This counter-intuitive result may stem from the assumption here that none of the stakeholders is purely profit-oriented, which substantially lowered the vehicle prices to the extent that the manufacturer has a net loss in selling BEVs, which is compensated by the sales of PHEVs; see Tables 12 and 14.
Increasing budget levels has a diminishing effect on EV adoption: we observe from both markets that increasing the budget level results in a diminishing increase in EV adoption. As shown in Figure 8, in the Ann Arbor case, the first small investment brings the most increase in EV adoption, then adoption increases only gradually as budget levels increase. One reason for this effect is that the importance of vehicle prices (affected by BEV subsidy) in consumer preference decreases along with price. In the US case, the budget allocation is similar across all budget levels, a notable change being an increasing BEV subsidy. In the Chinese case, we see that a significant increase in the budget leads to a structural change in budget allocation and a notable shift in the market share (see Figure 9). In emissions reduction-oriented scenarios like S1a and S2, the entire government budget goes primarily toward charging station and electricity subsidies, and any remaining budget goes toward other subsidies (See Table 14). Less effective subsidies are used only after the more effective ones are in place. In addition, we can compute the cost per ton of
![]() $\text{CO}_{2}$
emissions reduction and compare the value to that of alternative policies. For example, S1a costs $3,650 per ton in the US market and $398 per ton in the Chinese market when the budget increases from $0 to $2.5M. This is quite expensive compared to the social cost of carbon (SC-CO2) which represents the benefit of a CO2 reduction considering that the 95th percentile of SC-CO2 in 2025 is only $138 per ton (EPA 2015). This shows that policy makers need to think about alternative approaches when considering benefit per cost.
$\text{CO}_{2}$
emissions reduction and compare the value to that of alternative policies. For example, S1a costs $3,650 per ton in the US market and $398 per ton in the Chinese market when the budget increases from $0 to $2.5M. This is quite expensive compared to the social cost of carbon (SC-CO2) which represents the benefit of a CO2 reduction considering that the 95th percentile of SC-CO2 in 2025 is only $138 per ton (EPA 2015). This shows that policy makers need to think about alternative approaches when considering benefit per cost.
The bottleneck for EV adoption is different in the two markets. While full collaboration is ideal, we seek to explain the inefficiency of government investment and some other interesting findings. Starting with the US market, we notice that when the profit-driven manufacturer and station operator raise prices for their products and service (as in S3), the government’s optimal decision is to increase its investment in EV and service subsidies in order to keep EVs in the market. This passive investment to offset high price tags is the major cause of inefficiency, yet is necessary since consumers in both markets have the highest sensitivity on monetary costs, as seen in Tables 8 and 9.
The Chinese manufacturer and operator also raise price tags when profit is sought after, but the subsidies on EV purchases are significantly lower than those in the US market, even for high budget levels. Three phenomena contribute to this:
(1) The Chinese market has a much larger consumer base and thus its per capita EV subsidies can be significantly lower. In fact, we notice that with budget levels similar to the US case, the government takes more effective measures, e.g., investing in charging stations and offering annual tax cuts, rather than choosing to offset the price in the form of vehicle subsidies. We elaborate on why these two measures are taken. First, unlike the small EV population and thus low demand on charging services in Ann Arbor, the number of charging stations can become the bottleneck for EV adoption in Beijing, which justifies the extra investment in building stations. Second, while the annual tax cut policy has only a marginal effect in the preference model, it has a significant per-dollar impact compared with other part worths related to monetary attributes.
We also notice that charging-related investments occur more in S1a and S2 where the government operates the charging service, while annual tax cuts are offered more in S1b and S3. The reason could be that the former is a more effective way of increasing EV adoption and thus emission reduction, while the latter serves the purpose of luring consumers to buy more expensive cars.
(2) The BEV battery capacities are smaller than those in the US market, leading to reduced pure EV range and less subsidy. One possible reason for the smaller battery lies in the preference difference of consumers: while range plays an important role in consumer purchase decisions in Beijing, consumers in USA were found to be more reluctant to accept low-range EVs. Therefore, the Chinese manufacturer chooses to reduce the battery size and thus the cost, as opposed to increasing the battery size for potentially higher price due to more government subsidy.
(3) The last reason for the lower EV subsidies in the Chinese market is the existence of the license plate cost. Note that this cost, unlike EV subsidies, is controlled by the government and not directly affected by the other stakeholders. Thus offsetting the plate cost will not cause a potential price rise by the manufacturer, and is a more effective measure against high EV prices.
To summarize, the bottleneck for EV adoption in the US market is the high vehicle price set by the manufacturer, catalyzed by high sensitivity in price and low acceptance of EVs among US consumers. The primary bottleneck in the Chinese market is the number of charging stations. When the budget is high enough to offset the cost of installing sufficient charging stations to meet demand, reducing the license plate cost and reducing vehicle prices become major instruments for improving EV adoption.
BEV-related investments are more cost-effective for the government: BEV subsidies take a larger portion of the budget in both markets when EV subsidy is considered as part of the optimal solution. This is due to the fact that BEV batteries are larger, and that BEVs enable more significant reduction of emissions, even when the emissions from electricity production is considered. In addition, in China market, when plate cost cuts are considered in the optimal solution, the cut on BEV plates is prioritized in all scenarios except S1b (See Figure 9).
Gas price changes affect the market share of EVs remarkably and differently for the US and China markets: from Figures 12 and 13, when gas price goes up and electricity cost stays the same, fuel cost for gasoline vehicles increases proportionately to gas price while fuel cost for PHEV increases only partially. This leads to a decrease in market share of gasoline vehicles, a reduction in emissions, and an increase in EV profit. When gas price goes down, the opposite occurs. However, an increase in gas price has a stronger impact than a decrease in terms of market responses. That is, when electricity cost of BEV is already low, a reduced gas price affects customers’ preferences on gasoline vehicles less compared to the case when gas price increases. In response to a 30 % increase in gas price, the China market shows a higher increase in BEV market share than in the US market. Note that this increase is even larger than that of a $500M budget in S1a. This indicates that managing the gas price could be more effective than raising of budget limit for EV penetration in the Chinese market.
While collaboration (S1a) stays as the winning strategy in all scenarios for varying gas prices, its effect diminishes in the China market and signifies in the US one: when gas price goes up, the gaps of emissions between S1a and other scenarios in China become small. This is because S1a does not have room to be improved in EVs market share under the current gas price, while in all other scenarios, EVs dominate the market share if gas price increases. In terms of budget allocation, when gas price rises, charging station investments in all scenarios increase along with the increased number of charging stations, and budget allocations in all scenarios become similar. This shows that under high gas price, different strategy does not matter much in the case of China. On the other hand, in the US case, when gas price increases, only S1a has a substantial improvement in emissions reduction along with the increased charging station investments, while other scenarios still focus on investing in EV subsidies. The result shows that there is still advantage of collaboration (S1a) in the US case under high gas price. The other findings we discussed before using initial gas price are not changed in the parametric study with changing gas prices. However, note that these parametric study results are only for the $20M budget level.
Moreover, we explain a few technical details in the results. First, we have relatively small final drive ratios for BEV designs across scenarios. A smaller ratio will lower the maximum torque output from the motor but also slightly increase energy efficiency for the given drive cycle. The low ratio is caused by the fact that we do not reject vehicle designs that cannot strictly follow the drive cycle, with lower-than-required torque output. Therefore, the vehicle design could be improved by tightening the constraints on drive cycle following. Secondly, we note that most PHEV designs from the two markets have the same number of battery cells and gear ratio. This design reaches the lowest operational voltage, while satisfying 0–60 acceleration performance constraint. This could be caused by the fact that increasing the range has a diminishing effect on the market share. Therefore, since PHEVs already have a satisfactory range, a larger battery pack may not win enough of the market and government subsidy to offset the additional cost. We also conducted sensitivity analyses of optimal solutions by checking the magnitudes of Lagrangian multipliers of active constraints. Some optimal solutions in Figures 8 and 9 that hit the bounds of the constraints have large Lagrangian multipliers, especially those of CS subsidy, electricity cost cut, and plate fee cuts for BEV and PHEV.
The complexity of the optimization problem does not allow proof of global optimality. There are several local optima for the equilibrium problem. We believe we have sufficient verification for the numerical results reported here to draw meaningful conclusions. Scenarios S2 and S3 result in different equilibrium points depending on initial points. We executed computations with ten initial points for each market and each budget level. On average, 70 % of the initial points for the same budget level yielded solutions that were less than 1 % away from the best objective value in both emissions and profit. We consider these solutions as identical given a termination criterion that the objective value difference becomes less than 1 % and assume optimality of the equilibrium point reported in this study. In addition, to understand better the nature of the computed equilibrium points in terms of being true local optima or artifacts of the numerical computation, we tested 100 initial points generated using a Latin Hypercube sampling for scenario S3 and the $20M budget level. We found that 65 % of the initial points reached the best equilibrium point reported in the US case and 93 % in the Chinese case, as shown in Figure 14. We conjecture that the Chinese case has fewer local optima than the US one because there are many active constraints at its optimum and thus less opportunity for multiple solutions; see Table 13. To explore optimality further, we employed a Genetic Algorithm (GA) using the SQP solutions as initial values after optimizing all scenarios using SQP. The GA identified no improved points. The original reason for using SQP is that the GA needs a customized seeding strategy to generate feasible generations under complicated constraints such as the highly nonlinear inequality constraints in this problem.
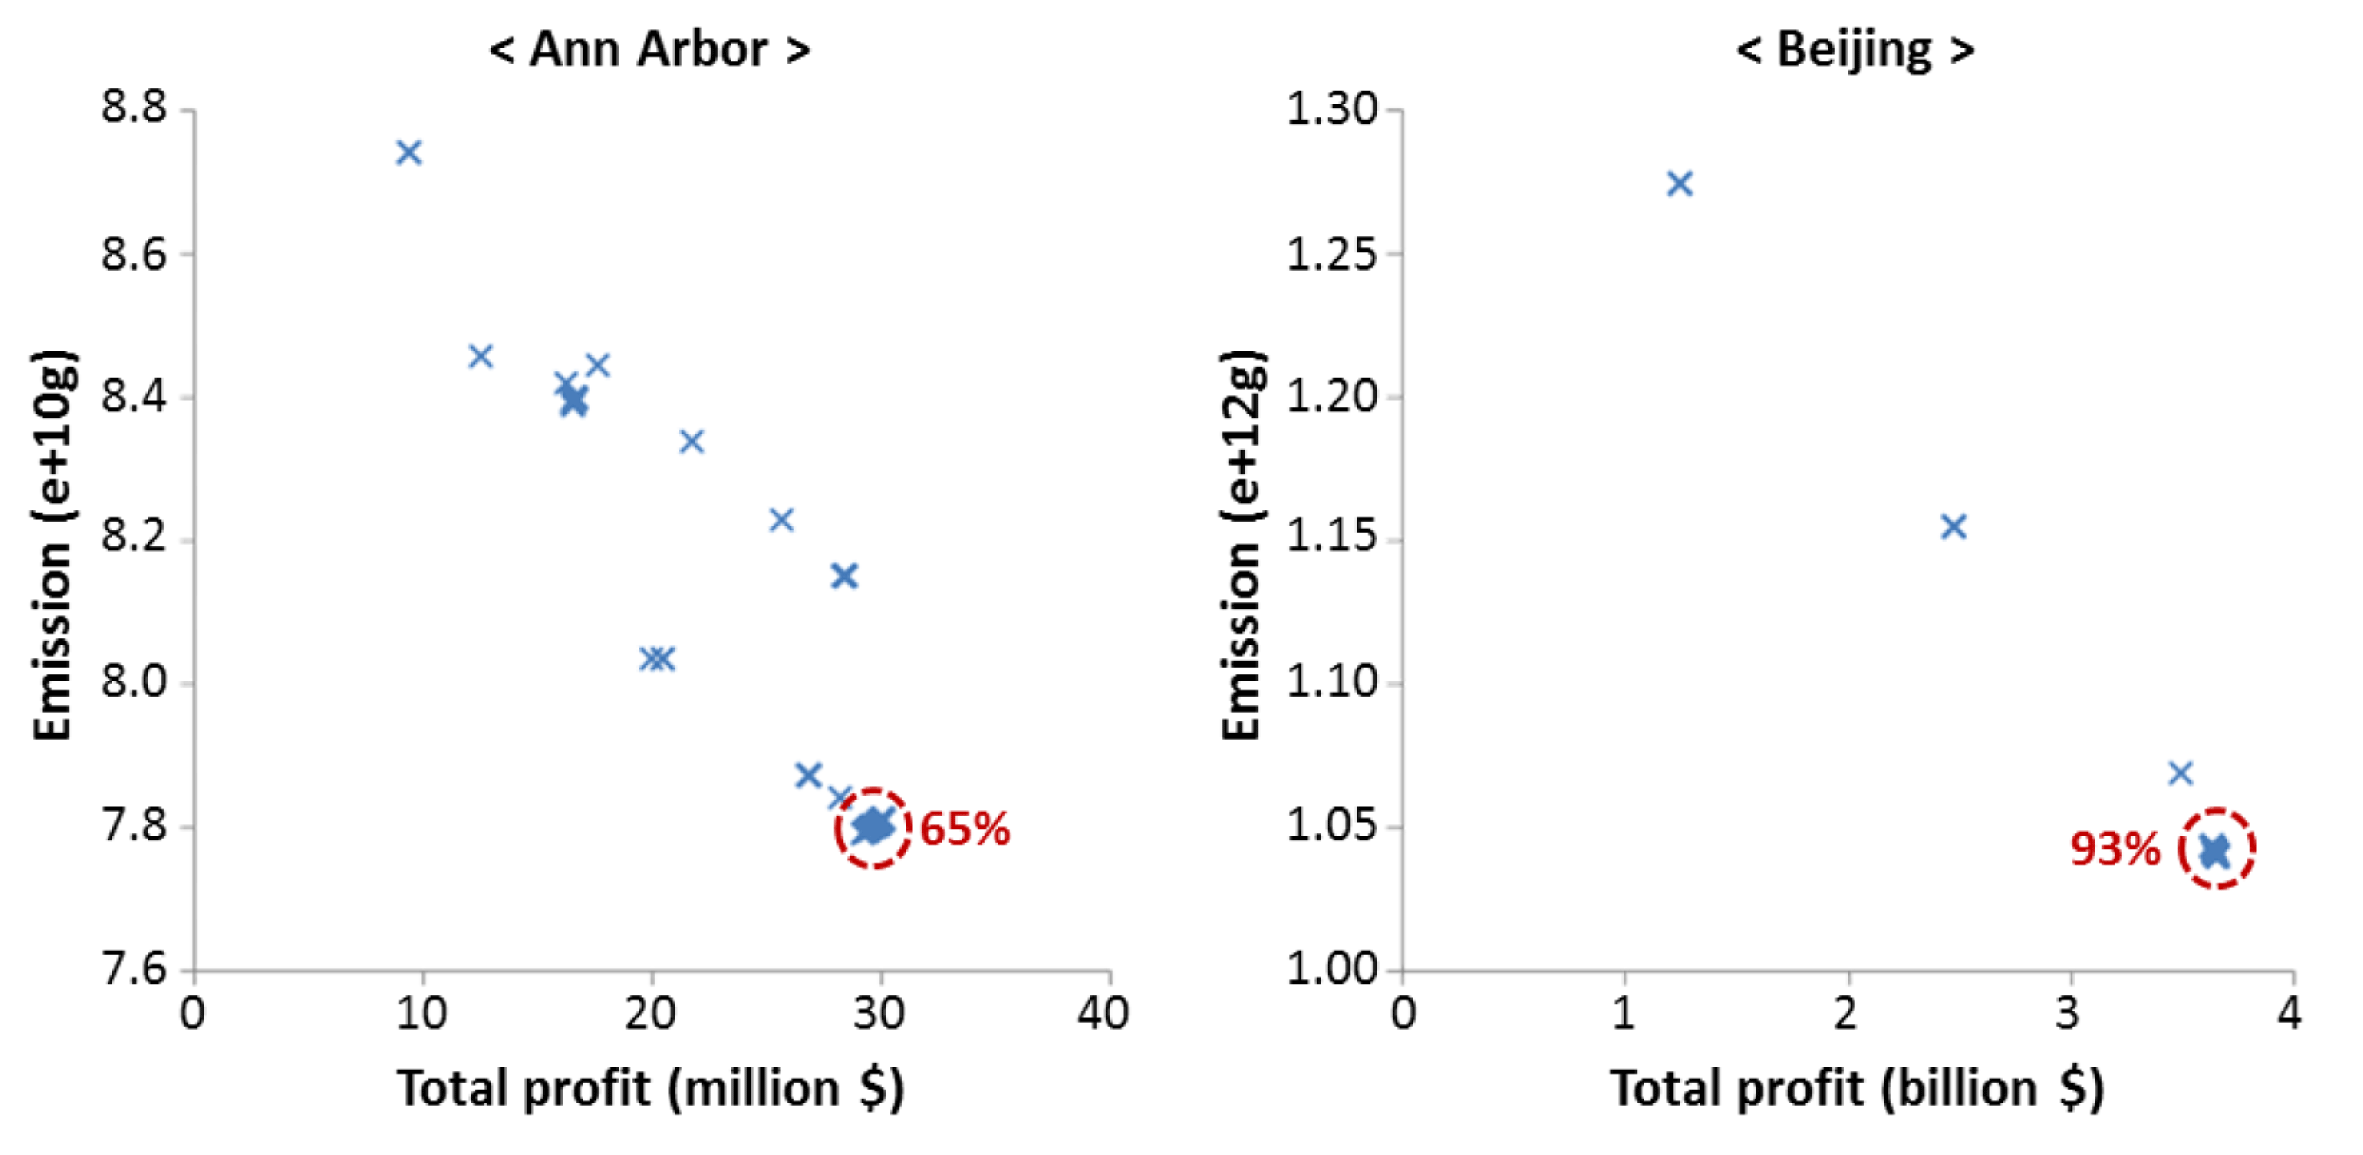
Figure 14. Equilibrium points of S3 under $20M budget level.
Lastly, it is true that the government’s explicit goal is not to minimize GHG emissions, but to maximize welfare. However, this is a multiattribute problem that involves supporting industry growth (for competitiveness, employment, etc.), reducing slack variables (e.g., unused transportation capacity), R&D, and environmental protection, where cutting GHG emissions figure in prominently. Let us again stress that the government’s policy space is limited to the three types of public investment related to EVs, and that the government’s desire to ‘minimize’ emissions is not absolute, but relative to these three policy modes. Similarly, one must bear in mind that some methods for reducing the carbon footprint of transportation (e.g., increasing prices, usage taxes) impose negative externalities on both consumers and business, as opposed to shifts to electric infrastructure, which can be cost-neutral.
5 Conclusion
We presented a multidisciplinary framework to analyze quantitatively the effect of government public policies on the EV market, through modeling the decisions of government, manufacturers, charging station operators, and consumers. We examined three business model scenarios for the EV markets in the cities of Ann Arbor and Beijing that possess quite different stakeholder characteristics.
This research has two main methodological contributions: (1) We introduced a service dimension (charging stations) to a decision-making and policy framework for EV adoption, and showed that considering the charging operator decisions is critical for explaining the current market and formulating effective public policies; and (2) we compared two markets with different consumer preferences, market size, policy and energy infrastructure (prices), and then showed the effects of these differences on optimal public policies and engineering designs. Our relative emphasis on the case study was deliberate, and an attempt at caution: we do not want to appear to claim greater generality for our results beyond what can be reasonably extrapolated using the data available to us in this particular study, which we hope will be supplemented by follow-up empirical investigations.
Subject to the limitations and assumptions made throughout the modeling effort described, we presented the key observations from the comparison study, and discussed how consumer preferences contribute to the policy decisions and market responses.
First, we found that collaboration is the winning strategy: when stakeholders optimize their strategies together and toward the same objective, the investment can be utilized more effectively. In an extreme case where the government controls non-profit charging service and EV manufacturing, the EV market can be expanded substantially by setting EV prices and charging fees to keep revenue and cost equal. This result is fundamentally due to the significant increase in consumers’ willingness to buy when vehicle prices drop below a certain level.
Second, the parametric study on the budget level revealed a diminishing effect of such levels on EV adoption. We attributed this to the reduced importance of prices in decision making when they are already low, and to the use of relatively less effective subsidies on consumers’ preferences while requiring a large budget. We also note that a large increase in budget could cause a structural change in the policy decision and corresponding market share, as we saw in the Chinese case.
Third, the bottleneck for EV adoption is different in the two markets. For the US market, the bottleneck is the high vehicle price set by the manufacturer, catalyzed by high sensitivity in price and low acceptance of EVs among US consumers. The situation in China is more complicated: the first obstacle is the number of charging stations, which dissuades the population from adopting EVs. When the government budget is high enough to meet charging demands, reducing license plate costs as well as vehicle prices becomes necessary for improving EV adoption.
The presented quantitative analysis, which takes a holistic view of the EV market, enables policy makers to examine the impact of subsidy budget levels and policies while taking all stakeholders’ interests into account. Future work should revisit assumptions made and explore market equilibrium models with a greater degree of real-world detail, such as considering multiple competitors, manufacturers, and charging station providers, as well as a variety of EVs.
Acknowledgments
This article is based in part on the International Conference on Engineering Design 2015 presentation in Milan, Italy, under the title ‘A Framework for Quantitative Analysis of Government Policy Influence on Electric Vehicle Market’ (Kang et al. Reference Kang, Emmanoulopoulos, Ren, Feinberg and Papalambros2015). This research was partially supported by a Dow Distinguished Award for Interdisciplinary Sustainability and a Graham Institute Fellowship at the University of Michigan. These supports are gratefully acknowledged. The authors would also like to thank Manos Emmanoulopoulos for his help in building the engineering model.


