1. Introduction
Climate change is one of the most important risks threatening the planet both today and into the future. Solutions to this problem likely require cooperation at a global level (Keohane and Victor, Reference Keohane and Victor2016). The 2015 Paris AgreementFootnote 1 is the broadest and most inclusive international agreement aimed at addressing climate change globally. Under the Agreement, both developed and developing countries have proposed measures to reduce greenhouse gas (GHG) emissions over the next decade.
Brazil has been an important player in the discussions about climate change. It has a unique pattern of emissions, most of it coming from agriculture (32 per cent), land-use changes and deforestation (28 per cent), followed by fossil fuel energy use (27.7 per cent) (Brazil, 2016). The country also boasts one of the broadest market experiences with biofuels in the world (La Rovere et al., Reference La Rovere, Pereira and Simões2011), although offshore deep oil exploration has also gained impetus in recent years (Lefèvre et al., Reference Lefèvre, Wills and Hourcade2018).
Moreover, since the 15th UNFCCC Conference of the Parties (COP) in Copenhagen in 2009, Brazil has assumed a pioneering position among developing countries in terms of commitments to mitigate climate change (Hochstetler and Viola, Reference Hochstetler and Viola2012). On that occasion, it announced voluntary goals to decrease its emissions by 36.1 or 38.9 per cent by 2020 (against a reference scenario), which were translated into the National Policy on Climate Change (Law 12.187, from December 2009). These targets should be reached through emissions cuts from land-use changes and deforestation (24.7 per cent), agriculture (4.9 to 6.1 per cent), energy (6.1 to 7.7 per cent), and iron and steel production (0.3 to 0.4 per cent) (Brazil, 2008).
Recently Brazil increased its commitments to address climate change. Under the Paris Agreement, it has announced plans to cut its emissions by 37 per cent by 2025 and 43 per cent by 2030 (relative to 2005 levels) in its Nationally Determined Contribution (NDC) (UNFCCC, 2016). To achieve these targets, the Brazilian NDC highlighted its intentions to decrease deforestation, reforest degraded land areas, expand the use of renewable energy sources, increase energy efficiency and intensify agricultural and livestock production. In this context, it is highly relevant to understand the costs associated with these commitments, as well as alternative policy options to achieve them.
There are already several studies about GHG emissions control in Brazil. Rocha (Reference Rocha2003), Tourinho et al. (Reference Tourinho, da Motta and Alves2003), Ferreira Filho and Rocha (Reference Ferreira Filho and Rocha2008) and Feijó and Porto (Reference Feijó and Porto2009) investigated the impacts of carbon taxes on the Brazilian economy. Ferreira Filho and Moraes (Reference Ferreira Filho and Moraes2015) projected climate change impacts on Brazilian agriculture. EMCB (2010) analyzed the costs of reducing deforestation in the Amazon region, heavily deploying biofuels into the energy mix, and adopting carbon taxes, but each of these mitigation options were considered individually in alternative models.
Gurgel and Paltsev (Reference Gurgel and Paltsev2014) compared the economic impacts from sectoral carbon taxes and cap-and-trade schemes to achieve Brazil's voluntary targets under the Copenhagen Agreement. La Rovere et al. (Reference La Rovere, Pereira, Dubeux and Wills2014) also addressed the efforts to achieve these goals by mapping the initiatives and policy instruments proposed, although not simulating them. Magalhães et al. (Reference Magalhães, Carvalho and Domingues2016) simulated cap-and-trade scenarios on energy and industrial sectors. Lucena et al. (Reference Lucena, Clarke, Schaeffer, Szklo, Rochedo, Nogueira, Daenzer, Gurgel, Kitous and Kober2016) performed a multi-model comparison of carbon taxes and mitigation scenarios on energy sectors. Similarly, Kober et al. (Reference Kober, Summerton, Pollitt, Chewpreecha, Ren, Wills, Octaviano, McFarland, Beach, Cai, Calderon, Fisher-Vanden and Rodriguez2016) compared six models and country results for carbon tax scenarios in Latin America, including Brazil, while Octaviano et al. (Reference Octaviano, Paltsev and Gurgel2016) compared the economic impacts for Brazil and Mexico to meet their 2020 climate commitments. Magalhães and Domingues (Reference Magalhães and Domingues2016) investigated how energy efficiency measures may reduce GHG emissions in Brazil, while Lefèvre et al. (Reference Lefèvre, Wills and Hourcade2018) presented a similar analysis, but in the context of the country's official energy planning. Some efforts have also been made to measure the regional impacts of deforestation targets, as in Carvalho et al. (Reference Carvalho, Domingues and Horridge2017).
Some of these papers used static economic models adapted to incorporate environmental aspects or focus on emissions reductions only in some specific sectors, such as industry and energy, or else only on deforestation. Others considered only CO2 emissions, disregarding other GHGs. A few studies, such as Gurgel and Paltsev (Reference Gurgel and Paltsev2014) and Octaviano et al. (Reference Octaviano, Paltsev and Gurgel2016), addressed mitigation efforts in all sectors, but they restricted their analysis to mandatory cap-and-trade schemes alone. Therefore, to the best of our knowledge, none of these studies has been able to inform policy makers and society in general on the effects of the Paris Agreement targets, considering all mitigation efforts Brazil has committed to take. Also, none of these studies has compared alternative policy scenarios to achieve the country's emissions targets, including carbon pricing mechanisms and mitigation efforts based on land use, land-use change and forestry. Given Brazil's position as a major GHG emitter and its important role in global climate negotiations, such an investigation has domestic and international relevance.
Accordingly, this paper aims to estimate and compare the economic impacts of the Brazilian NDC with the impacts from alternative climate policies based on carbon pricing schemes. To do so, we adapt and employ a dynamic-recursive general equilibrium model of the world economy, namely, the MIT Economic Projection and Policy Analysis (EPPA) model, in its fifth version (Paltsev et al., Reference Paltsev, Reilly, Jacoby, Eckaus, McFarland, Sarofim, Asadoorian and Babiker2005; Chen et al., Reference Chen, Paltsev, Reilly, Morris, Karplus, Gurgel, Winchester, Kishimoto, Blanc and Babiker2017). Section 2 describes the model. Section 3 presents the results and section 4 presents our conclusions. Such an exercise gives us an indication of the likelihood that the country will adopt the necessary policies to fulfill its commitments, while also highlighting the trade-offs between alternative instruments to achieve the country's NDC.
2. Methods
Policies to reduce GHG emissions usually affect many economic sectors and agents. In order to evaluate the impacts of climate policies in Brazil, we use a computable general equilibrium (CGE) model that represents several emitting agents and sectors and captures the interdependencies between them in the economy. The model estimates the directions and magnitudes of exogenous shocks on the economy, allowing us to measure the effects and costs of alternative scenarios.
CGE models combine the abstract general equilibrium structure formalized by Arrow and Debreu (Reference Arrow and Debreu1954) with economic data to obtain supply, demand and price levels in equilibrium conditions in a set of specific markets. They are a standard tool of empirical analysis, widely used in welfare and distributive analyses. Kydland and Prescott (Reference Kydland and Prescott1996) and Shoven and Whalley (Reference Shoven and Whalley1984) discuss other aspects and details of CGE models.
We use the MIT EPPA model in its fifth version.Footnote 2 It is a dynamic recursive general equilibrium model of the world economy, built on the Global Trade Analysis Project (GTAP) database (Dimaranan and Mcdougall, Reference Dimaranan and Mcdougall2002; Narayanan and Walmsley, Reference Narayanan and Walmsley2008) with additional data about GHGs and other pollutants. EPPA considers a long-run simulation horizon (2005 to 2100) and incorporates all of the main GHGs (CO2, CH4, N2O, HFCs, PFCs and SF6). For instance, within the model, CH4 emissions from agricultural production stem from rice (production), enteric fermentation, manure management, waste, savannah and, indirectly, from deforestation.Footnote 3 Opportunities for mitigation of non-CO2 gases are also considered, calibrated from marginal abatement cost curves. The model also allows us to evaluate the economic impacts of mitigation policies, including welfare and equity measures.
EPPA aggregates GTAP data in 16 regions and 21 sectors (table 1). It is worth mentioning that the model distinguishes household (i.e., private automobiles) and industrial transportation and separately represents mature (e.g., hydro, nuclear, fossil) and alternative energy supply technologies (e.g., second-generation biomass).
Table 1. Regions, sectors and primary factors in the EPPA model
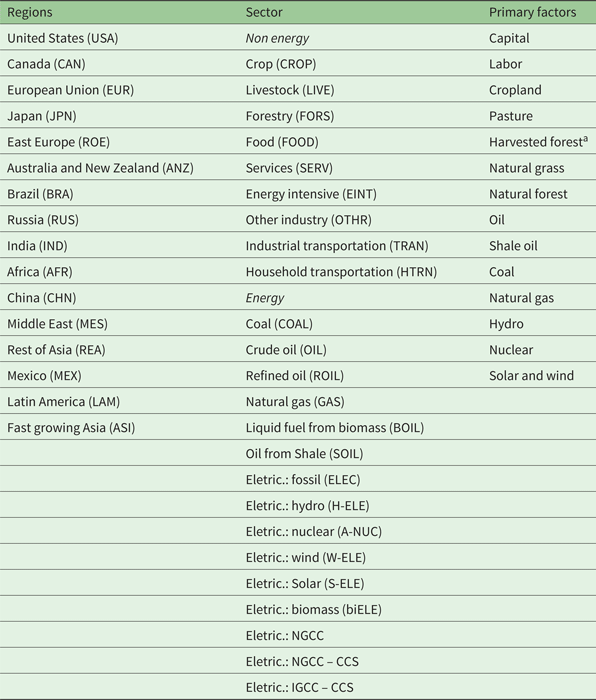
a Includes managed forest areas for forestry production and secondary forests previously used for wood extraction and agricultural purposes (natural vegetation re-growth).
Alternative energy sources are neither extensively used nor available in the benchmark year of the model (2004), but could potentially be demanded on a larger scale in the future, depending on energy prices and climate policies. To represent these technologies, EPPA takes detailed bottom-up engineering parameters into account, described by Chen et al. (Reference Chen, Paltsev, Reilly, Morris, Karplus, Gurgel, Winchester, Kishimoto, Blanc and Babiker2017), as well as Paltsev et al. (Reference Paltsev, Reilly, Jacoby, Eckaus, McFarland, Sarofim, Asadoorian and Babiker2005).Footnote 4 These so-called ‘backstop’ technologies are one way to represent technical changes in CGE models; here they include additional fuels (such as biofuels) and electricity generating technologies (such as wind and solar power), also listed in table 1.
EPPA is formulated as a mixed complementarity problem (MCP) in the General Algebraic Modeling System (GAMS) software (Brooke et al., Reference Brooke, Kendrick, Meeraus and Raman1988) and solved using a mathematical programming system for general equilibrium analysis as its modeling language (Rutherford, Reference Rutherford1995). In each period, production functions for each sector and region describe how capital, labor, land, energy and other primary factors and intermediate inputs are combined to obtain goods and services.
In each region of the model there is a representative agent maximizing its utility by choosing how to allocate its income to consume goods and services. The economic sectors are represented by a representative firm, which chooses primary factors and intermediate inputs to maximize its profits, given the available technology. The model has a complete representation of markets, which must achieve the equilibrium simultaneously. We illustrate the general model structure in MCP by presenting the three conditions to be fulfilled in this type of representation: zero profit, market clearance and income balance.
EPPA uses constant elasticity of substitution (CES) function forms to specify production and utility functions, including Cobb-Douglas and Leontief. Different levels of substitution among inputs and factors and between fuels, electricity and other emitting processes are enabled via the use of nested structures. Table 2 lists elasticity values for the production sectors in the model.
Table 2. Elasticities of substitution in production sectors in the EPPA model
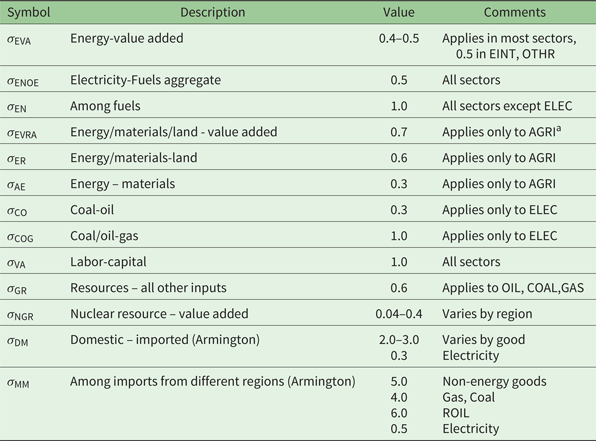
a AGRI sectors are: CROP, LIVE and FORS (sectors as defined in table 1).
Source: Paltsev et al. (Reference Paltsev, Reilly, Jacoby, Eckaus, McFarland, Sarofim, Asadoorian and Babiker2005).
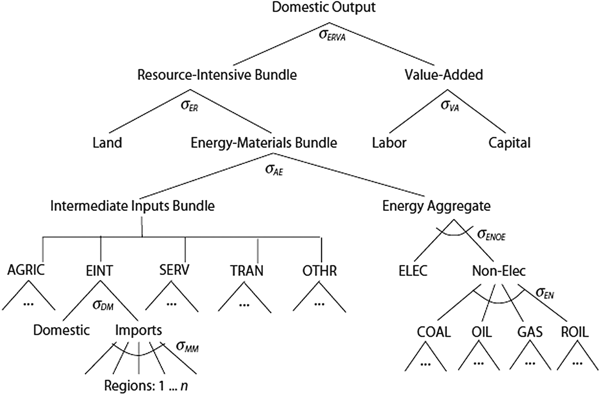
Figure 1 presents the technologies assumed in the agricultural sectors (crop, livestock and forestry) as an illustration. It shows several elasticities (σ ) governing the ability to substitute inputs and primary factors. The structure of the agricultural sector explicitly includes land and represents the tradeoff between land and an energy-materials bundle. This resource-intensive bundle enters at the top nest, with the value-added bundle. Because land as an input is critically unique in agriculture, the nested structure for agriculture allows for substitution between land and other inputs.Footnote 5
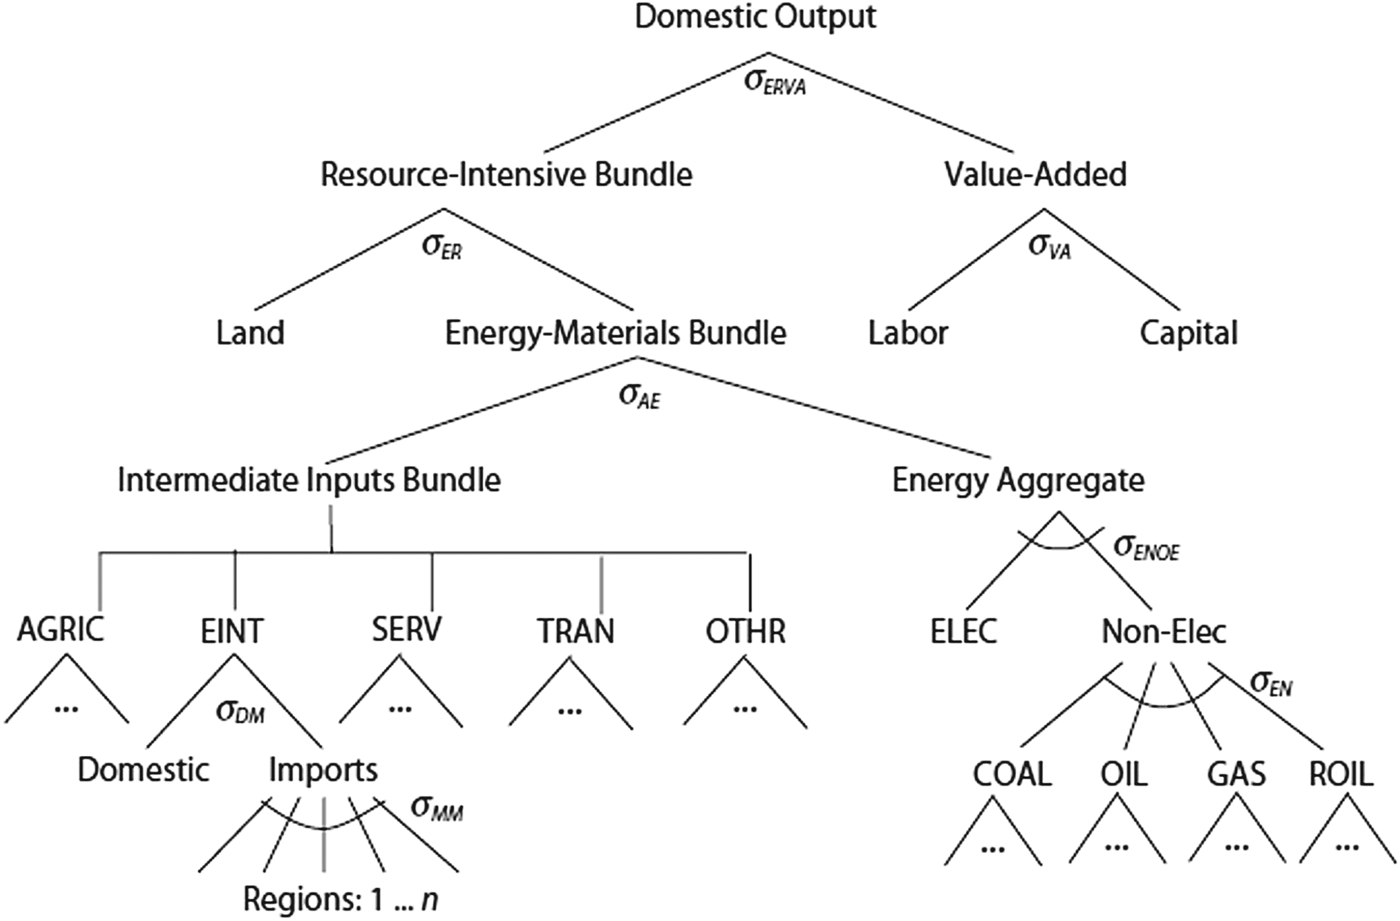
Figure 1. Structure of agricultural production sectors
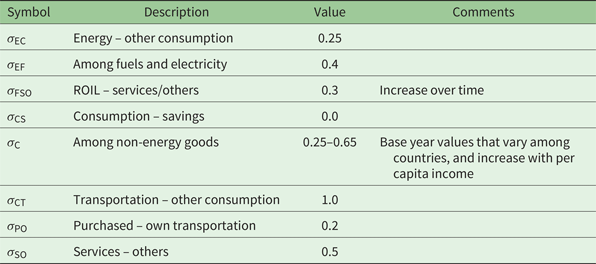
Figure 2 presents the nested CES structure used to represent household consumption. It considers the endogenous decision about consumption and savings at its top level and includes an energy nest completely separated from the household decision on transportation. That is, it splits the decision about fuel consumption for transportation and other energy uses. Families can also consume their own transportation services (composed of automobiles, fuel, maintenance parts and services, and insurance) or may buy transportation services from air, road and subway transportation companies. Table 3 presents the elasticities of substitution in consumption, i.e., final demand, in the EPPA model.
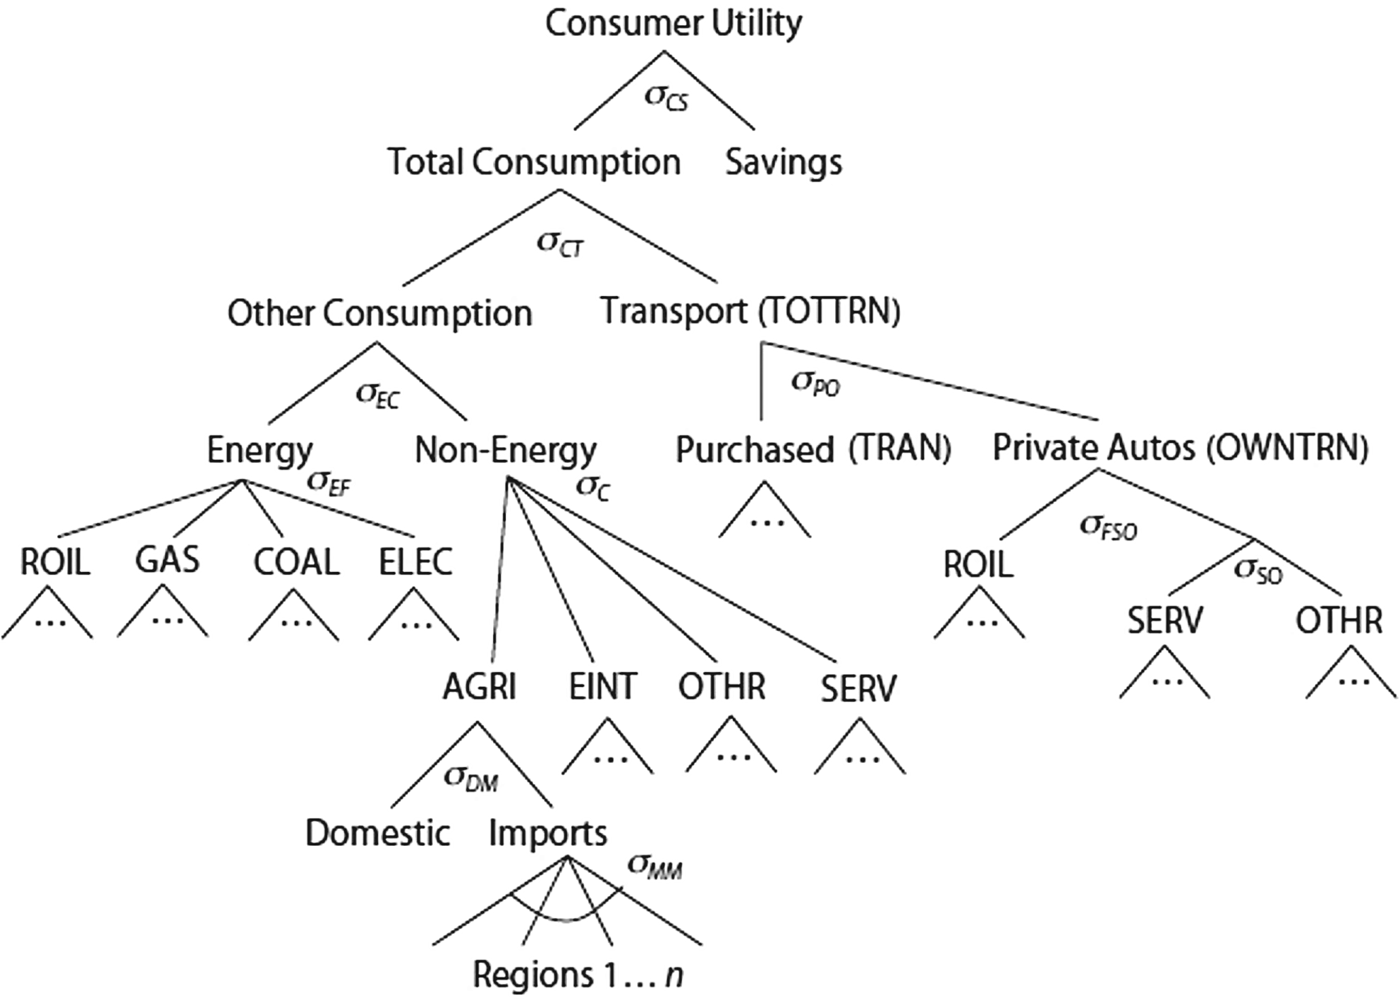
Figure 2. Structure of final demand in EPPA
Table 3. Elasticities of substitution in consumption in the EPPA model
Note: ROIL, refined oil.
Source: Paltsev et al. (Reference Paltsev, Reilly, Jacoby, Eckaus, McFarland, Sarofim, Asadoorian and Babiker2005).
For each period, the model's closure considers a fixed endowment of primary factors in each region, which are free to move among sectors, with the exception of the non-malleable fraction of capital.Footnote 6 Land is used only in the agricultural sector or to grow natural vegetation. One land use type can be converted to another if the full conversion costs are paid. Fossil fuels, nuclear and hydro resources are specific to the energy sectors using them.
The model does not consider unemployment, and prices are flexible. From the demand side, the marginal propensity to save is constant and regionally specified, given the benchmark share of savings in the aggregate household expenditure. International capital flows that compensate trade imbalances are exogenously specified to decline smoothly over time. This means that in each period an implicit real exchange rate will adjust to accommodate changes in export and import flows. Government expenditures react to changes in relative prices and tax revenues are subject to economic activity.
EPPA5's base year is 2004. The model simulates the economy recursively at 5-year intervals from 2005 to 2100. Economic development in 2005 and 2010 matches actual GDP growth data. Future growth scenarios are driven by savings and investment patterns and exogenous assumptions about productivity improvements in labor, energy, and land.
The demand for goods produced by each sector, including food and fuels, grows as GDP grows. The use of depletable resources decreases stocks, driving production to higher cost grades. Sectors that use renewable resources, such as land, compete for the available flow of services and rents stemming from them.
These parameters and assumptions, as well as the different policies modeled (e.g., constraints in the total amount of GHG emissions), change the relative economic appeal of different technologies over time and across scenarios. The adoption of advanced technologies, such as cellulosic bio-oil, is endogenous and happens as they become cost-competitive with existing technologies.
Population growth is based on long-run trends from the United Nations forecast (UN, 2009). Labor productivity improvements are specified to reproduce observed and expected average GDP levels from the International Monetary Fund (IMF, 2011). Physical units are used to represent energy data, according to the International Energy Agency (IEA, 2011). With regard to Brazil, we have compared this data with the most relevant domestic sources (IBGE, 2006; EPE, 2010, 2011, 2012; MCTI, 2014; Brazil, 2016). Data on GHG emissions in EPPA comes from Waugh et al. (Reference Waugh, Paltsev, Selin, Reilly, Morris and Sarofim2011).
2.1 Land conversion and competing uses
Each land-type area can be converted to another type or removed from agricultural production to a non-use category (secondary vegetation). Conversion is achieved by assuming that one hectare of land of one type is converted to one hectare of another type, assuring consistency between physical and economic accounting in the general equilibrium setting. Marginal conversion costs are equal to the difference in values between each land type, with real inputs being added during the conversion process through a land transformation function, following Gurgel et al. (Reference Gurgel, Reilly and Paltsev2007) and Melillo et al. (Reference Melillo, Reilly, Kicklighter, Gurgel, Cronin, Paltsev, Felzer, Wang, Sokolov and Schlosser2009). Finally, land is also subject to exogenous productivity improvements (Reilly and Fuglie, Reference Reilly and Fuglie1998).
Conversion of natural forest areas to agriculture produces timber and other forestry products. This transformation from natural vegetation to agricultural production is calibrated to represent a response in land supply. We assume that land conversion patterns in the last two decades are representative of the long-term response: price elasticities of supply of land for each region are calculated from observed annual averages for land price increases and conversion rates (from natural forest to managed land), in percentages, from 1990 through 2005.
3. Results
3.1 BAU and climate policy scenarios
Brazil's NDC envisions and explicitly describes several mitigation strategies in order to reduce the country's emissions by 43 per cent by 2030, compared to 2005 levels. These include: achieve zero illegal deforestation; restore and reforest 12 million hectares (ha) of forests; increase the share of sustainable biofuels in the energy mix to 18 per cent; achieve 45 per cent of renewable energy sources in the energy mix; increase the share of renewable energy sources in the power supply to 23 per cent; achieve efficiency gains of 10 per cent in the electricity sector; restore 15 million ha of degraded pastures; and expand the area of integrated cropland-livestock-forestry systems by 5 million ha (UNFCCC, 2016).
We simulate different policy scenarios to investigate alternative ways to achieve Brazil's proposed targets and compare the results, in terms of GHG emissions and economic performance, with those from a Business as Usual (BAU) scenario. These scenarios enable us to analyze the existing measures planned by the Brazilian government to curb emissions, as well as alternatives for carbon pricing instruments (not explicitly included in Brazil's current or proposed policy mix).
First, we consider those strategies described in the Brazilian NDC, with a mix of sectoral incentives (subsidies) to renewable energy, agricultural and livestock expansion, and penalties (taxes) to deforestation. Following this, we implement alternative scenarios with carbon pricing instruments, simulated as different configurations of a cap-and-trade scheme, given that carbon prices are endogenous in our model. Here we envisage two main alternatives: sectoral cap-and-trade systems, with equivalent emissions cuts (in relative terms) for each economic sector; and an economy-wide carbon market, covering all sectors, excluding emissions from deforestation, which are constrained by a specific tax on it.Footnote 7 These cap-and-trade (C&T) scenarios are first imposed on all GHGs and later only on CO2 emissions.Footnote 8
Table 4 briefly presents all scenarios. We simulate the model from 2010 to 2050, and mitigation strategies start in 2020. Climate policies in Brazil are implemented to achieve its reduction targets announced under the Paris Agreement. After 2030, we keep constraining emissions linearly to reach a level of emissions that is 50 per cent below those observed in 2005.
Table 4. Scenarios simulated
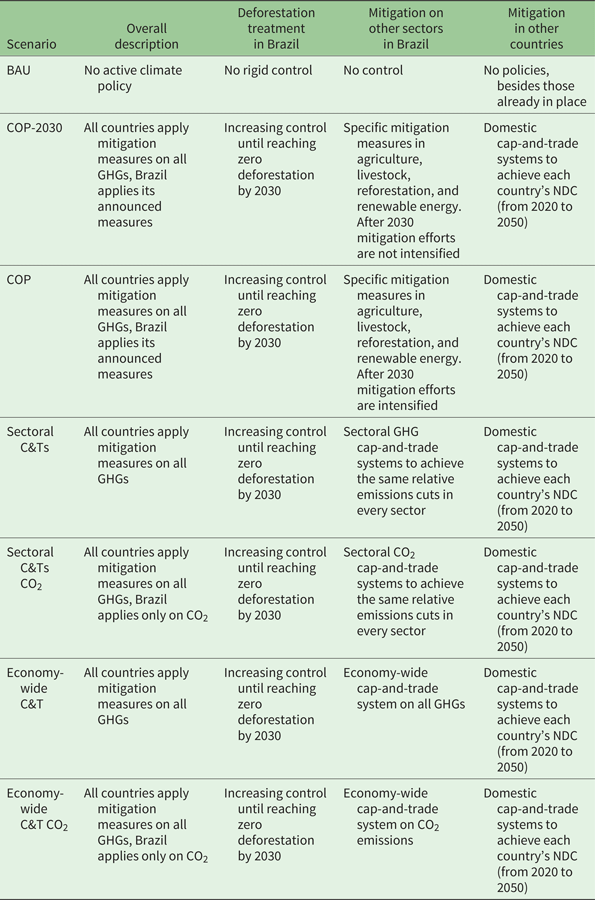
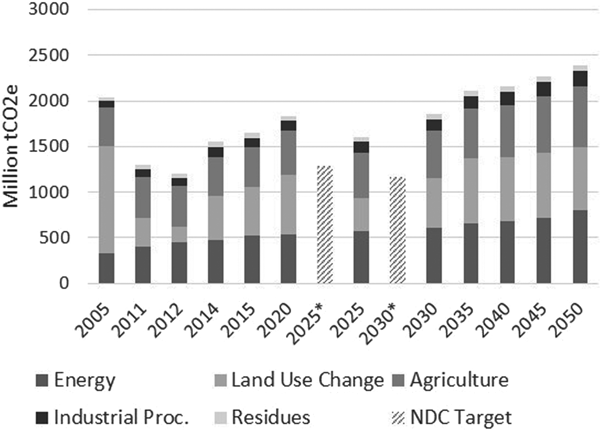
Figure 3 shows Brazil's GHG emissions trajectory in the BAU scenario. From 2005 to 2012, data comes from official sources (early emissions estimates) (MCTI, 2014). Data for 2014 comes from the independent initiative ‘Sistema de Estimativa de Emissão de Gases de Efeito Estufa’ (SEEG, 2017). EPPA projects GHG emissions from 2015 onwards. Figure 3 presents the expected level of emissions by 2025 and 2030.Footnote 9

Figure 3. GHG emissions in Brazil. *Emissions targets under the Paris Agreement
The model produces an increasing trend in emissions, especially from the energy sector. Emissions from land-use changes and agriculture retain larger shares in total emissions during the entire projection. Total emissions reflect: expected economic growth; increased use of fossil fuels in the energy mix; and the expansion of the agricultural sector. The rate of economic growth is one of the most important drivers of emissions in the BAU scenario. These rates range from 2.48 to 2.80 per cent per year between 2015 to 2050 and are in alignment with IMF projections, with the exception of the first five years (until 2020), which have a slightly higher growth rate in EPPA.
Land-use changes are another relevant driver of GHG emissions in Brazil. Figure 4 shows expected changes in land-use patterns under the BAU scenario, in cumulative terms, compared to 2015. These changes reflect the average rate of deforestation in the Amazon and Cerrado (Brazilian Savannah) biomes from 2000 to 2010 and are indicative of a BAU scenario that considers weak deforestation controls after 2015. Land-use changes projected by the model also reveal an increase in cropland area from 51 million ha in 2015 to 95 million ha in 2050. Total area dedicated to pastures would fall from 182 million ha in 2015 to 175 million in 2050, following current trends (IBGE, 1995, 2006; LAPIG, 2015).

Figure 4. Cumulative land-use changes in the BAU scenario compared to 2015
3.2 Emissions trajectories
Table 5 presents total GHG emissions in Brazil for each of the alternative scenarios, relative to the BAU scenario. After 2030, targets were set to reach 50 per cent emissions reductions by 2050 relative to 2005 emissions. The scenario COP-2030 simulates the actions proposed in the Brazilian NDC. Table 5 shows that these would not guarantee that the country would reach its targets, although it would draw close.
Table 5. GHG emissions in Brazil in the alternative scenarios (% of BAU emissions)

Source: Model results.
Possible (partial) explanations for this result are the lack of current measures for GHG emissions and sequestration from pasture areas, as well as those emissions reductions and sequestration stemming from recovered pasture areas and integrated crop-livestock-forest systems. These are not present in Brazil's official GHG inventories. Thus, we do not have the necessary data to represent them in the model. Nonetheless, we implement measures related to them, such as pasture recovery and the expansion of integrated systems.
A first lesson from our results is the urgent need to create methodologies and mechanisms to measure and register emissions from the processes mentioned above, as well as to include them in the country's official GHG inventory.
Table 5 also shows that the COP-2030 scenario does not avoid an increase in emissions after 2030, since there is no intensification of efforts to reduce emissions through sectoral mitigation actions, such as incentives to renewable energy sources, forest recovery and intensification in agricultural and livestock production. Given that many other relevant emissions sources are not directly covered by Brazil's NDC (e.g., energy-related fossil fuel emissions), total emissions grow beyond 2030, once again drawing closer to the BAU scenario.
In the COP scenario, we assume increasing efforts to reduce emissions after 2030, using the same mitigation actions as in COP-2030. These efforts allow emissions to stabilize at 1.3 billion tons of CO2 eq per year, but are not able to achieve increasingly reduced targets beyond 2030 (below 43 per cent of the 2005 levels).
Brazil's proposed actions at COP21 are based on stopping deforestation, restoring forest areas, increasing the use of renewable energy sources and intensifying agriculture and livestock production. Given that deforestation will be controlled by 2030 and carbon sequestration from intensified agriculture is not accounted for, the model results just mean that there are some limits to curbing emissions by expanding the share of renewable sources in the energy mix.
Since current policy proposals will have reached their potential to reduce emissions by 2030, the country needs to consider additional mitigation strategies in the long term. Possible avenues are adopting carbon pricing mechanisms and covering a broader number of economic sectors and activities in its policies.
In this sense, we designed cap-and-trade scenarios that reach the proposed emission targets. In the sectoral C&T scenarios, all sectors reduce emissions by the same percentage. In the economy-wide scenarios, we set a quantitative emissions target (table 5) to the whole economy and let the model generate the equivalent national carbon price to reach it.
3.3 Economic costs
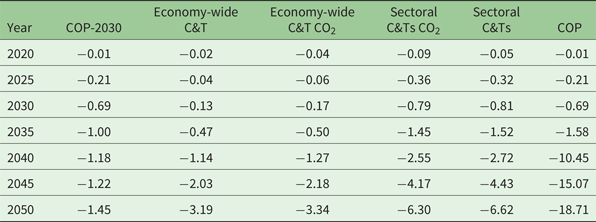
Alternative climate policy scenarios induce different changes in the relative prices of energy inputs and emissions-intensive activities, thereby altering the choices made by both consumers and producers. These changes determine the impacts on the aggregated economic activity, measured here by variations in GDP relative to the BAU scenario (table 6).
Table 6. Changes in GDP (%) relative to BAU
Source: Model results.
Economic impacts are relatively small until 2030, reaching at most a 0.8 per cent lower GDP in the Sectoral C&Ts scenario. The COP-2030 and COP scenarios lead to a 0.7 per cent decrease in GDP by 2030. This result suggests that the Brazilian proposals under the Paris Agreement were well designed: they target efforts in those sectors with relatively low abatement costs. Such a decrease in GDP seems modest, given the benefit of achieving 43 per cent emissions reductions relative to 2005 levels.
Beyond 2030, however, low-cost mitigation opportunities become scarce, and costs increase fast. The scenario COP-2030 is the only one that does not lead to higher costs, since mitigation efforts are not intensified; emissions, though, are considerably higher. On the other end, the COP scenario produces unreasonable GDP losses. Since cheaper emissions reductions through stopping deforestation and reforesting are finished by 2030, the only mitigation measure in this scenario is increasing incentives to renewable energy sources. A 19 per cent loss in GDP by 2050 suggests that these incentives would lead to too many distortions in the economy and quickly reach the limit for the expansion of renewable sources in the country. Consequently, carbon pricing strategies are better options to curb GHG emissions in the long run.
Sectoral C&Ts affect GDP by minus 1.5 per cent in 2035. This impact reaches negative 6.6 per cent by 2050 in order to achieve 50 per cent emissions reductions compared to 2005 levels. These are expressive numbers, but much smaller than those from the COP scenario. A broader coverage divides the burden of cutting emissions among all sectors in the economy. However, as every sector needs to reduce emissions by the same relative amount, the sectoral C&Ts do not enable the best allocation of resources, given that those sectors facing higher mitigation costs need to reduce emissions by the same share as those with lower costs.
The Economy-wide C&T produces the lowest negative impact on GDP. GDP losses by the year 2035 remain around 0.5 per cent in these scenarios, and reach only 3.3 per cent by 2050, in other words, half of the losses in the Sectoral C&T scenarios. This difference is only due to the possibility of the sectors with higher mitigation costs buying carbon allowances from those with lower mitigation costs, leading to an efficient outcome. Given the complexities involved in setting up and implementing a cap-and-trade program, these results show the importance of planning institutions and instruments well in advance in order to guarantee future emissions reductions at a lower total economic cost to the country.
3.4 Sectoral and economy-wide carbon prices
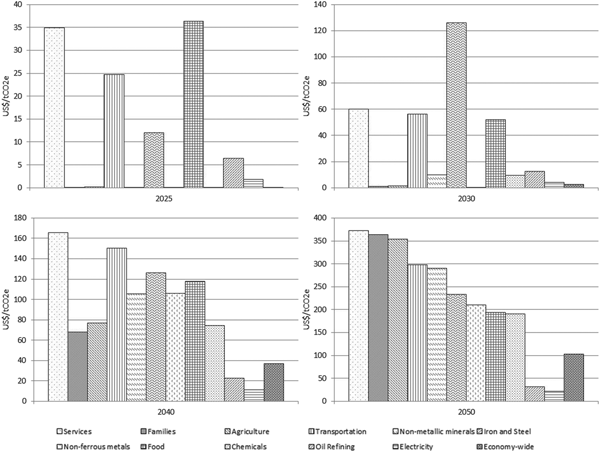
Figure 5 shows the carbon prices achieved in each sector through the Sectoral C&Ts and the carbon price negotiated in the overall economy in the Economy-wide scenario in four different years (2025, 2030, 2040 and 2050). As sectors have different mitigation opportunities and capacities to substitute between energy sources and technologies, those with higher costs will face higher prices. This is the case of the services sector, which produces low levels of emissions but does not have many alternative energy sources or low-carbon technologies available; any reductions in emissions impose big challenges to the sector. Ambitious emissions reductions for the services sector are only possible at very high prices, reaching US$370/ton of CO2 eq by 2050.
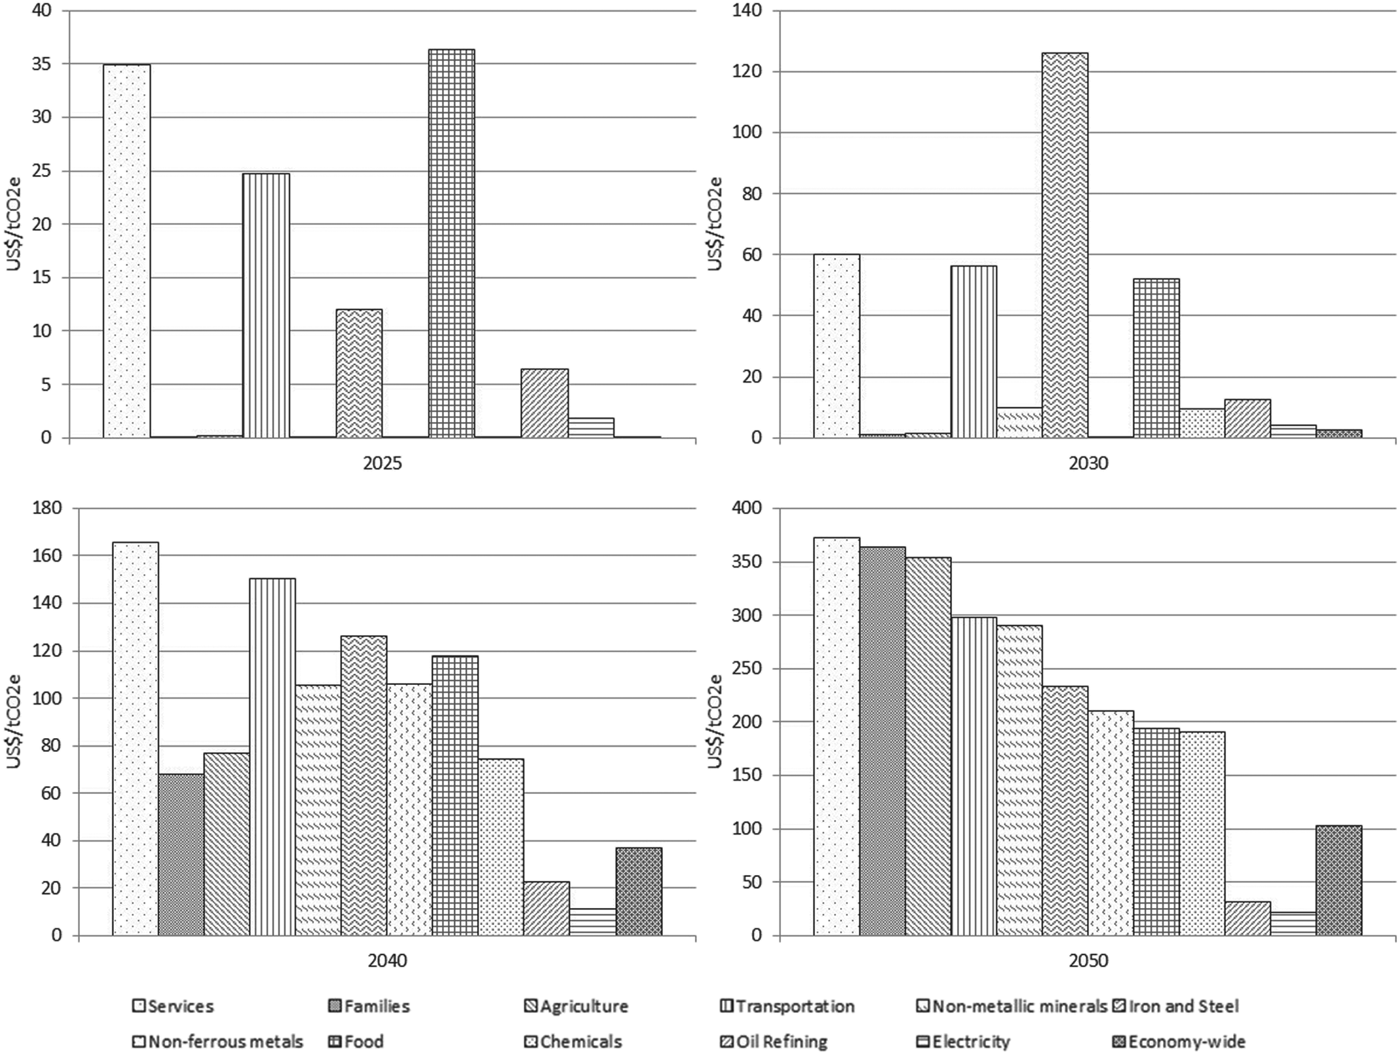
Figure 5. Sectoral and economy-wide carbon prices (2025, 2030, 2040, and 2050)
The agricultural sector can cheaply cut emissions until 2030 (under US$2/ton of CO2 eq), not only through reduced deforestation, but also via abatement opportunities from better management and input use that lead to lower CH4 and N2O emissions from livestock, waste, and fertilizer application. In a longer timeframe the costs for this sector rise to US$354/ton of CO2 eq (in 2050), reflecting the exhaustion of these opportunities.
The carbon price in the Economy-wide scenario is remarkably low when compared to those of most economic sectors (in Sectoral C&Ts), reaching only US$3/ton of CO2 eq by 2030 and rising to US$103/ton of CO2 eq by 2050. These numbers highlight the existence of cheap mitigation opportunities for the Brazilian economy until 2030. However, they also show how these opportunities are all taken by 2050. These results reinforce the conclusion that future mitigation policies need to be designed early and to take into consideration the lowest overall impact on economic efficiency, for instance by involving all economic sectors under a single instrument.
We can compare our results to a few others found in the literature, although none of the other studies have simulated and compared full NDC implementation and carbon pricing in Brazil. There are other differences in models, baseline trajectories and policy assumptions. Gurgel and Paltsev (Reference Gurgel and Paltsev2014) is the closest; they used an older version of the EPPA model to find 1.5 per cent of GDP loss in Brazil to achieve 38 per cent emissions reductions in 2020 at a price of US$50/ton of CO2 eq. Their baseline scenario does not assume any deforestation control at all, generating much higher emissions in the baseline and imposing stricter mitigation efforts on other sectors in 2020. We achieve similar carbon price and GDP losses in our Sectoral C&Ts scenarios in 2035, which, in fact, shows mitigation efforts from industrial and agricultural sectors similar to those simulated by them. Lefèvre et al. (Reference Lefèvre, Wills and Hourcade2018) found similar GDP impacts in 2030 from mitigation efforts and efficiency measures in the energy system, but they did not consider mitigation in land-use change and the agricultural sector.
4. Conclusion
The goal of this paper was to investigate the emissions trajectories and economic impacts stemming from different climate policy scenarios in Brazil. We simulate those mitigation strategies proposed by the country under the Paris Agreement in its NDC as well as other scenarios, even going beyond 2030. The Brazilian NDC targets emissions reductions by stopping deforestation, increasing the adoption of low-carbon practices in agriculture, improving energy efficiency and expanding the share of renewable sources (such as biomass, wind, solar and hydropower) in the energy mix.
We model most of these through incentives (subsidies) to increase supply, but also as taxes on emissions from deforestation. We also implement alternative scenarios with carbon pricing (cap-and-trade) mechanisms both separately for each sector (Sectoral C&Ts, forcing every sector to reduce emissions by the same percentage) and for the whole economy (Economy-wide C&T). Both alternative scenarios are set to achieve the country's overall emissions target under the Paris Agreement.
The strategies contained in the Brazilian NDC bring the country close to achieving its target for 2030; difficulties in measuring emissions reductions and carbon sequestration in the agricultural sector and in expanding the share of renewable energy sources are the main factors hindering full achievement. Further efforts to reduce emissions beyond 2030 would require changes in the country's climate policies, since all potential reductions from deforestation and renewable energy would be finished.
The economic costs of the Brazilian NDC are relatively small until 2030: a 0.7 per cent decrease in GDP relative to a BAU scenario. However, the same emissions target may be achieved with less than 0.2 per cent decrease in GDP if a cap-and-trade system is adopted. The carbon price to be paid under a national cap-and-trade scheme will be as low as US$3 per ton of carbon equivalent in 2030, but can reach U$103 per ton in 2050 if Brazil pursues additional emissions reductions.
If sectoral cap-and-trade systems are applied to make each economic sector reduce emissions by the same ratio, carbon prices may vary from US$0.5 to US$60 per ton by 2030, and from US$25 to US$370 per ton by 2050. These results show the potential of relatively cheap emissions reductions from land-use changes and agriculture in the short run, but the need for a quick turn in climate policies towards some broad-based carbon pricing system in order to avoid high costs to society.
Such an analysis, encompassing all emissions sources, is unique for Brazil and provides valuable insights concerning the likelihood that the country will adopt the necessary measures to fulfill its international commitments. Although the adoption of an economy-wide cap-and-trade system greatly reduces the economic costs associated with emissions reductions, it may also require more political bargaining and increase the transaction costs related to monitoring GHG emissions from different sources and activities. In this sense, a sensible strategy for Brazil would be to establish the necessary institutions to operate such a carbon-pricing instrument, while it reduces emissions cheaply from deforestation and agriculture.
Author ORCIDs
Gustavo Velloso Breviglieri 0000-0001-7268-8770.
Acknowledgements
This research was supported in part by the National Council for Scientific and Technological Development (CNPq) of Brazil. The MIT Economic Projection and Policy Analysis (EPPA) model used in this study is supported by a consortium of governments, industry, and foundations, sponsors of the MIT Joint Program on the Science and Policy of Global Change. For a list, see: http://globalchange.mit.edu/sponsors/all.


