INTRODUCTION
In 1997 the World Health Organization advised all countries to start universal vaccination against hepatitis B. In The Netherlands the incidence of hepatitis B virus (HBV) infections has been low in recent years, at around two reported acute infections per 100 000 inhabitants in 2003 [Reference Koedijk, Op de Coul and van de Laar1]. For this reason, instead of universal vaccination, a targeted risk-group vaccination campaign was initiated in 2002, focusing on specific risk groups, namely, commercial sex workers, injecting drug users, men having sex with men (MSM), and heterosexuals with a high rate of partner change [Reference Heijnen2].
A pilot programme for the risk-group vaccination campaign was conducted in Amsterdam in 1998–2000. Between 1998 and 2003, about 10% of MSM received all three vaccine doses and an additional 5% received two doses [Reference van Houdt3]. However, only a marginal decrease in the incidence of acute HBV infection among MSM in Amsterdam has been observed since the introduction of vaccination, from 70 reported acute HBV cases in 1992–1997 to 64 cases in 1998–2003, reported evenly over time in the two periods [Reference van Houdt3]. Although the vaccination rate is still rather low and the immunization programme has been in force only for a short period of time, other factors may have further reduced the impact of vaccination. For instance, it may be that mainly low-risk men (those who engage the least in risky sexual practices and contribute the least to transmission) have been vaccinated or that men are vaccinated too late to prevent infection, since the average age at vaccination has been shown to be higher than that at infection [Reference van Houdt3]. Another explanation is that the increased sexual risk behaviour in the last 10 years [Reference Dukers4] offsets the effect of vaccination and, thus, incidence remains stable. This means that endemic circulation of the virus persists and vaccination has not reduced the reproduction number in this population below 1.
If the current vaccination campaign is ineffective, alternatives have to be sought, such as targeting specific subgroups of the risk groups or shifting from risk-group to universal vaccination. In this paper, we attempt to explain the stability in the incidence of HBV by investigating the impact of vaccination on the spread of HBV among MSM and how that is affected by changes in risk behaviour. Using a mathematical model, different vaccination campaigns are evaluated for their impact on the incidence of HBV. Furthermore we investigate to what extent a reduction in HBV incidence due to vaccination can be offset by an increase in incidence due to higher sexual risk behaviour.
METHODS
The model
A simple model was developed (Fig. 1), based on previous work for HBV [Reference Williams5, Reference Zhao, Xu and Lu6]. The population of MSM is divided into six classes, according to infection and vaccination status: uninfected, latent (infected but not infectious), acute infections, chronic infections (or carriers, who are less infectious than those with acute infection), those with protective immunity, and vaccinated. We also distinguish six levels of risky sexual behaviour, as measured by the number of sexual partners with whom men have unprotected anal intercourse. It is assumed that the mixing between and among risk groups is proportionate, which means that the fraction of contacts of group A allocated to group B is given by the fraction of all contacts that are offered by group B. Unlike previous studies (see e.g. [Reference Kretzschmar7, Reference Goldstein8]), the population was not stratified by age, because for individuals aged >10 years, only small variations in the biological properties of HBV are known according to age. Since the present study is focused on the transmission of HBV among MSM, sexual contact is the main transmission route and hence the population consists only of sexually active men, aged 15–70 years.
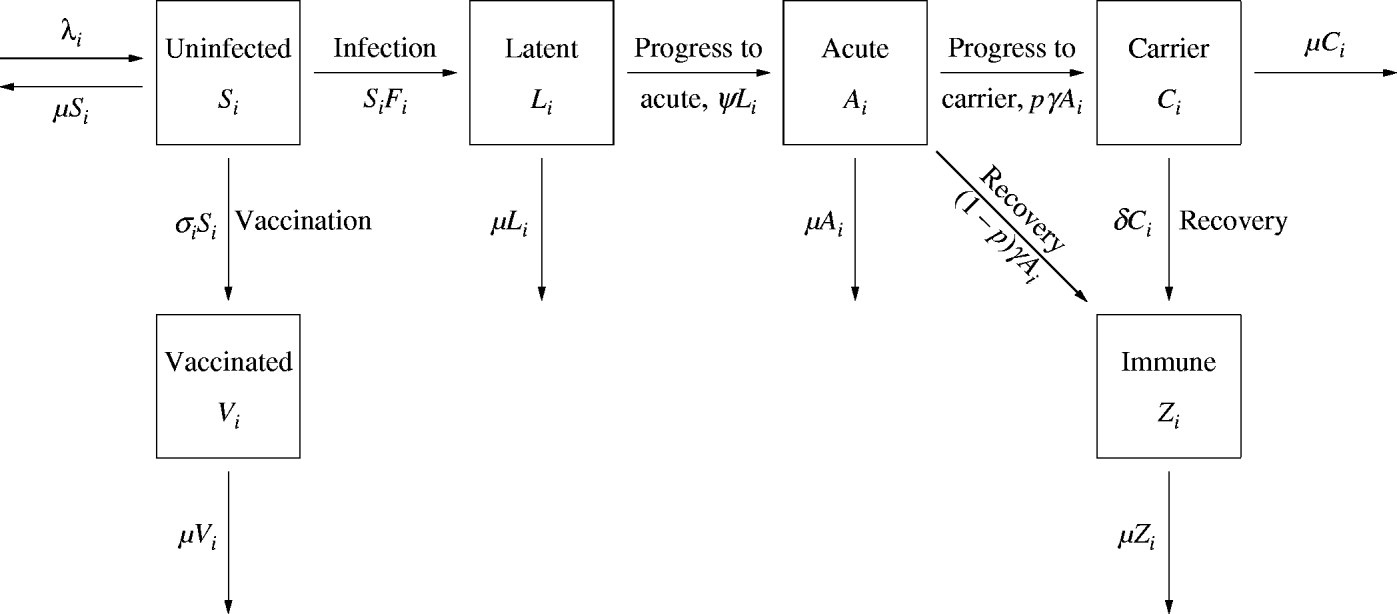
Fig. 1. Flow diagram of the model for the transmission of hepatitis B virus among men who have sex with men. The population is divided into different sexual risk groups, denoted with the subscript i. Men enter the ith risk group at a rate λi and depart the population at μ per capita. (See text and Table 1 for details.)
Men enter the population when they become sexually active and depart when they cease sexual activity. It is assumed that all men are uninfected when they become sexually active. Phylogenetic analyses of hepatitis B sequences have indicated that very limited transmission between the homosexual and heterosexual populations of Amsterdam takes place [Reference van Steenbergen9]. Moreover, the import of HBV through partners from HBV-endemic countries has been shown to be very small among MSM [Reference Hahné10]. Therefore, we considered that the contribution to HBV transmission from import of transmission (the source of infection is outside the Amsterdam MSM population) is negligible. It was assumed that uninfected individuals are vaccinated at a constant rate and that vaccination provides lifelong protection against chronic carriership.
Parameter values
For the parameters relating to sexual behaviour and the biological properties of HBV, uncertainty analysis was carried out. A range of values was assigned to these parameters and, using Latin Hypercube Sampling, 100 sets of values were sampled from these ranges. The model equations (see Appendix) were solved numerically for all parameter sets for a baseline scenario without vaccination and changes in sexual risk behaviour until the system stabilized. Only those parameter sets resulting in non-zero incidence were solved further for scenarios with vaccination and/or changes in risk behaviour, introduced at the same time-point. The ranges and the definitions of the parameters are shown in Table 1.
Table 1. Parameter definitions and values
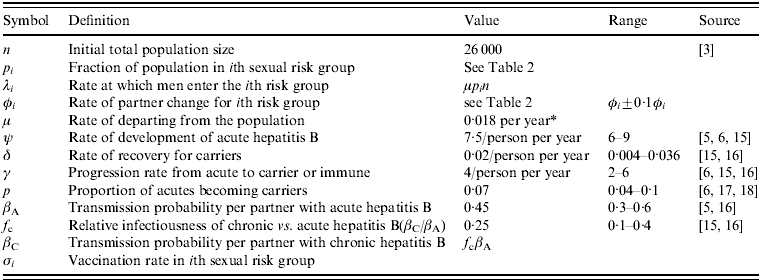
* Assuming that men are sexually active for 55 years on average (ages 15–70 years).
Vaccination rate
Within 6 years, about 10% of MSM received all three vaccine doses and an additional 5% received two doses [Reference van Houdt3]. Therefore, an average vaccination rate throughout the whole population of about 0·02 per year was used in the numerical results. Other hypothetical values for the vaccination rate were also examined. The vaccination rate was used as a control parameter and not as an uncertain parameter in order to observe the effect on the epidemic of a specific vaccination coverage.
Sexual risk behaviour
The Amsterdam Cohort Study on HIV and AIDS among MSM was initiated in 1984 [Reference Davidovich, de Wit and Stroebe11]. Participants visit the Health Services of Amsterdam every 3–6 months, they are tested for HIV, and complete a questionnaire about their sexual behaviour. For the estimation of risk behaviour, we used data collected in 1999, shortly after the start of the HBV vaccination programme. Data comprised of numbers of steady and casual partners and frequency of condom use, from which we calculated the annual number of partners with whom each participant had unprotected anal intercourse (referred to as sexual risk behaviour in this article). According to the annual numbers of partners reported, men were divided into six risk groups, numbered from 1–6, from lowest- to highest-risk behaviour. The proportions of the population in each risk group and their sexual behaviour are summarized in Table 2. For the uncertainty analysis, a range of 90–110% of the mean number of partners per year was used.
Table 2. Parameters relating to the sexual risk groupsFootnote *
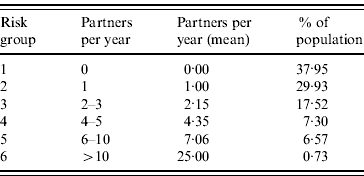
* Estimated from the Amsterdam Cohort Studies among young homosexual men, 1999 (see Methods section).
RESULTS
The pre-vaccination level
At the endemic equilibrium, before the introduction of vaccination, a large proportion of the high-risk groups, but a small proportion of the low-risk groups are infected (Table 3). In the whole population of MSM, the median prevalence of acute hepatitis B is 0·055% and of chronic hepatitis B 0·313%. The median incidence is 194·01/100 000 persons per year in the total population. The most risky groups (5 and 6) comprise only 7·5% of the population, but account for 62% of new infections. The basic reproduction ratio R 0 (see Appendix for details) lies in the interquartile range (IQR) 1·48–2·47, with a median of 1·95, for all 100 parameter sets. The infection persists in 98 of the parameter sets, with reproduction ratio >1 (median 1·96, IQR 1·49–2·51).
Table 3. Prevalence of acute and chronic hepatitis B, incidence and distribution of new hepatitis B infections per sexual risk group, at the endemic equilibrium without vaccination

Values are median (interquartile range).
* Overall risk groups (in the whole population).
Effect of vaccination, without changes in risk behaviour
First we investigate the effect of vaccination on the incidence of HBV, without any changes in sexual risk behaviour. Three scenarios are examined with an average vaccination rate across the six risk groups of 0·02 per year (see Fig. 2): (i) the vaccination rate is equal to 0·02 in all groups; (ii) the more risky men are less frequently vaccinated (for instance, because they also take the risk not to get vaccinated); (iii) the less risky men are less frequently vaccinated (for instance, because they are less informed or less motivated to get vaccinated).
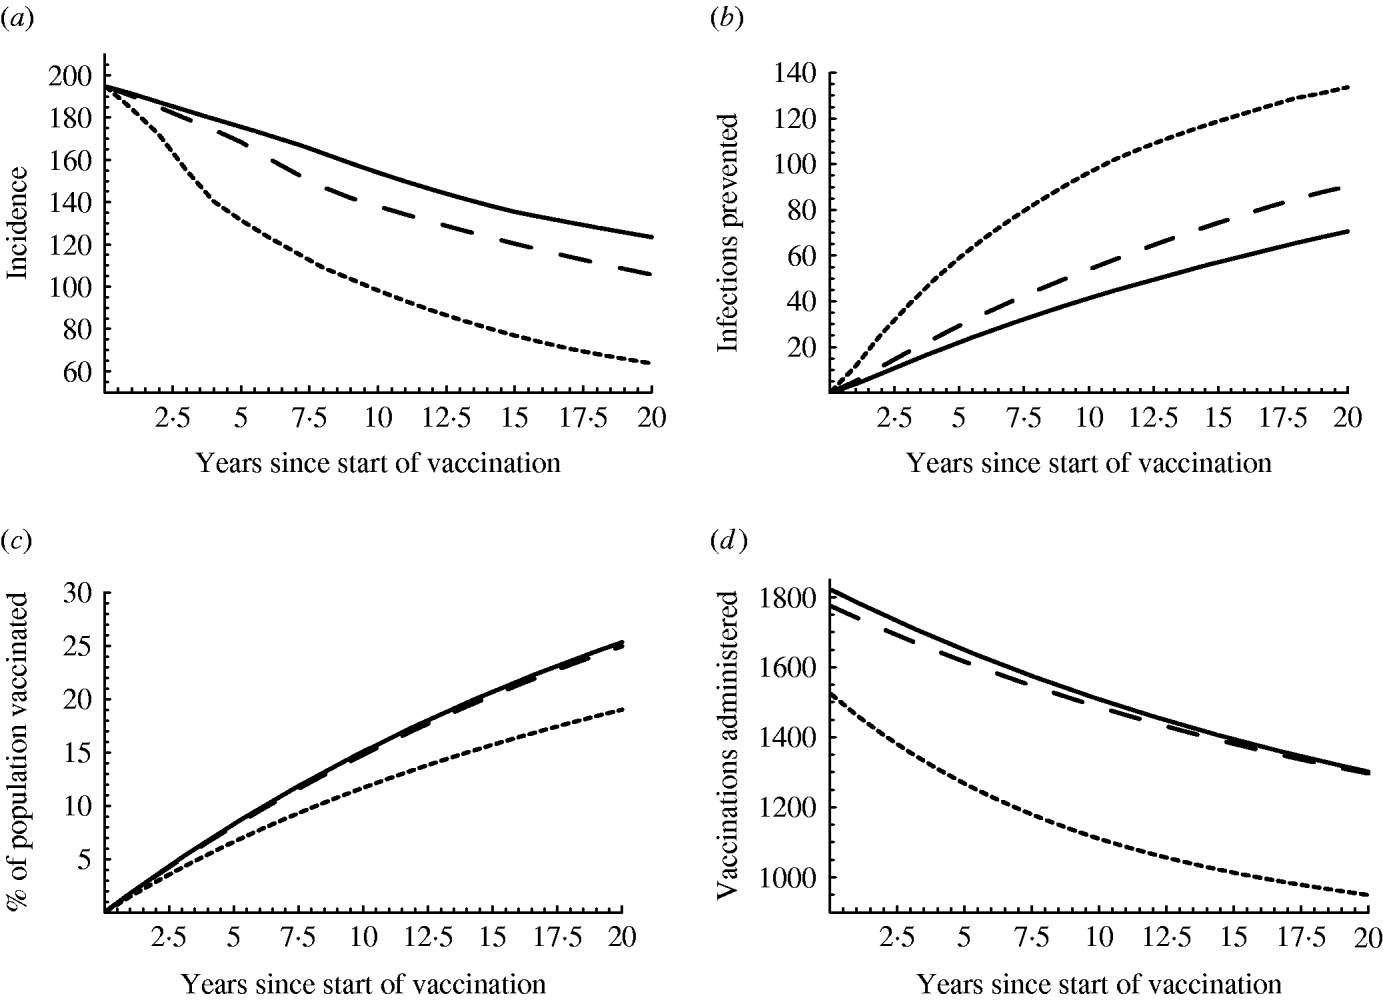
Fig. 2. Effect of vaccination: (a) incidence/100 000 men per year, (b) infections prevented/100 000 men per year, (c) percentage of the population vaccinated, (d) number of men receiving three-dose vaccine/100 000 men per year. In all cases, the average vaccination rate is 0·02 per year, but the vaccination rate is 0·01 in risk groups 4–6 and 0·0217 in groups 1–3 (solid line, ——); the vaccination rate is 0·01 in risk groups 1–3 and 0·0785 in groups 4–6 (dotted line, - - - -); the vaccination rate is 0·02 in all groups (dashed line, — — —). At each time-point, the median of the results with the different parameter sets is plotted.
With a vaccination rate of 0·02 in all groups, the decrease in incidence is in general rather slow; from 195 new infections/100 000 per year, it decreases to 170 after 5 years and to 140 after 10 years (dashed line in Fig. 2 a). If the vaccination rate is higher in the low-risk groups than in the high-risk groups (solid line), the decrease in incidence is even slower, but it is faster if the vaccination rate is higher in the high-risk groups (dotted line). The small decline in the beginning of the vaccination campaign can be explained by the high prevalence of chronic cases at the time that vaccination was introduced (Table 3), since those with chronic infection are not vaccinated and hence continue to transmit the infection. However, the number of infections prevented each year due to vaccination increases with time (Fig. 2 b), because vaccination protects from infection also those unvaccinated (due to herd immunity) and because the fraction of the population that is vaccinated increases in time, for instance, from 8% in the fifth year of the vaccination campaign to 15% in the tenth year (Fig. 2 c). However, the number of vaccinations administered per year (number of men receiving the three-dose vaccine/100 000 population) decreases in time (Fig. 2 d): the percentage of the population that is vaccinated increases, the percentage that is susceptible decreases, and less vaccinations are administered. Combining the above results, vaccination becomes more effective in time: for a population of 100 000 men, 1600 men get fully vaccinated and 30 new infections are prevented in the fifth year of the vaccination campaign; in the tenth year, 1500 men get vaccinated and 50 infections are prevented. If high-risk men are more frequently vaccinated, then even more infections will be prevented, while less vaccinations will be given: 1250 vaccinations and 60 prevented infections in the fifth year, 1100 vaccinations and 95 prevented infections in the tenth year.
If the vaccination coverage is 0·02 in all risk groups, the basic reproduction ratio is slightly less than 1 (median 0·93, IQR 0·73–1·19). In 43% of the parameter combinations examined, R 0 is >1, which means that the reduction in incidence is temporary; incidence eventually stabilizes at an endemic level and the infection persists. In the remaining 57% of the cases, R 0 is <1, incidence declines slowly and eventually the infection is eliminated. Although eradication seems of no practical meaning, because it needs an unrealistically long time to materialize, it is important to know that the conditions are such that if they do not change, incidence will continue to decline and eradication could be achieved. With an average vaccination rate of 0·02 and high vaccination coverage among the low-risk groups, R 0 is >1 (median 1·22, IQR 0·93–1·57); incidence declines, but the infection persists. With high vaccination coverage among the high-risk groups, R 0 is much less than 1 (median 0·47, IQR 0·36–0·60); incidence declines fast and the infection is eradicated.
If the vaccination campaign is intensified and the vaccination coverage is increased, larger reductions in incidence will be achieved (Fig. 3). This holds even if the vaccination coverage is increased only in some of the risk groups. If the vaccination rate increases only among the high-risk men, then more infections will be prevented than if the vaccination rate increases only among the low-risk men (Fig. 3 a). Nevertheless, since the low-risk groups are much larger than the high-risk groups, higher vaccination coverage among the less risky men results in disproportionately many more vaccinations than higher vaccination coverage among the more risky men (Fig. 3 b).
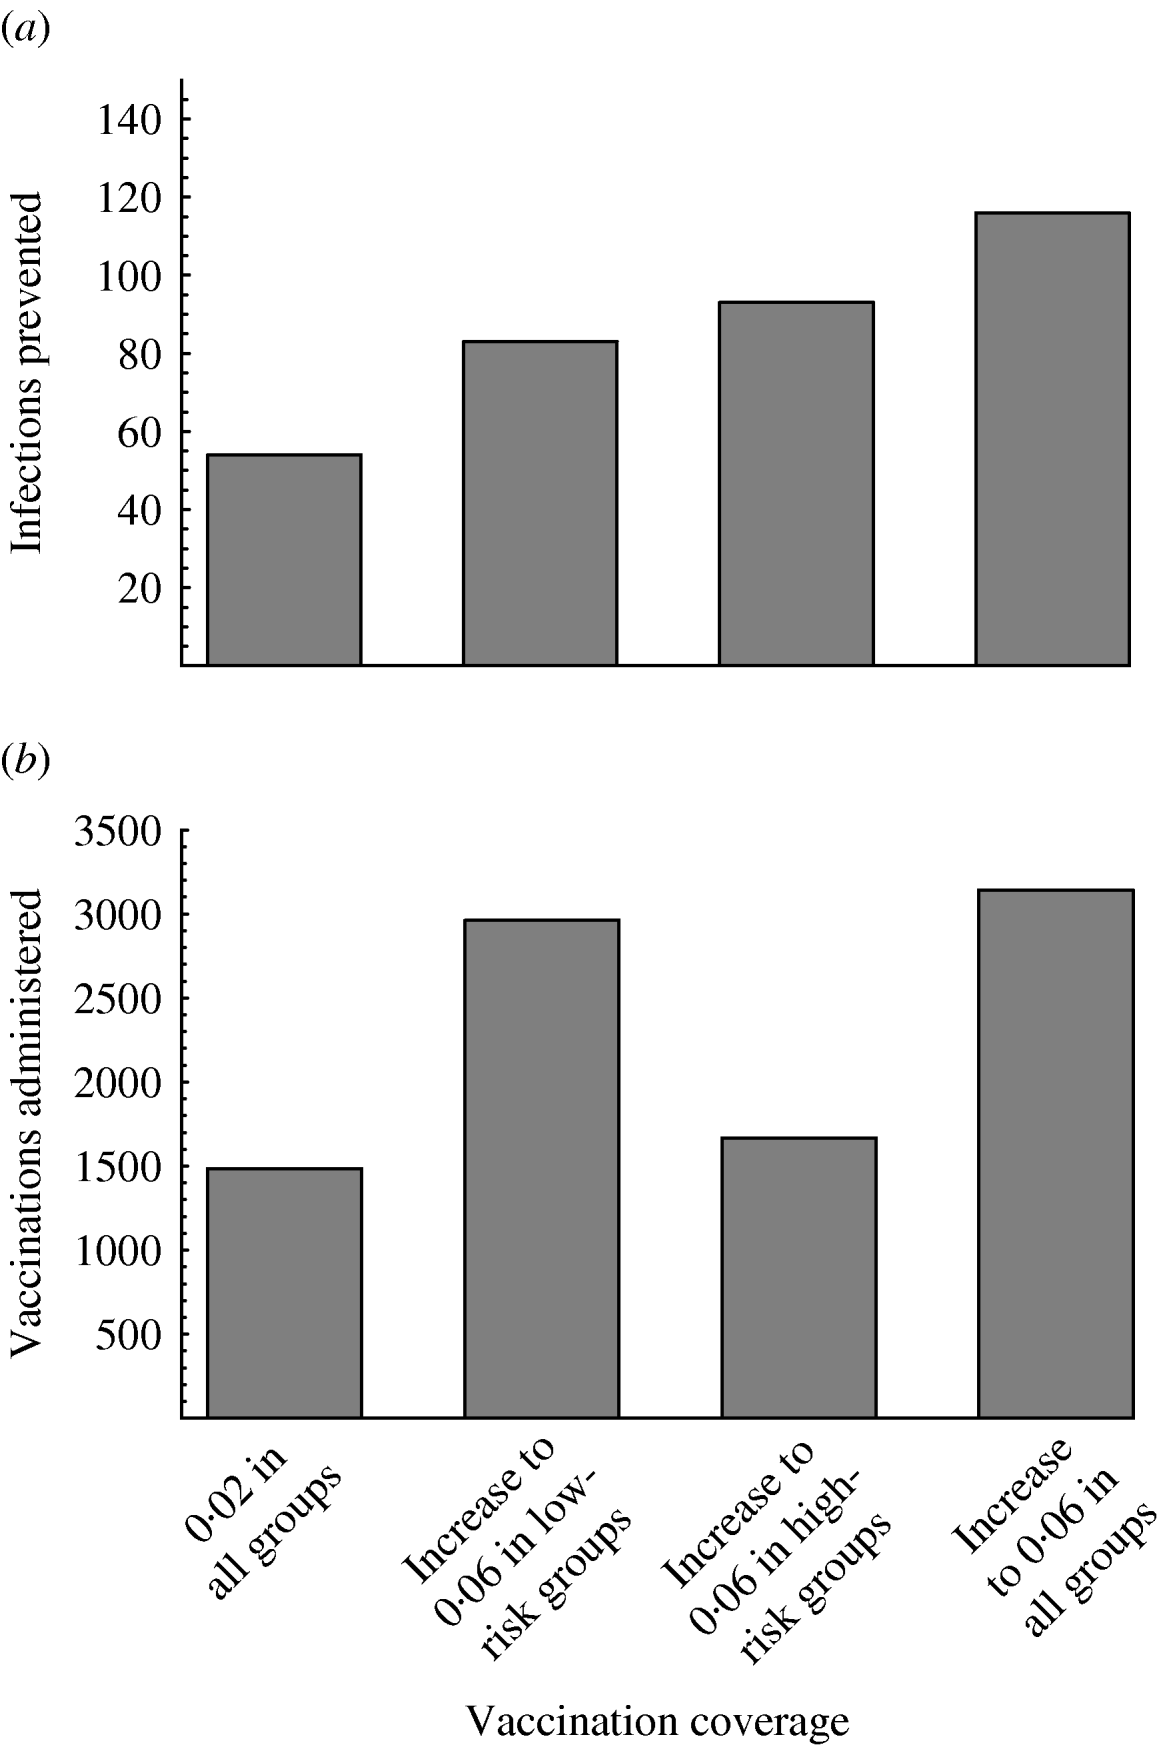
Fig. 3. Effect of increasing vaccination coverage on (a) the median number of infections prevented and (b) the median number of three-dose vaccinations administered in a population of 100 000 men in the tenth year of the vaccination campaign. Four scenarios are shown, where the annual vaccination rate is: 0·02 in all groups; increased to 0·06 in low-risk groups 1–3, but 0·02 in groups 4–6; increased to 0·06 in high-risk groups 4–6, but 0·02 in groups 1–3; increased to 0·06 in all groups. The y axis for plot (a) is the same as for plot (b).
Effect of vaccination and of increases in risk behaviour
In addition to the effect of vaccination, we also investigated the impact of changes in risk behaviour, assuming that these are initiated at the same time (Fig. 4). Four scenarios are evaluated, where sexual behaviour increases equally in all risk groups; increases only among high-risk men; increases only among low-risk men; or does not change. Each scenario was evaluated with low (0·02 per year) and high (0·06 per year) vaccination coverage and for comparison also with no vaccination.
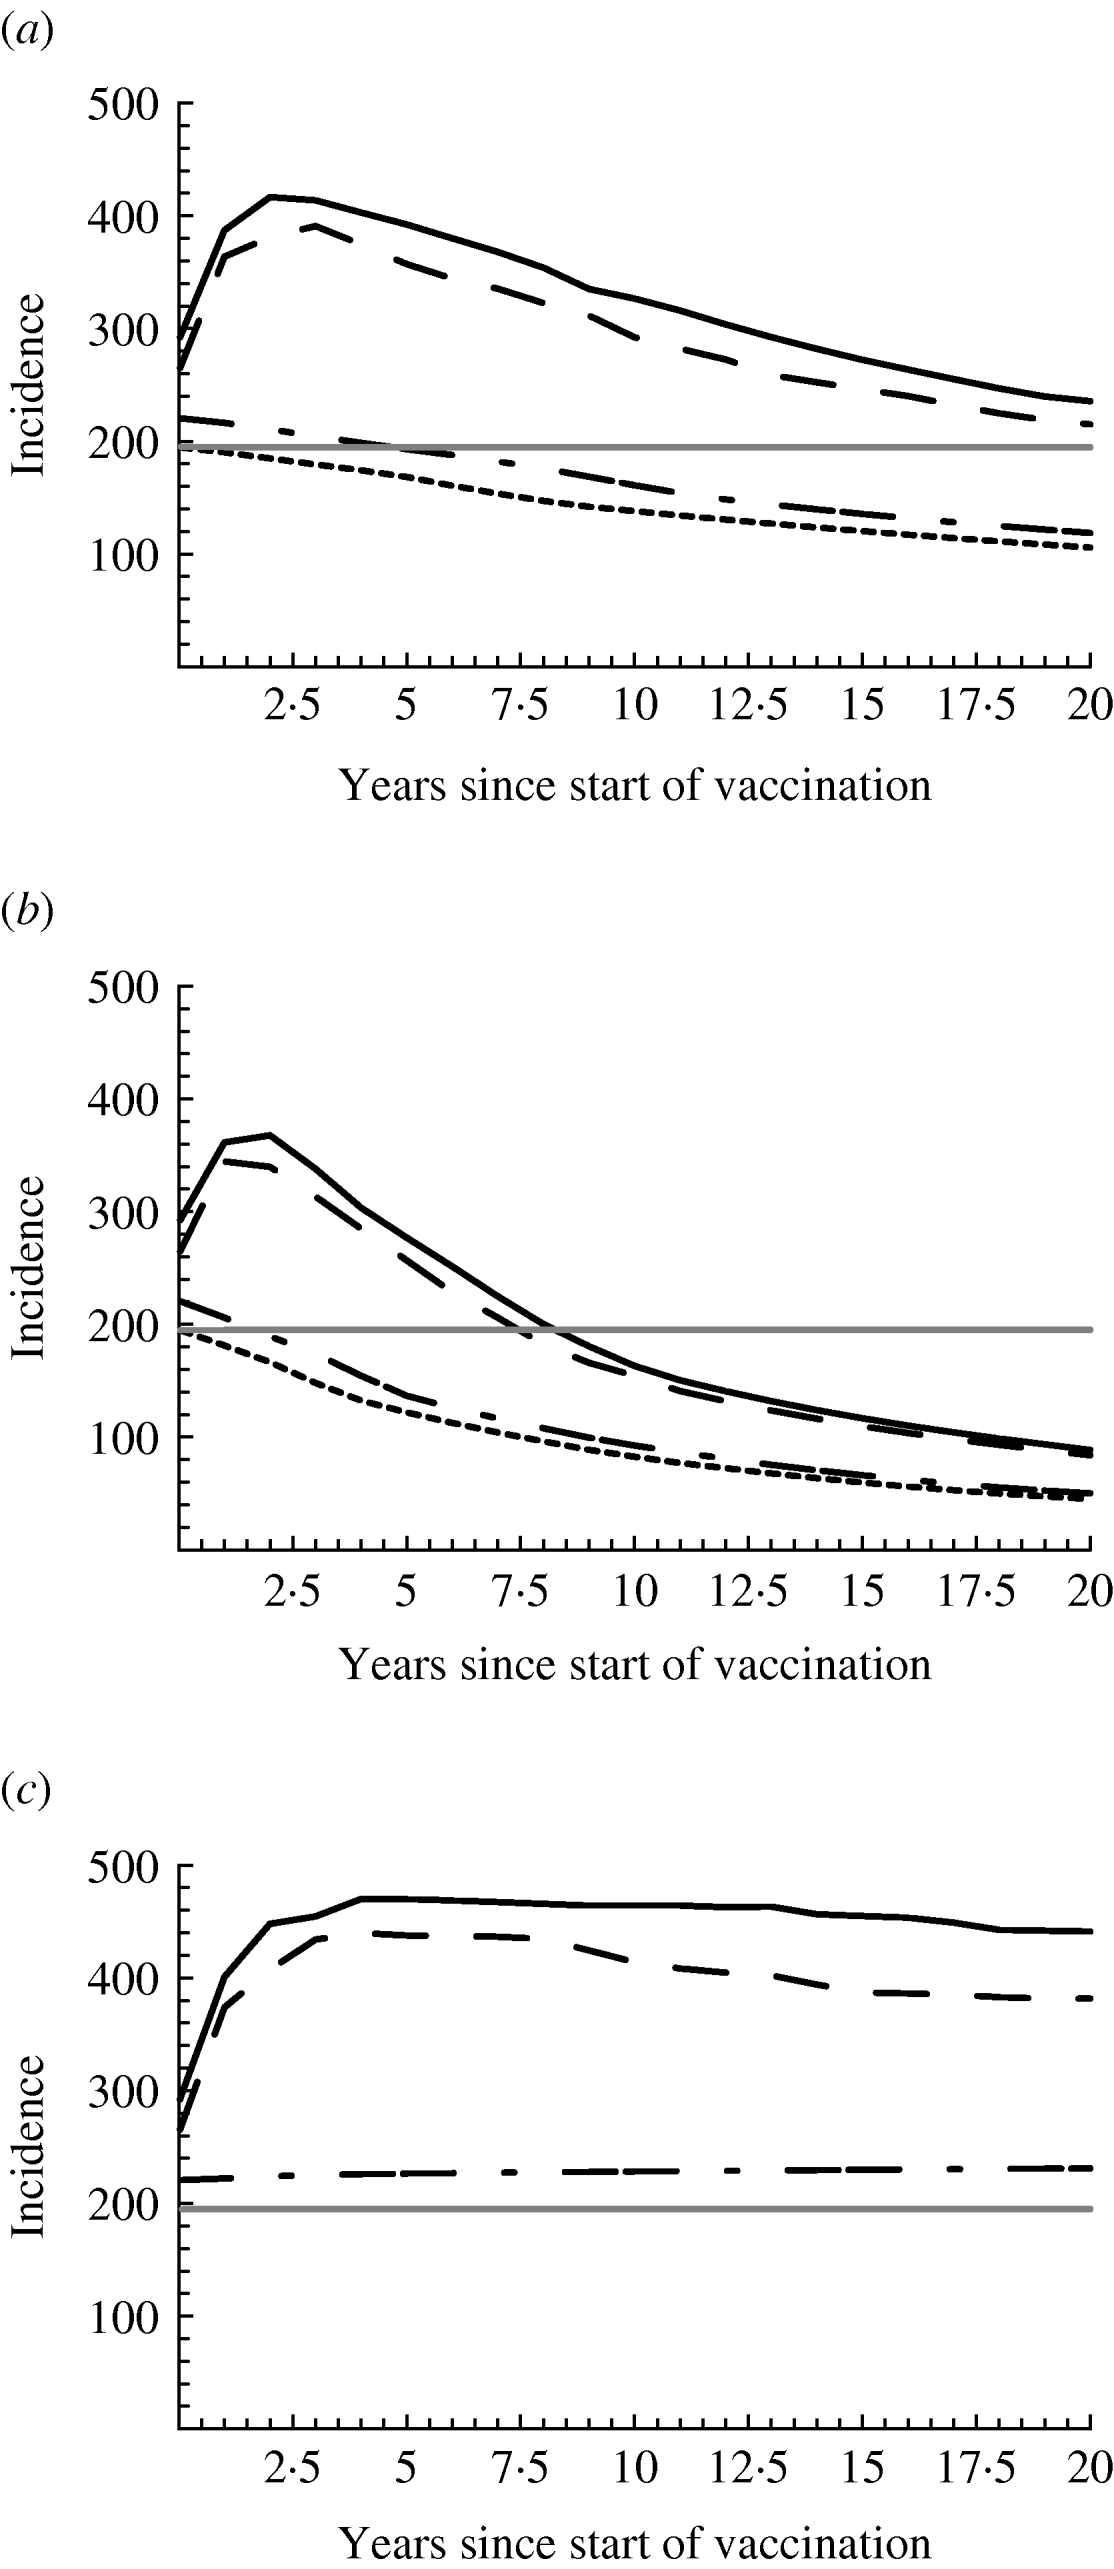
Fig. 4. Effect of vaccination and increased sexual risk behaviour on the incidence of hepatitis B virus. The vaccination rate is (a) 0·02, (b) 0·06, and (c) 0 per year. Risk behaviour increased in all risk groups by 50% (solid line, ——); increased only in high-risk groups 4–6 by 50% (dashed line, — — —); increased only in low-risk groups 1–3 by 50% (dash-dot line,— - —); did not change (dotted line, - - - - -). Moreover, the endemic equilibrium before the initiation of vaccination and the change in risk behaviour is shown (horizontal grey line). Median incidence is shown, calculated as number of new infections/100 000 men per year.
Moderate increases in risk behaviour among the three low-risk groups hardly affect the spread of HBV (dash-dot line in Fig. 4 a). Incidence is slightly higher than that without increases in risk behaviour (dotted line) and in both cases slowly declines, as the fraction vaccinated increases in time. If risk behaviour increases among the high-risk men (solid and dashed lines), incidence rises abruptly in the beginning due to the sudden rise in risk behaviour. However, as the fraction of the population vaccinated increases in time (results not shown), the number of new infections prevented due to vaccination also increases, and offsets the extra number of infections due to the increase in risk behaviour, such that in total incidence starts declining. It remains above the pre-vaccination level (horizontal grey line) for several years or decades and later falls below this level. With higher vaccination rate (Fig. 4 b), the rise in incidence (soon after the increase in risk behaviour) reaches a lower maximum and lasts less long; incidence decreases faster and falls below the pre-vaccination level earlier than with lower vaccination rate.
Figure 4 c shows the situation if vaccination had not been introduced. If sexual behaviour does not change, the incidence remains at its pre-vaccination level, hence the black dotted and grey lines coincide. If risk behaviour increases only among the low-risk groups (dash-dot line), incidence is a little higher than its pre-vaccination level. With increases among the high-risk groups (solid and dashed lines), incidence rises to a maximum of almost twice the pre-vaccination level within 5 years and thereafter remains high. However, even with the highest increase in risk behaviour examined here (solid line), the incidence with vaccination (Fig. 4 a, b) is much lower than what it would have been if vaccination had not been introduced (Fig. 4 c). Despite the rise in incidence, therefore, vaccination has prevented large numbers of infections.
DISCUSSION
The present study shows that risk-group vaccination of MSM is indeed effective: it can result in the reduction and even elimination of the HBV epidemic. The impact of vaccination is limited in the beginning, because with the current low vaccination rate, a longer time is needed until incidence is considerably reduced. In addition, the effect of vaccination increases in time (as the percentage of the population that is vaccinated increases), which means that the benefit of vaccination in the beginning is always smaller than its potential benefit. Moreover, the vaccination campaign will be less successful than expected if mainly low-risk men are vaccinated or if risk behaviour increases. Our findings also stress the importance of high-risk MSM in the spread of HBV. Changes in sexual behaviour and the vaccination rate among those MSM who engage the most in unprotected anal intercourse greatly influences the incidence of HBV.
Our results are in agreement with those from other studies. From 1992 to 1997 there were on average 12 cases of acute hepatitis B in MSM reported per year at the Health Services of Amsterdam [12], which is equivalent to 45 acute cases/100 000 MSM per year. Assuming that symptoms develop in 1 out of 3–5 new infections, it follows that incidence was 135–224/100 000 per year, compared to our estimate of 194/100 000 (IQR 108–276) per year. During the first 6 years of the vaccination campaign, only marginal decreases in HBV incidence were observed [Reference van Houdt3], since only 10% of MSM was vaccinated [Reference van Houdt3] and sexual risk behaviour has increased in the last decade [Reference Dukers4]. Results from another modelling study also indicate that the basic reproduction ratio among MSM in The Netherlands is >1 and that the impact of vaccination will be limited because of the high prevalence of chronic cases in the population [Reference Kretzschmar7].
Certain limitations of the study have to be mentioned. First, we did not account for the age structure of the population, because the natural history of HBV in adults is rather independent of age. Risk-group vaccination of MSM involves only men conscious of their sexual orientation and therefore adults or old adolescents. Hence, stratifying by age is not necessary as in models describing vaccination and spread of HBV among babies and children. Moreover, the mathematical complications and the uncertainty introduced by estimating all model parameters according to age could be avoided. We expect that the qualitative assessment of the effect of vaccination using an age-structured model would be similar. For studies accounting for age structure, see, e.g. [Reference Zhao, Xu and Lu6, Reference Kretzschmar7]. Another consideration is that the sexual behaviour of the cohort participants may not be representative of the behaviour of the Amsterdam MSM population. However, for the specific years of this analysis, the Amsterdam Cohort Study is the most reliable source of behavioural data. In addition, to investigate the effect of a possible bias, we repeated our analysis with higher risk behaviour (in each parameter set, the frequency of partner change was doubled). The results were quantitatively different, but qualitatively similar with respect to the effect of vaccination. Namely, large reductions in incidence were achieved, although the incidence was much higher and the infection remained endemic in more parameter sets than in the results shown here. Finally, it should be mentioned that, as with all modelling studies, the assumptions we made and the parameter estimates we used influenced our outcomes. Their effect on the results is demonstrated via the uncertainty analysis that was carried out.
The findings of this study have important implications for public health policies. Risk-group vaccination of MSM can considerably reduce the HBV epidemic among MSM, therefore it should be continued and if possible intensified. HBV vaccination should be promoted and compliance to the three-dose schedule should be encouraged. Second, since the effect of vaccination decreases as risk behaviour increases, risk-prevention measures cannot be relaxed, but should be continued. However, after the behavioural changes that were observed among MSM in the last decades (decreasing in the 1980s after the HIV outbreak and increasing in the 1990s after the introduction of antiretroviral therapies for HIV), behavioural policies are difficult to implement and long-lasting reductions in HBV cannot be expected only by behavioural changes. Hence, vaccination should be the primary focus of public health activities that aim to contain the HBV epidemic. Finally, high-risk MSM should be specifically targeted, both for vaccination and for risk reduction, because vaccinating and reducing sexual risk behaviour of this subgroup will have an enormous impact on the spread of HBV.
ACKNOWLEDGEMENTS
The authors thank Mirjam Kretzschmar and Maria Prins for bringing the issue to their attention and for valuable comments; Bart Maertzdorf for assistance with the data from the Amsterdam Cohort Study; Robin van Houdt and Sylvia Bruisten for comments on the analysis and interpretation of the results; and the anonymous referees for comments that improved the manuscript.
APPENDIX
Assume that the population is divided into v sexual risk groups. For each group i (i=1, 2, …, v), let S i, L i, A i, C i, Z i, V i denote the numbers of men who are uninfected, latent, acute, chronic, immune, or vaccinated, respectively. The model is described by the following equations, for i=1, …, v
where N i=S i+L i+A i+C i+Z i+V i is the total size of risk group i and

is the force of infection in group i, with ![]() denoting the fraction of partners of men in risk group i with men from risk group j (proportionate mixing). For the definitions of parameters, see Table 1.
denoting the fraction of partners of men in risk group i with men from risk group j (proportionate mixing). For the definitions of parameters, see Table 1.
The system has two equilibrium points, the disease-free equilibrium and an endemic equilibrium. At the disease-free equilibrium, L i*=A i*=C i*=Z i*=0, S i*=λi/(μ+σi), and V i*=S i*σi/μ, for i=1, …, v, where the steady-state values are indicated with an asterisk (*). Solving the model equations at the endemic equilibrium [the steady-state values are indicated with a tilde (~)], it follows that


where ![]() gives the number of new infections among men from group i (see also [Reference Hethcote and Yorke13]). From definition (1) of F i, substituting the values of
gives the number of new infections among men from group i (see also [Reference Hethcote and Yorke13]). From definition (1) of F i, substituting the values of ![]() and
and ![]() from equations (2) and (3), we find that
from equations (2) and (3), we find that

where
With the values of ![]() and
and ![]() from equations (2) and (4),
from equations (2) and (4), ![]() can be written as
can be written as ![]() . Now, define
. Now, define ![]() . Then it follows that W i can be written as
. Then it follows that W i can be written as
The last two equations yield

This is a polynomial of degree v for w. From its positive root w, the W i's can be defined and the endemic equilibrium can be calculated.
The basic reproduction ratio, R 0, is the average number of persons that one typical infectious case infects throughout his infectious period, if this person is introduced into a wholly susceptible population. Using the next-generation matrix and the methodology of Diekmann & Heesterbeek [Reference Diekmann and Heesterbeek14], it can be calculated that R 0 is given by

DECLARATION OF INTEREST
None.


