INTRODUCTION
Middle East respiratory syndrome coronavirus (MERS-CoV) is a respiratory illness caused by a novel coronavirus originally discovered in 2012. MERS-CoV can cause severe acute respiratory symptoms, including fever, cough, and shortness of breath, and is fatal in approximately one-third of reported cases. Presently, there is no vaccine to prevent infection and no specific antiviral treatment for those infected with the virus [1]. MERS-CoV is the sixth strain of human coronavirus identified.
Although MERS-CoV cases were first reported from the Kingdom of Saudi Arabia (KSA) in September 2012, the first two known cases were retrospectively discovered in Jordan from April 2012 [2]. Since its discovery in 2012, MERS-CoV cases have predominately been reported from KSA; however, cases have also been reported from Algeria, Austria, Bahrain, China, Egypt, France, Germany, Greece, Iran, Italy, Jordan, Kuwait, Lebanon, Malaysia, the Netherlands, Oman, Philippines, Qatar, Republic of Korea (ROK), Thailand, Tunisia, Turkey, United Arab Emirates (UAE), United Kingdom (UK), United States (USA), and Yemen [2]. According to the Armed Forces Health Surveillance Branch (AFHSB), which is an organization under the Defense Health Agency that utilizes biosurveillance to protect and promote the health of the US Armed Forces, as of 1 June 2016, 1806 cases of MERS-CoV have been reported, including at least 564 deaths [3]. AFHSB's death count (case fatality proportion – 31%) includes only those deaths which have been publicly reported and verified.
The dynamics of the transmission of MERS-CoV is essential to understanding the risk posed by the virus as well as instituting effective infection control and prevention practices in areas where humans are at a greater risk of exposure. Despite beliefs that camels are the most likely reservoir of the virus, the limited camel-to-human transmission has been reported by CDC and WHO [4, Reference Mohd, Al-Tawfiq and Memish5]. Many published findings suggest that camel calves play a potential role in MERS-CoV transmission [Reference Reusken, Haagmans and Koopmans6–Reference Park8]. They found the ‘rate of virus isolation [was] significantly higher in calves’, and calves are often more acutely infected with MERS-CoV than adult camels, suggesting increased infectivity among calves [Reference Reusken, Haagmans and Koopmans6–Reference Park8]. Although camel breeding season has been a proposed contributor to MERS-CoV transmission among camels, there is insufficient literature to support that human infections are more common during this time of year.
Human-to-human transmission of MERS-CoV has been investigated as a potentially significant route of spread. Researchers have found that close contact with infected individuals is required to transmit the virus from one human to another, supporting the role of limited human-to-human transmission in the MERS-CoV epidemic and, more specifically, its role in nosocomial and household clusters [9]. While it is known that the virus can be transmitted through respiratory secretions, the exact routes through which the virus spreads are not well understood [9]. In an effort to better understand the patterns of transmission, a retrospective analysis of epidemiological clusters identified throughout the ongoing MERS-CoV epidemic was conducted using open-source data.
METHODS
Cluster analysis
Literature review
Epidemiological literature, classified by the Tiered-Source Classification System (TSCS), addressing MERS-CoV cluster analyses was collected and reviewed. Several key search terms were utilized to capture all cluster-related literature, including ‘MERS-CoV’, ‘nosocomial’, ‘cluster’, ‘transmission’, ‘superspreader’, ‘contact tracing’, and ‘healthcare worker’. See Supplemental 1 for a comprehensive list of key search terms.
Tiered Source Classification System
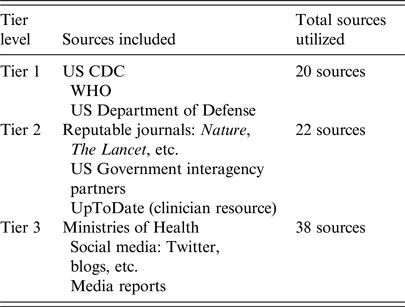
Publications selected for inclusion in the literature review were classified using tiers. This system was developed by AFHSB to categorize the sources used in the literature review by their credibility. Literature published by official sources, including the WHO and CDC, was considered a Tier 1 source. Literature published by reputable sources other than the WHO and CDC (e.g. all peer-reviewed journals regardless of perceived impact factor, including The Lancet or Nature) was considered a Tier 2 source. Literature from a foreign source, such as the KSA Ministry of Health (MOH) or a media source, was classified as a Tier 3 source.
Inclusion/exclusion criteria
Inclusion of a source required two or more of the key terms in Supplemental 1. The literature included in the analysis encompassed translatable studies, situation reports from public health agencies, and publications updated to include more recent cluster information. Studies related to MERS-CoV that were identified as having one or more of the following characteristics were excluded from the analysis: an investigational period prior to 2012; published in a non-translatable language; molecular-based; a focus on viral reservoirs, genealogy, or genetics, preventive measures, or other coronaviruses. In total, 80 studies were selected for inclusion. Of these, 20 were classified as Tier 1 sources, 22 as Tier 2, and 38 as Tier 3 (Table 1). These sources were used to identify clusters as well as verify and characterize associations between cases.
Table 1. Tiered Source Classification System created by the Integrated Biosurveillance Section at the Armed Forces Health Surveillance Branch

Cluster definition
A MERS-CoV cluster was defined as two or more persons with onset of symptoms within a 14-day incubation period who are associated with a specific setting [10]. Clusters were further categorized as exported, nosocomial, and/or household clusters. An exported cluster was defined as any cluster that resulted from verified travel of an index case (from an area of known MERS-CoV transmission) within one incubation period (14 days) of symptom onset. If the index case was asymptomatic, verified travel from an area of known MERS-CoV transmission within 14 days prior to the date of the index case was laboratory confirmed for MERS-CoV. A nosocomial cluster was defined as a cluster associated with a healthcare or hospital setting. A household cluster was defined as a cluster associated with the same family and/or physical household.
Cluster identification and verification
Case identification and data collection were performed on an ongoing basis by epidemiologists at AFHSB beginning with the emergence of the MERS-CoV outbreak in 2012. Case demographics, including city and country of origin, age, gender, date of symptom onset (if any), asymptomatic status, mortality, comorbidities, healthcare worker (HCW) status, and date reported, were collected on a daily basis. Each case was verified using Tiers 1 and 2 sources. If a Tier 1 or 2 source failed to verify a case reported by a Tier 3 source, it was not included in the AFHSB case line list. If an epidemiological link between cases was identified through a Tier 3 source, Tiers 1 and 2 sources were used to verify the link. If a Tier 1 or 2 source was not available, supporting data from at least three separate Tier 3 sources were used as verification.
Data availability
Due to the lack of data available at the local level in the Arabian Peninsula, in the event that multiple ongoing nosocomial outbreaks were known to have been occurring in one area, all cases reported to have been associated with that area and possibly epidemiologically linked to one of the ongoing clusters were categorized under one cluster (e.g. Riyadh, Jeddah). For all exported MERS-CoV clusters, the city and country of origin were determined by the reported travel history of the index case. If travel history was only available in the country level, the capital city of the country of travel was used as the point of origin for the index case. For two identified clusters, the index case had to travel to multiple countries with a history of confirmed autochthonous MERS-CoV transmission. As a result, the country of most probable exposure, determined by the duration of stay in the country as well as active transmission reported in that country at the time of travel, was used as the point of origin.
Cluster ‘start’ and ‘end’ dates
In order to visually display the overlap of clusters on the epidemiological curve, the start and end dates of each identified cluster were defined. The start date of each cluster was the date of symptom onset of the index case. In the absence of symptom-onset data, the ‘report date’, or the date a case was publically reported, was used instead. The end date of each cluster was determined by adding 14 days to the date of symptom onset or date of death of the last case identified in the cluster. The 14-day period is representative of the maximum incubation period of a MERS-CoV case, ensuring no additional cases could have been associated with a given cluster [10]. For asymptomatic cases, date of diagnosis was used in place of date of symptom onset. If the date of diagnosis was not publically available, date reported was used.
RESULTS
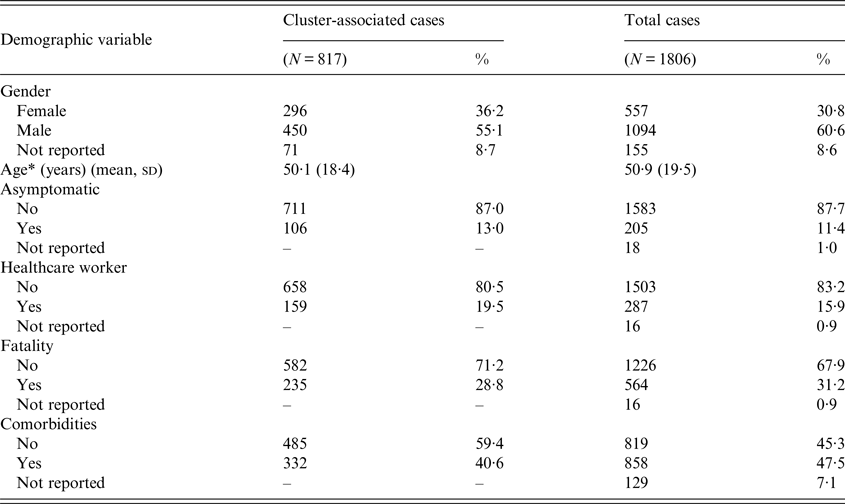
Of the 1806 cases of MERS-CoV identified between April 2012 and June 2016, 817 (45·2%) cases were determined to have been associated with at least one of the 51 clusters identified in this analysis [2, 11]. A small portion of cases associated with one or more clusters were HCWs (n = 159), and 106 cluster-associated cases were asymptomatic (Table 2). Age and comorbidities were unavailable for 129 cases that were retrospectively reported by the KSA MOH in two large releases of data (113 cases released on 3 June 2014 and 16 cases released on 19 September 2014). Of the 113 cases reported on 3 June 2014, KSA MOH detailed that 54 infections were acquired from another MERS-CoV case, including 41 nosocomial infections and 13 household infections. As the KSA MOH did not specify which MERS-CoV case these were acquired from, it is unclear if any of these batched cases were associated with the 51 identified MERS-CoV clusters or were part of separate clusters.
Table 2. Demographic characteristics of MERS-CoV cases diagnosed between June 2012 and June 2016

* Age was not reported for 129 cases; these cases were not included in the mean calculation for total cases.
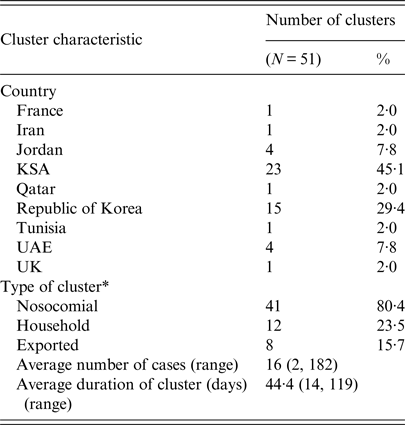
Of the 51 identified clusters, 41 (80·4%) were classified as nosocomial clusters; 12 (23·5%) were household clusters; and eight (15·7%) were exported (Table 3). Ten clusters were classified as more than one type of cluster, including four exported nosocomial clusters, three exported household clusters, and three clusters with both nosocomial and household characteristics. Three clusters displayed both nosocomial and household transmission characteristics, four clusters were classified as both exported and nosocomial, and three clusters were classified as both exported and household. The two countries reporting the greatest number of nosocomial clusters were KSA and ROK, with 18 and 15 nosocomial clusters, respectively. Of the eight exported clusters, two (ROK1, TUNISIA1) had index cases with travel to multiple countries with a history of confirmed autochthonous MERS-CoV transmission (see Table 4, Technical Appendix).
Table 3. Characteristics of the clusters identified during the MERS-CoV epidemic between June 2012 and June 2016

* Ten clusters were categorized as more than one type.
Table 4. Identified MERS-CoV clusters with start and end dates and number of cases affected

* Exported cluster; travel history of the index case: Kingdom of Saudi Arabia (IRAN1, JORDAN2, QATAR1); Kuwait (JORDAN4); United Arab Emirates (FRANCE1); Kingdom of Saudi Arabia and Qatar (TUNISIA1); Kingdom of Saudi Arabia and Pakistan (UK1); Bahrain, Kingdom of Saudi Arabia, Qatar, and United Arab Emirates (ROK1).
The average duration of each cluster was 44·4 days, with a range of 14–119 days. Cluster size ranged from two cases to 182 cases, with an average of 16 individuals affected. Over 90% of the cluster-associated cases were acquired in KSA (N = 558, 68·3%) and ROK (N = 186, 22·8%), supporting the notion that nosocomial transmission, which accounted for 100% of the clusters identified in ROK and 78% of the clusters identified in KSA, was a prominent driver of clusters in this epidemic.
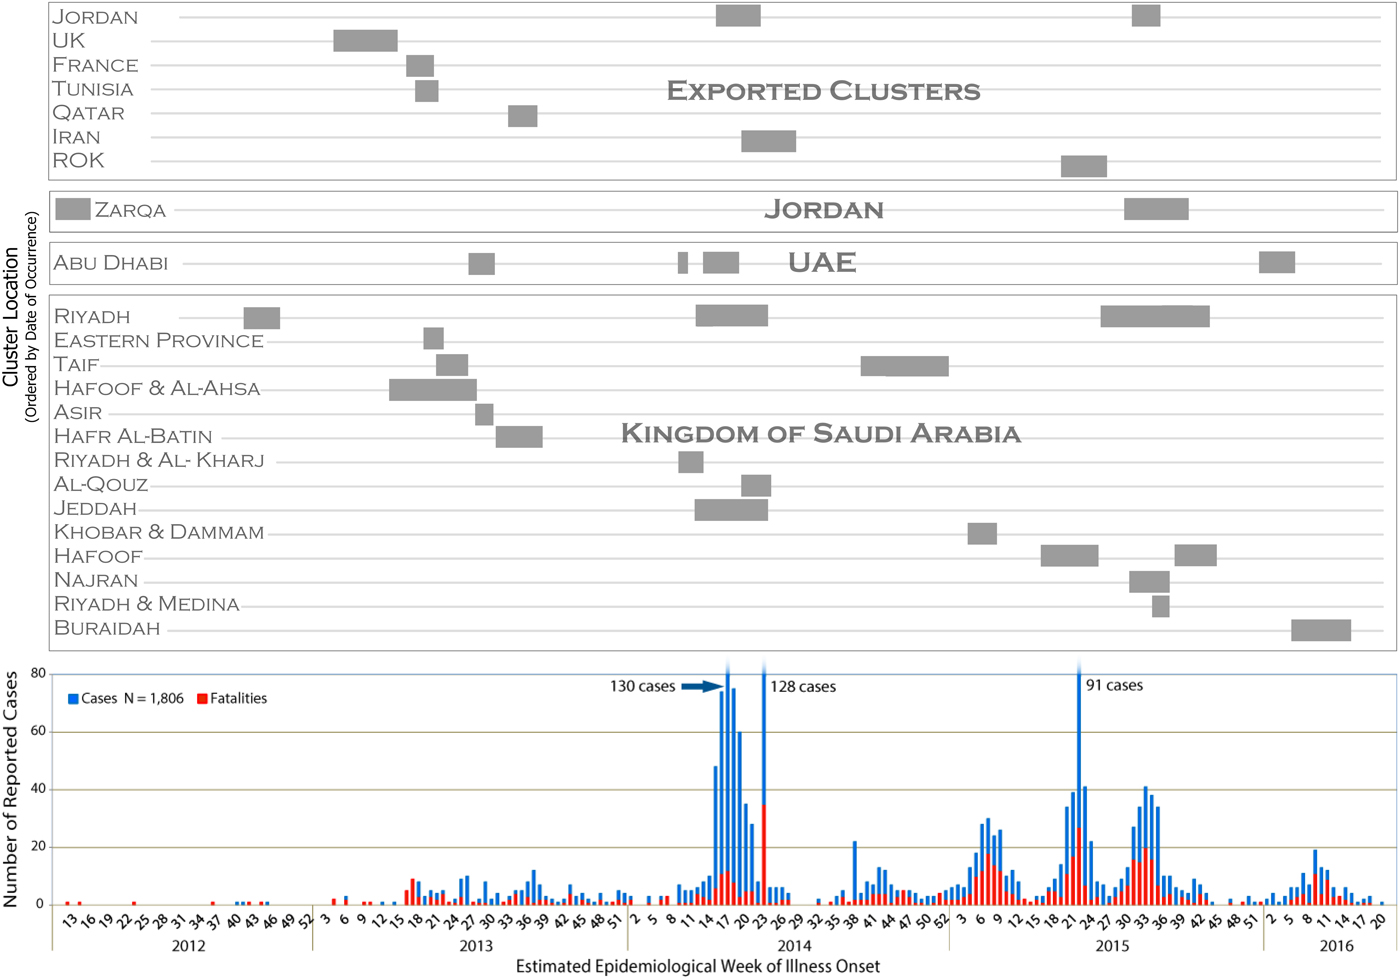
Figure 1 depicts the epidemiological curve of the MERS-CoV outbreak using the estimated epidemiological week of illness onset for each case. Symptom-onset date was available for 1267 cases (70·2%), including 623 (72·6%) of the cluster-associated cases. For asymptomatic cluster-associated cases, date reported was used for 98 of the cases, and date of diagnosis was used for eight cases. The cluster bands seen above the epidemiological curve in Figure 1 illustrate the duration of transmission within each cluster and the corresponding overlap of identified clusters with peak MERS-CoV incidence over the epidemic period of this study. Most temporal peaks correspond with at least two ongoing clusters (see Fig. 1). The time periods of greatest incidence (>35 incident cases at the period's peak) in 2014 and 2015 correspond with at least four ongoing MERS-CoV clusters, of which at least two were classified nosocomial in each of these periods. See Table 4 (Technical Appendix) for individual cluster data, such as cluster duration and a number of cases affected.

Fig 1. Temporal display of identified MERS-CoV clusters with the MERS-CoV epidemiological curve to illustrate the duration of transmission within a cluster and corresponding peaks in transmission.
DISCUSSION
The 51 clusters identified in this analysis spanned the duration of the epidemiological curve, demonstrating the consistency of cluster-driven transmission throughout the epidemic. Clusters also corresponded with each period of increased MERS-CoV incidence and accounted for over 45% of the total confirmed cases reported, supporting the notion that human-to-human transmission is a prominent driver of the MERS-CoV epidemic. The alignment of nosocomial clusters with the time periods of greatest incidence (>35 incident cases at the period's peak) suggests nosocomial transmission is a key driver of transmission in the MERS-CoV epidemic as opposed to seasonal events, such as the Hajj or camel-breeding season that occur in the fall and spring, respectively. The absence of apparent seasonality in the identified clusters further supports the significant role human-to-human transmission in healthcare settings plays in the propagation of MERS-CoV.
Classification of each cluster into one or more of the three disease transmission categories (nosocomial, household, or exported) elucidated common characteristics among the clusters, including the overall concentration of case clusters in cities and healthcare institutions. With nosocomial transmission accounting for 41 of the identified clusters (80·4%), the role of healthcare facilities, transportation protocols during inter- and intra-hospital transfers, and the contribution of cultural norms such as ‘doctor shopping’ became apparent themes observed throughout this analysis.
In ROK, practices such as seeking healthcare at multiple facilities, or ‘doctor shopping’, and being cared for by relatives while hospitalized are believed to have contributed to the emergence of the largest outbreak outside of KSA during the MERS-CoV epidemic [12, 13]. Additionally, four superspreaders, defined as a confirmed MERS-CoV case responsible for infecting 10 or more secondary cases, played a critical role in the perpetuation of transmission in ROK. The MERS-CoV outbreak in ROK included 15 clusters at separate healthcare institutions, each with an index case related to an ongoing MERS-CoV cluster at another facility. Between May 2015 and July 2015, 186 laboratory-confirmed MERS-CoV cases were reported. The geographic distribution and rapid pace at which MERS-CoV spread in ROK demonstrates the susceptibility of healthcare environments to human-to-human transmission of the virus and their catalytic role in MERS-CoV transmission.
In KSA, clusters were primarily concentrated in cities, specifically active transmission at healthcare facilities within those cities, as illustrated by the largest identified clusters in the country (KSA8, KSA9, KSA17, KSA20, and KSA23; see Table 4, Technical Appendix). The most common theme in the perpetuation of transmission among nosocomial clusters was the role of more transient departments in the healthcare setting, such as dialysis units and emergency departments, which were implicated in a majority of the nosocomial clusters identified in this analysis. At least seven of the 23 clusters identified in KSA occurred in designated MERS-CoV treatment centers, which were presumably best equipped to handle these infectious cases. However, the nosocomial transmission that persisted in these clusters suggests inconsistent infection control practices across different departments of those designated hospitals [14]. HCWs likely contributed to the continued transmission among patients and between wards within a hospital, as HCWs represent 159 (19·5%) of the cluster-associated cases. Of the 41 clusters classified as nosocomial, 30 clusters (73·2%) involved HCWs.
The use of Tier 1 data collected as the MERS-CoV outbreak progressed is one of the greatest strengths of this comprehensive cluster analysis. Collection of the data and emerging literature in real time allowed for an inclusive literature review from which cluster identification and evaluation of key components of the outbreak could be analyzed. The availability of open-source data and information provided the opportunity to precisely map each confirmed case temporally and geographically. Utilization of the date of symptom onset for the epidemiological curve created an accurate representation of the progression of the epidemic and corresponding cluster durations (Fig. 1).
The availability of open-source data from certain regions also served as a limitation in this analysis. Due to limited demographic information, it was occasionally necessary to broaden the case criteria for a particular cluster, specifically clusters KSA8, KSA9, and KSA20 (see Table 4, Technical Appendix). If a case was reported from the city during the estimated time in which there was ongoing nosocomial transmission, had no travel or camel exposure in the 14 days prior to illness onset, and had no known household contact with a confirmed MERS-CoV case, the case was included in the case count for that particular nosocomial cluster. Although the particular epidemiological details regarding the exact location of exposure were generally not provided for cases during the three aforementioned clusters, Tier 1 sources often denoted if a case was under investigation for a possible link to a hospital with the known ongoing transmission of MERS-CoV, which reinforced the inclusion of these cases in their respective clusters.
In addition to limitations on precise case inclusion in the larger clusters denoted above, availability of date of symptom onset may have created an artifact in the cluster date and duration, potentially altering its appearance on temporal scales. Of the known symptomatic cases, illness onset data were missing for 334 cases, including 96 cluster-associated cases, and date reported was used as an approximation. On average, AFHSB observed an 8–9-day lag from the date of symptom onset to the date a case was reported. Considering our analysis aggregated these cases by estimated epidemiological week of illness onset, the impact of this possible artifact is likely to be relatively insignificant to the overall trends observed in this analysis. Additionally, KSA retrospectively released information on 113 confirmed MERS-CoV cases on 3 June 2014 and on 16 cases on 19 September 2014 with minimal geographic and demographic data. All cases released on 3 June 2014 occurred between 5 May 2013 and 6 May 2014, with a majority of the cases (N = 84) occurring after 1 March 2014. The rest of the cases (N = 29) occurred between 5 May 2013 and 28 February 2014. As no other date was available, the date reported was used to represent the cases released in these two batches on the epidemiological curve.
Asymptomatic cases accounted for 11·4% (N = 205) of the total cases in this study population. Over 50% (N = 106) of these asymptomatic cases were related to a cluster. This finding may support WHO's assessment that contact tracing efforts intensified as the epidemic progressed and are responsible for the detection of asymptomatic cases [15, 16]. A study performed by CDC analyzing case data between September 2012 and January 2016 found that there was likely an under-representation of asymptomatic cases reported from the countries of the Arabian Peninsula. Estimations suggest that the total number of MERS-CoV cases from the region may be 2·3 times greater than the total number of cases recorded to date [Reference O'Hagan17]. Inconsistencies in reporting of asymptomatic cases from entities such as the KSA MOH may have contributed to an under-representation of not only the total number of MERS-CoV cases in the outbreak but also the number of clusters, as well as the breadth and duration of the identified MERS-CoV clusters.
SUPPLEMENTARY MATERIAL
The supplementary material for this article can be found at https://doi.org/10.1017/S0950268817002345.
ACKNOWLEDGEMENTS
The authors acknowledge the support provided by AFHSB's US Government partners, including the Centers for Disease Control and Prevention and the United States Forces Korea. This study received no specific grant from any funding agency, commercial, or not-for-profit sectors.
DECLARATION OF INTEREST
None.


