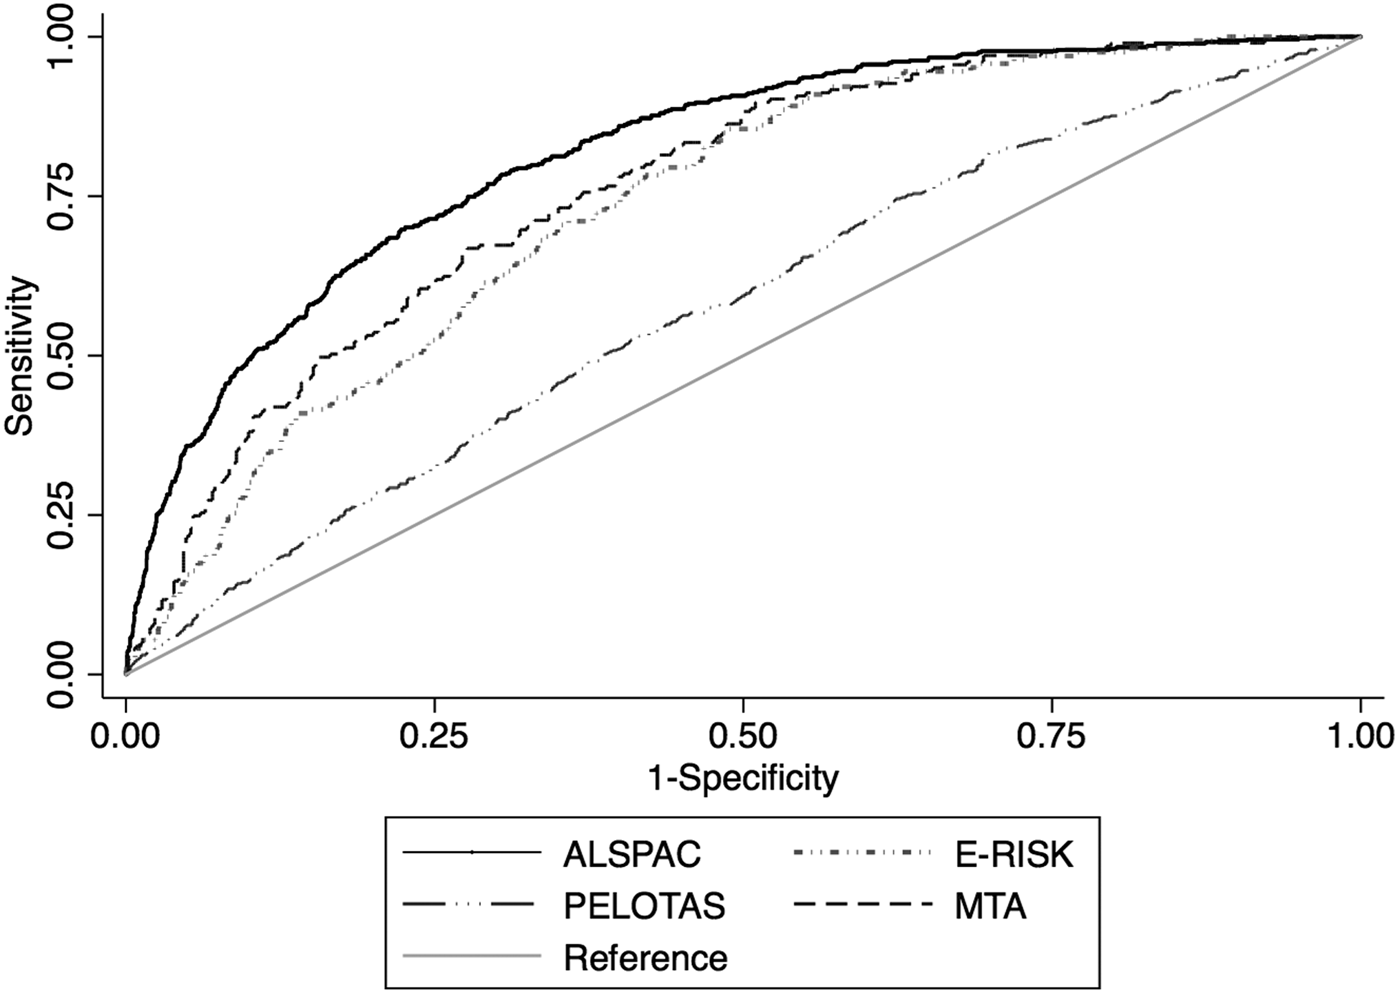
In the aforementioned article, the figures have been incorrectly inverted. The correct figures and their corresponding captions are as follows:

Fig. 1. Receiver operating characteristic curves in each each cohort plotting Sensitivity and 1-Specificity for the predicted probabilities generated by the risk calculator against adult ADHD as the classificatory variable.

Fig. 2. Calibration curves in each cohort plotting the predicted probabilities generated by the risk calculator (x-axis) against observed adult ADHD frequency (y-axis). Dashed diagonal line represents perfect calibration.
The publisher regrets this error.


