


1. Introduction
Organic production standards place meaningful limitations on practices common among conventional producers for limiting pest and disease outbreaks in crops. At the same time, organic producers have developed alternative methods that could, in some circumstances, outperform conventional approaches. Either way, there is reason to expect heterogeneous outcomes for a crop in a given production region between organic and conventional production methods. Notably, there are direct and indirect pathways through which organic and conventional markets affect each other that are important to represent in models to capture outcomes accurately. For example, certified organic can be sold as conventional if the organic market cannot absorb all supply. Consumers substitute between organic and conventional depending on relative prices. Also, producers decide how to allocate their land between organic and conventional depending, in part, on expectations about the relative risks from pest and disease outbreaks.
There are many factors increasing pest and disease pressure in cropping systems. Pesticide resistance is one example. Another, and likely the most significant risk, is climate change, which scientists forecast will increase the population size, survival rate, and geographical distribution of pests, along with an increase in diseases’ intensity, development, and geographical distribution (Doody, Reference Doody2020). In general, the rise in temperature and rainfall leads to a warm and humid environment that fuels the growth and distribution of most pest species. The temperature changes affect the insects’ physiology and spatial distribution, especially in temperate regions below the optimum temperature. As these regions warm, pests are expected to grow more quickly (Harrington, Fleming, and Woiwod, Reference Harrington, Fleming and Woiwod2001; Yamamura et al., Reference Yamamura, Yokozawa, Nishimori, Ueda and Yokosuka2006). Many species have already responded to the increased warming over the last century (Crozier and Dwyer, Reference Crozier and Dwyer2006). In most cases, the increased frequency of climate extremes promotes pest outbreaks (Gan, Reference Gan2004). The negative impacts of climate change on agriculture consist of altered rates of pressure from pests, diseases, and weeds, which may affect the productivity of crops and livestock (Walthall et al., Reference Walthall, Hatfield, Backlund, Lengnick, Marshall, Walsh and Adkins2012).
The U.S. is the world’s second-largest producer of apples after China. The crop is economically important to several communities in the U.S., with a sales value of $3.03 billion in 2021 (U.S. Department of Agriculture, 2022). The initial investment in planting an apple orchard and the annual operating costs are higher than yearly row crops (Basu and Gallardo, Reference Basu and Gallardo2021). This makes the economic sustainability of apple operations particularly vulnerable to external shocks such as pest and disease outbreaks due to the potential of significant capital loss. For example, in 2000, the fireblight (Erwinia amylovora) outbreak in Michigan State resulted in the removal of about 400,000 apple trees, costing 42 million dollars (Longstroth, Reference Longstroth2001). The rising threat of pest and disease outbreaks accompanying increased temperature and humidity imposes potentially high costs on apple producers and other economic agents. These outbreaks’ impacts differ between operations following organic or conventional production methods.
U.S. farmers employ various pest management strategies to reduce crop losses. Despite improved pest control management strategies, including more targeted applications and improved chemical materials, pest and disease outbreaks still need to be addressed, particularly for organic growers prohibited from applying synthetic pesticides. Organic production methods’ pest and disease management practices are more expensive and labor-intensive than conventional methods (Galinato, Gallardo, and Hong, Reference Galinato, Gallardo and Hong2016). Galinato, Gallardo, and Hong (Reference Galinato, Gallardo and Hong2016) reported that as of 2014, the costs of chemicals and fertilizer for organic production methods for Gala apples were about 25% higher than conventional ones. Therefore, an outbreak of pests or disease will likely impose much higher costs on organic growers through pest control programs.
In addition to the different aspects of organic and conventional production methods, consumers also prefer organic and conventional fruits. Increased consumer demand for healthier fruit and more environmentally sustainable farming has driven the development of pest management systems that use organic and integrated pest management programs (Peck et al., Reference Peck, Andrews, Richter and Reganold2005). Accordingly, consumers who buy organic food tend to be more concerned about human health and food safety due to the perceived lower prevalence of chemicals and environmental stewardship (Davies, Titterington, and Cochrane, Reference Davies, Titterington and Cochrane1995; Demeritt, Reference Demeritt2002; Ekelund, Reference Ekelund1990; Goldman and Clancy, Reference Goldman and Clancy1991; Grunert and Juhl, Reference Grunert and Juhl1995; Jolly et al., Reference Jolly, Schutz, Diaz-Knauf and Johal1989). While the U.S. acreage of apples has declined and the total production under both conventional and organic production methods has stayed at a similar level in recent years (USDA-NASS 1980–2019), consumer demand has spurred a fast-growing organic apple sector. The value of certified organic apple sales accounts for 17.3% of total apple sales in 2019, up from 6.2% in 2008 (USDA-NASS 2008, 2019). This may be partly because of increased consumer awareness of pesticide safety issues and higher preferences for organic and pesticide-free products (Grunert, Reference Grunert2005; Simon et al., Reference Simon, Brun, Guinaudeau and Sauphanor2011). Due to concerns about food and pesticide safety, consumers might be more inclined to purchase organic fruits, given potential increases in the use of synthetic pesticides due to more prevalent pest or disease outbreaks.
This study aims to assess the economic consequences of pest and disease outbreaks in the U.S. apple industry and to consider the interactions between organic and conventional production methods. We use an equilibrium displacement model (EDM), disaggregated by organic vs. conventional, to measure the impacts of climate-triggered shocks. The analysis is complemented by applying simulations to understand better the relationships between organic and conventional sectors on the supply and demand sides.
This study is organized as follows: section 2 explores a comprehensive literature review on pest- and disease-related studies; section 3 describes the dynamic model of the U.S. apple industry, considers organic and conventional production methods, and presents the EDM for empirical analysis; section 4 describes the data and scenarios used in the simulation; in section 5, the results of the simulations are presented; and finally, section 6 includes the conclusions and policy implications.
2. Literature Review
Agriculture is vulnerable to climate change, as it influences crop production directly and indirectly. The direct negative influence on yield is associated with environmental factors such as drought, heavy rainfall, and solar intensity. For example, a rise in temperature increases atmospheric water demand, reducing soil moisture and eventually decreasing yield (Zhao et al., Reference Zhao, Liu, Piao, Wang, Lobell, Huang, Huang and Asseng2017). Indirect effects of higher temperatures include the increased fecundity of pests, weeds, and plant diseases (Field et al., Reference Field, Barros, Mastrandrea, Mach, Abdrabo, Adger and Yohe2014). Temperature is the most important environmental factor affecting insect behavior, distribution, development, and reproduction. Therefore, climate change could significantly affect the population dynamics of insect pests and, thus, crop losses (Fand, Kamble, and Kumar, Reference Fand, Kamble and Kumar2012; Kocmánková et al., 2010). Also, warmer winter conditions could increase overwintering populations and early infestation, resulting in crop damage from insect pests (Diffenbaugh et al., Reference Diffenbaugh, Krupke, White and Alexander2008; Fand, Kamble, and Kumar, Reference Fand, Kamble and Kumar2012; Kocmánková et al., Reference Kocmankova, Trnka, Eitzinger, Dubrovský, Štěpánek, Semeradova and Žalud2011; Yamamura and Yokozawa, Reference Yamamura and Yokozawa2002).
Several studies have analyzed the economic impact of pest and disease outbreaks, but only a few have focused on perennial crops. Because perennial crops, such as apples, take up to 5–6 years to come into total production and require considerable investment and horticultural management-related costs, external shocks, such as the outbreak of pest or disease, may impose a more significant burden on the tree fruit industry than annual crops. This is particularly true for organic perennial crop producers compared to conventional. This is why developing a model tailored to organic perennial crop production that captures interactions with conventional markets is a significant contribution.
Zhao, Wahl, and Marsh (Reference Zhao, Wahl and Marsh2007) estimated welfare change for different levels of apple maggot (Rhagoletis pomonella) spread and found that spread speed is a significant factor. Galinato et al. (Reference Galinato, Gallardo, Granatstein and Willett2018) and Hong et al. (Reference Hong, Gallardo, Fan, Atallah and Gómez2019) estimated the costs of potential expansions of the apple maggot quarantine areas to the Washington State economy, emphasizing the loss of growers’ profits due to the spread of apple maggot in nonquarantine areas. Chambers, Karagiannis, and V. Tzouvelekas (2010) considered scenarios involving Greek olive producers and measured economic losses due to pest increases by incorporating supply-response adjustments, leading to higher economic losses than models with adjustments. Jiang, Cassey, and Marsh (Reference Jiang, Cassey and Marsh2017) used a dynamic national-level model of the pear industry that included tree fruit packing and processing intermediaries to measure the economic impacts of disease outbreaks and trade shocks for heterogeneous agents along the vertical tree fruit supply chain.
While previous studies analyzed the economic effects of pests and diseases on fruit production, such analyses have not considered heterogeneous agents – where heterogeneity refers to differences in production technologies – in their industries simultaneously responding to shocks. This study will employ a U.S. apple industry model to estimate the impacts of shocks on conventional and organic markets. We build from the dynamic model of the U.S. apple industry described by Tozer and Marsh (Reference Tozer and Marsh2018), who found heterogeneous impacts of pest or disease outbreaks resulting from different industry structures and regional allocation of apples. They employed a whole-apple industry model and did not consider the potential for various pest and disease shock responses between organic and conventional production methods. Also, even if they disaggregated the model by regions, due to the complexity of the model, they did not consider cross-regional interactions. They assumed that own-regional prices influence the supply and demand of products. Our model considers the interactions between organic and conventional sectors by assuming that both organic and conventional prices determine production and consumption amounts.
Despite the fast-paced growth of the U.S. organic apple industry, most studies on pest outbreaks have yet to consider the importance of conventional versus organic production methods and the market-level interactions between them. An exception is a study by Galinato et al. (Reference Galinato, Gallardo, Granatstein and Willett2018) that studied the different impacts of pest expansion between the organic and conventional apple industries. However, they only estimated the impact on Washington State’s economy using a static cost–benefit analysis. The contribution of this study is to model the effects of pest and disease shocks on the U.S. apple industry by separating it into organic and conventional production sectors and considering the interactions between them.
3. Theoretical Model
The study uses a dynamic model of the U.S. apple industry building on Tozer and Marsh (Reference Tozer and Marsh2018), separating the industry into organic and conventional production methods and markets. We assume perfect competition throughout. While tree fruit farm sizes are increasing, similar to the rest of agriculture, it is reasonable to assume that no single or small subset of farms has pricing power. In our model, the shock on the organic production method affects the conventional apple production method and vice versa. For example, in our empirical estimation, the organic bearing area ( $\Delta B{A^o}$
) would be affected by the organic price premium that is made up of the farm-level prices of organic and conventional apples (
$\Delta B{A^o}$
) would be affected by the organic price premium that is made up of the farm-level prices of organic and conventional apples ( $p_\;^{F,\;o}$
and
$p_\;^{F,\;o}$
and $p_\;^{F,\;c}$
). In addition, there may be supply effects when analyzing the interactions between the organic and conventional apple industry because organic growers, under some circumstances (such as an increase in insect pressure and the need to increase the number and type of chemical applications), sell their products as conventional. One of our scenarios in this study represents the situation where organic apple growers sell their products as conventional because they cannot meet the conditions required for organic products, therefore reducing the supply of organic apples (
$p_\;^{F,\;c}$
). In addition, there may be supply effects when analyzing the interactions between the organic and conventional apple industry because organic growers, under some circumstances (such as an increase in insect pressure and the need to increase the number and type of chemical applications), sell their products as conventional. One of our scenarios in this study represents the situation where organic apple growers sell their products as conventional because they cannot meet the conditions required for organic products, therefore reducing the supply of organic apples ( $F{D^o}$
) while increasing the supply of conventional (
$F{D^o}$
) while increasing the supply of conventional ( $F{D^c}$
) apples. Also, organic and conventional varieties of apples would affect each other in that the prices of organic might be marked up as a function of the prices for conventional for each variety, even though those scenarios are not considered in this research.
$F{D^c}$
) apples. Also, organic and conventional varieties of apples would affect each other in that the prices of organic might be marked up as a function of the prices for conventional for each variety, even though those scenarios are not considered in this research.
Also, considering the importance of export markets for the U.S. apple industry, our model includes international trade to depict the interactions between domestic and international markets. For simplification purposes, this model only focuses on fresh market apples. This is because most growers in the U.S. invest in apple production, considering selling their output to the fresh market.Footnote 1
Following Tozer and Marsh (Reference Tozer and Marsh2018), our model includes three levels of the supply chain: farm level, wholesale level, and retail level. At the farm level, total supply is a function of the bearing acreage multiplied by the yield per acre. We assume the bearing acreage is fixed in the short run and prone to change in the long run. Fresh apples are distributed to domestic or international markets through a market-clearing condition at wholesale. Also, imports are linked through market-clearing price conditions at the wholesale level. The quantities imported and exported are assumed to be determined by the wholesale-level prices. At the retail level, the demand for apples is a function of apple retail prices, retail prices of substitute products (e.g., organic apple prices for conventional apples), and household income. Finally, for the market-clearing condition, domestic supply plus imports equals domestic consumption plus exports, and the market-clearing prices at each level are identified through marketing margins. The market-clearing optimization model is based on the EDM.
3.1. Bearing Area
The equations for bearing area follow Tozer and Marsh’s (Reference Tozer and Marsh2018) model with the addition of separating the industry into organic and conventional. The total bearing area $(A_t^d)$
is the sum of the areas with trees that have reached full maturity (
$(A_t^d)$
is the sum of the areas with trees that have reached full maturity (
 $$j{j_\tau }$$
) up to age J when trees are removed:
$$j{j_\tau }$$
) up to age J when trees are removed:
 $$A_t^d = \mathop \sum \limits_{j = {j_\tau }}^J A_t^{j,d}\;\;,\;\quad d = \left\{ {o,c} \right\}$$
where d=o represents organic and c represents conventional production methods, and $A_t^{j,d} = A_{t - 1}^{j - 1,d} - RM_t^{j,d} + A_{t - 1}^{{j_\tau } - 1,d}$
.
$A_t^{j,d} = A_{t - 1}^{j - 1,d} - RM_t^{j,d} + A_{t - 1}^{{j_\tau } - 1,d}$
. $A_{t - 1}^{j - 1,d}$
is the previous year’s bearing area.
$A_{t - 1}^{j - 1,d}$
is the previous year’s bearing area. $RM_t^{j,d}$
is the area of trees removed in the current year. The final term,
$RM_t^{j,d}$
is the area of trees removed in the current year. The final term, $A_{t - 1}^{{j_\tau } - 1,d}$
, represents the area planted
$A_{t - 1}^{{j_\tau } - 1,d}$
, represents the area planted $\tau $
years ago that reaches productive age in
$\tau $
years ago that reaches productive age in $t$
.
$t$
.
The change in total bearing area $\left( {\Delta A_t^d} \right)$
is defined by,
$\left( {\Delta A_t^d} \right)$
is defined by,
 $$\Delta A_t^d = A_{t - 1}^{{j_\tau } - 1,d} - \mathop \sum \limits_{j = {j_\tau }}^J RM_t^{j,d}$$
An alternative form, shown in (3), employs the difference between new plantings that reaches productive age in t ( $NP_{t - {j_\tau }}^d$
) and total removals.
$NP_{t - {j_\tau }}^d$
) and total removals.
 $$\Delta A_t^d = NP_{t - {j_\tau }}^d - \mathop \sum \limits_{j = {j_\tau }}^J RM_t^{j,d}.$$
Change in bearing area of organic and conventional apples is used for estimation because data on absolute levels are unavailable.
3.2. Apple Production and Farm-level Supply
As with the model of Tozer and Marsh (Reference Tozer and Marsh2018), the total production $(TP_t^d)$
of apples in each year is given by,
$(TP_t^d)$
of apples in each year is given by,
 $$TP_t^d = TA_t^d*AY_{t - 1}^d*\left( {1 + {g^d}} \right),\;\;d = \left\{ {o,c} \right\}$$
where $AY_{t - 1}^d$
is the yield per acre in the previous year, and
$AY_{t - 1}^d$
is the yield per acre in the previous year, and ${g^d}$
is the annual yield growth rate for each apple product. It is assumed that the yield per acre will grow over time because of the replacement of old low-density plantings by new high-density orchard systems, increasing the yield per acre.
Footnote 2
To our knowledge, there are no reliable data on the share of low- and high-density orchards. Therefore, the annual growth rate of yield per acre is considered appropriate for estimating the dynamics of apple production decisions.
${g^d}$
is the annual yield growth rate for each apple product. It is assumed that the yield per acre will grow over time because of the replacement of old low-density plantings by new high-density orchard systems, increasing the yield per acre.
Footnote 2
To our knowledge, there are no reliable data on the share of low- and high-density orchards. Therefore, the annual growth rate of yield per acre is considered appropriate for estimating the dynamics of apple production decisions.
In this model, farm-level supply ( $FD_t^d$
) for fresh apples is given by,
$FD_t^d$
) for fresh apples is given by,
 $$FD_t^d = {f_d}*TP_t^d$$
where ${f_d}$
is the proportion of production destined to the fresh market, which is assumed to be 0.86 for organic and 0.69 for conventional production. This is based on USDA data from 2011 to 2016 (USDA-NASS 2011–2016).
${f_d}$
is the proportion of production destined to the fresh market, which is assumed to be 0.86 for organic and 0.69 for conventional production. This is based on USDA data from 2011 to 2016 (USDA-NASS 2011–2016).
Finally, the total supply of apples in the U.S. is given by,
 $$TSA_t^d = FS_t^d + FM_t^d,{\rm{\;}}$$
where $FM_t^d = s_t^{IM,d}\left( {p_t^{W,d} - c_t^d} \right)$
is the quantity of imported apples,
$FM_t^d = s_t^{IM,d}\left( {p_t^{W,d} - c_t^d} \right)$
is the quantity of imported apples, $s_t^{IM}$
is the imported apple function of prices and costs,
$s_t^{IM}$
is the imported apple function of prices and costs, $p_t^{W,d}$
is the domestic price at the wholesale level, and
$p_t^{W,d}$
is the domestic price at the wholesale level, and $c_t^d$
is the trade costs. The quantity of imported apples is assumed to be determined at the wholesale level.
$c_t^d$
is the trade costs. The quantity of imported apples is assumed to be determined at the wholesale level.
3.3. Apple Demand at the Retail Level
Individual demand for apples is based on the own prices of organic and conventional production, prices of substitutes (e.g., organic prices for conventional apples), and household income. The demand function is therefore:
 $$q_t^d = f_t^d\left( {p_t^{R,o},p_t^{R,c},{I_t}} \right),{\rm{\;\;d}} = \left\{ {{\rm{o}},{\rm{c}}} \right\}\;,$$
where $p_t^{R,o}$
and
$p_t^{R,o}$
and $p_t^{R,c}$
are the retail prices of organic fresh apple and conventional fresh apple, respectively, and
$p_t^{R,c}$
are the retail prices of organic fresh apple and conventional fresh apple, respectively, and ${I_t}$
is the income.
${I_t}$
is the income.
The utility function for consumers is assumed to be homothetic following Tozer and Marsh (Reference Tozer and Marsh2018), and therefore the aggregate individual demand function is given by:
 $$\;QD_t^d = \mathop \sum \limits_{h = 1}^H q_{t,\;h}^d = q_t^d*{H_t}$$
where H is the population, and h represents individual consumers.
Finally, the total demand for apples in the U.S. is represented by,
 $$TDA_t^d = QD_t^d + FX_t^d$$
where $FX_t^d = s_t^{EX,d}\left( {p_t^{W,d} + e_t^d} \right)$
is the quantity demanded by the international market,
$FX_t^d = s_t^{EX,d}\left( {p_t^{W,d} + e_t^d} \right)$
is the quantity demanded by the international market, $\;s_t^{EM}$
is the exported apple function of prices and tariff,
$\;s_t^{EM}$
is the exported apple function of prices and tariff, $p_t^{W,d}$
is the price at the wholesale level, and
$p_t^{W,d}$
is the price at the wholesale level, and $t_t^d$
is the tariff, or the tariff equivalent, of trade barriers. The quantities of exported apples are assumed to be determined through wholesale-level prices.
$t_t^d$
is the tariff, or the tariff equivalent, of trade barriers. The quantities of exported apples are assumed to be determined through wholesale-level prices.
3.4. Intermediaries and Marketing Margins
There are three types of prices: the farmgate price ( $p_t^{F,d}$
), wholesale-level prices (
$p_t^{F,d}$
), wholesale-level prices ( $p_t^{W,d}$
), and retail price (
$p_t^{W,d}$
), and retail price ( $p_t^{R,d}$
). The farm-to-retail marketing margin comprises two components, the farm-to-wholesale margin (MMF) and the wholesale-to-retail margin (MMR). Thus, the wholesale price follows,
$p_t^{R,d}$
). The farm-to-retail marketing margin comprises two components, the farm-to-wholesale margin (MMF) and the wholesale-to-retail margin (MMR). Thus, the wholesale price follows,
 $$p_t^{W,} = p_t^{F,d} + MMF_t^d$$
where $MMF_t^d = \gamma _i^{MMF.d}{\rm{*}}p_t^{W,d}$
, and
$MMF_t^d = \gamma _i^{MMF.d}{\rm{*}}p_t^{W,d}$
, and $\gamma _i^{MMF.d}$
is the proportion of wholesale prices that are distributed to farm-to-wholesale margins.
$\gamma _i^{MMF.d}$
is the proportion of wholesale prices that are distributed to farm-to-wholesale margins.
The retail price is
 $$p_t^{R,d} = p_t^{W,d} + MMR_t^d$$
where $MMR_t^d = \gamma _i^{MMR,d}{\rm{*}}p_t^{R,d}$
and
$MMR_t^d = \gamma _i^{MMR,d}{\rm{*}}p_t^{R,d}$
and $\gamma _i^{MMR.d}$
is the proportion of retail prices that are distributed to wholesale-to-retail margins.
$\gamma _i^{MMR.d}$
is the proportion of retail prices that are distributed to wholesale-to-retail margins.
3.5. Market-clearing
Import and export decisions are made at the wholesale level, so it is assumed that the apple market clears at the wholesale level. Therefore, the market-clearing condition follows:
 $$TDA_t^d = TSA_t^d\;,$$
or
 $$QD_t^d + FX_t^d = FS_t^d + FM_t^d$$
3.6. Equilibrium Displacement Model
The farm-level supply for fresh apples is given by $FD_t^d = {f_d}*TP_t^d$
. The total logarithmic differential equation is as follows:
$FD_t^d = {f_d}*TP_t^d$
. The total logarithmic differential equation is as follows:
 $$EFS_t^d = ETP_t^d$$
where E represents the total logarithmic differential of each equation.
The total demand function for domestically grown apples is given by $\;QD_t^d = q_t^d*{H_t}$
, where
$\;QD_t^d = q_t^d*{H_t}$
, where $q_t^d = f_t^d\left( {p_t^{R,o},p_t^{R,c},{I_t}} \right)$
. Therefore, logarithmically differentiating demand results in the following expression:
$q_t^d = f_t^d\left( {p_t^{R,o},p_t^{R,c},{I_t}} \right)$
. Therefore, logarithmically differentiating demand results in the following expression:
 $$EQD_t^d = E{H_t} + {\eta ^{o,d}}*Ep_t^{R,o} + {\eta ^{c,d}}*Ep_t^{R,c} + {\nu ^d}*E{I_t}$$
where and ${\eta ^{c,d}} = {{\partial f_t^d} \over {\partial p_t^{R,c}}}{{p_t^{R,x}} \over {q_t^d}}$
represent the own-price elasticities and the cross-price elasticities, and
${\eta ^{c,d}} = {{\partial f_t^d} \over {\partial p_t^{R,c}}}{{p_t^{R,x}} \over {q_t^d}}$
represent the own-price elasticities and the cross-price elasticities, and ${\nu ^d} = {{\partial f_t^d} \over {\partial {I_t}}}{{{I_t}} \over {q_t^d}}$
is the income elasticity.
${\nu ^d} = {{\partial f_t^d} \over {\partial {I_t}}}{{{I_t}} \over {q_t^d}}$
is the income elasticity.
To depict international trade, we denote the function of imported apples and that of exported apples by $FM_t^d = s_t^{IM,d}\left( {p_t^{W,d} - c_t^d} \right)$
and
$FM_t^d = s_t^{IM,d}\left( {p_t^{W,d} - c_t^d} \right)$
and $FX_t^d = s_t^{EX,d}\left( {p_t^{W,d} + e_t^d} \right)$
, respectively. Taking total logarithmic differentiation gives the following:
$FX_t^d = s_t^{EX,d}\left( {p_t^{W,d} + e_t^d} \right)$
, respectively. Taking total logarithmic differentiation gives the following:
 $${\rm{E}}FM_t^d = {\mu ^{IM,d}}{\left( {p_t^{W,d} - c_t^d} \right)^{ - 1}}\left( {p_t^{W,d}Ep_t^{W,d} - dc_t^d} \right)$$
and
 $${\rm{E}}FX_t^d = {\mu ^{EX,d}}{\left( {p_t^{W,d} + e_t^d} \right)^{ - 1}}\left( {p_t^{W,d}Ep_t^{W,d} + de_t^d} \right)$$
where ${\mu ^{IM,d}} = {{\partial s_t^{IM,d}} \over {\partial \left( {p_t^{W,d} - c_t^d} \right)}}{{p_t^{W,d}} \over {FM_t^d}}$
and
${\mu ^{IM,d}} = {{\partial s_t^{IM,d}} \over {\partial \left( {p_t^{W,d} - c_t^d} \right)}}{{p_t^{W,d}} \over {FM_t^d}}$
and ${\mu ^{EX,d}} = {{\partial s_t^{EX,d}} \over {\partial \left( {p_t^{W,d} + e_t^d} \right)}}{{p_t^{W,d}} \over {FX_t^d}}$
are the price elasticities of imported and exported apples, respectively, with respect to wholesale price.
${\mu ^{EX,d}} = {{\partial s_t^{EX,d}} \over {\partial \left( {p_t^{W,d} + e_t^d} \right)}}{{p_t^{W,d}} \over {FX_t^d}}$
are the price elasticities of imported and exported apples, respectively, with respect to wholesale price.
The apple supply from the domestic farm is given by $QS_t^d = FD_t^d + FM_t^d - FX_t^d$
, which is the sum of domestic supply and imported supply minus export demand. The total logarithmic differential equation for domestic supply captures the change in each variable multiplied by the original level of each divided by the total supply as shown in (18). The intuition is that the effect of a given change on the total depends on how big of a share that variable represents.
$QS_t^d = FD_t^d + FM_t^d - FX_t^d$
, which is the sum of domestic supply and imported supply minus export demand. The total logarithmic differential equation for domestic supply captures the change in each variable multiplied by the original level of each divided by the total supply as shown in (18). The intuition is that the effect of a given change on the total depends on how big of a share that variable represents.
 $${\rm{E}}QS_t^d = {{FS_t^d} \over {QS_t^d}}EFD_t^d + {{FM_t^d} \over {QS_t^d}}EFM_t^d - {{FX_t^d} \over {QS_t^d}}EFX_t^d.$$
The relationship between the farmgate and wholesale price and between the wholesale and retail price is represented by $\left( {1 - {\gamma ^{MMF.d}}} \right)p_t^{W,d} = p_t^{F,d}$
and
$\left( {1 - {\gamma ^{MMF.d}}} \right)p_t^{W,d} = p_t^{F,d}$
and $\left( {1 - {\gamma ^{MMR,d}}} \right)p_t^{R,d} = p_t^{W,d}$
, respectively. Taking total logarithmic differentiation of price equations gives the following:
$\left( {1 - {\gamma ^{MMR,d}}} \right)p_t^{R,d} = p_t^{W,d}$
, respectively. Taking total logarithmic differentiation of price equations gives the following:
 $$\left( {1 - {\gamma ^{MMF.d}}} \right)Ep_t^{W,d} = {{p_t^{F,d}} \over {p_t^{W,d}}}Ep_t^{F,d} + {\gamma ^{MMF.d}}*E{\gamma ^{MMF.d}}$$
and
 $$\left( {1 - {\gamma ^{MMR,d}}} \right)Ep_t^{R,d} = {{p_t^{W,d}} \over {p_t^{R,d}}}Ep_t^{W,d} + {\gamma ^{MMR,d}}*E{\gamma ^{MMR,d}}.$$
Since we have market-clearing condition as $TDA_t^d = TSA_t^d$
, or
$TDA_t^d = TSA_t^d$
, or $QD_t^d + FX_t^d = FD_t^d + FM_t^d$
, the total logarithmic differentiation equation is then:
$QD_t^d + FX_t^d = FD_t^d + FM_t^d$
, the total logarithmic differentiation equation is then:
 \begin{align}E{H_t} &+ {\eta ^{o,d}}*Ep_t^{R,o} + {\eta ^{c,d}}*Ep_t^{R,c} + \nu _i^d*E{I_t} = EFD_{i,t}^d\\
&\quad + {{FM_t^d} \over {QS_t^d}}\left[ {{\mu ^{IM,d}}{{\left( {p_t^{W,d} - c_t^d} \right)}^{ - 1}}\left( {p_t^{W,d}Ep_t^{W,d}c_t^d - dc_t^d} \right)} \right]{\rm{ }}\\
&\quad - {{FX_t^d} \over {QS_t^d}}\left[ {{\mu ^{EX,d}}{{\left( {p_t^{W,d} + e_t^d} \right)}^{ - 1}}\left( {p_t^{W,d}Ep_t^{W,d} + de_t^d} \right)} \right].\end{align}
\begin{align}E{H_t} &+ {\eta ^{o,d}}*Ep_t^{R,o} + {\eta ^{c,d}}*Ep_t^{R,c} + \nu _i^d*E{I_t} = EFD_{i,t}^d\\
&\quad + {{FM_t^d} \over {QS_t^d}}\left[ {{\mu ^{IM,d}}{{\left( {p_t^{W,d} - c_t^d} \right)}^{ - 1}}\left( {p_t^{W,d}Ep_t^{W,d}c_t^d - dc_t^d} \right)} \right]{\rm{ }}\\
&\quad - {{FX_t^d} \over {QS_t^d}}\left[ {{\mu ^{EX,d}}{{\left( {p_t^{W,d} + e_t^d} \right)}^{ - 1}}\left( {p_t^{W,d}Ep_t^{W,d} + de_t^d} \right)} \right].\end{align}
Using the market-clearing conditions and price relationship equations, we solve market-clearing prices at different levels of markets (farm, wholesale, and retail levels; $p_t^{F,d},\;p_t^{W,d},\;p_t^{R,d}$
), quantities of supply and demand inside of country (
$p_t^{F,d},\;p_t^{W,d},\;p_t^{R,d}$
), quantities of supply and demand inside of country ( $FD_t^d,QD_t^d$
), and quantities of imports and exports (
$FD_t^d,QD_t^d$
), and quantities of imports and exports ( $FM_t^d$
,
$FM_t^d$
, $\;FX_t^d$
).
$\;FX_t^d$
).
4. Data and Scenarios
4.1. Data
A dynamic model of the apple industry is parameterized using data from the U.S. apple industry. The fresh apple industry is separated into two sectors according to the production method: organic and conventional.
We employ the “utilized fresh apple production” from the Noncitrus Fruits and Nuts (USDA-NASS 2016) and Organic Survey (USDA-NASS 2016) as the farm-level supply of apples. Imports and exports of apples are obtained from the USDA-ERS (2016). For the farm-level prices of apples, this study uses the value of sales per pound from the USDA Noncitrus Fruits and Nuts (USDA-NASS 2016) and the Organic Survey (USDA-NASS 2016). Retail prices of apples are obtained from the USDA-AMS (2016). The wholesale prices are calculated using the information in Tozer and Marsh (Reference Tozer and Marsh2018). They estimated that the average wholesale-to-retail margin of the retail price is about six times the farm-to-wholesale margins of the retail price.
Because data to forecast the bearing acres of organic apples in the U.S. are limited, we employ Washington State organic apple cultivated area in acres. We also use the free on board price in $/40-lb box data by nine apple varieties from various Washington State University Tree Fruit Research and Extension reports considering 2004–2018 (Granatstein and Kirby, Reference Granatstein and Kirby2019). Since Washington State produced about 97% of the fresh organic produce in the country in 2019, according to USDA-NASS (2019), it would be most appropriate to estimate organic bearing acres given the data available. Due to data limitations, we also use the data on the entire apple industry (including both organic and conventional sectors) as a proxy for conventional production. The bearing acres of conventional apples accounted for 95% of total apple acres in 2015 (USDA-NASS 2015). We use the bearing acres and grower price data from 1980 to 2015 from the USDA Noncitrus Fruits and Nuts annual reports to estimate the function of conventional bearing acres.Footnote 3
Then, the model is calibrated as an EDM using the parameters in Table 1. We utilize published elasticities of demand. Few studies have estimated demand elasticities for organic and conventional apples separately. We used the estimates of Lin et al. (Reference Lin, Yen, Huang and Smith2009) as the retail price elasticities of fresh apples in the demand model.Footnote 4 Income elasticities for fresh apples are also from the estimates of expenditure elasticities in Lin et al. (Reference Lin, Yen, Huang and Smith2009).
Table 1. Parameter values used in the simulation
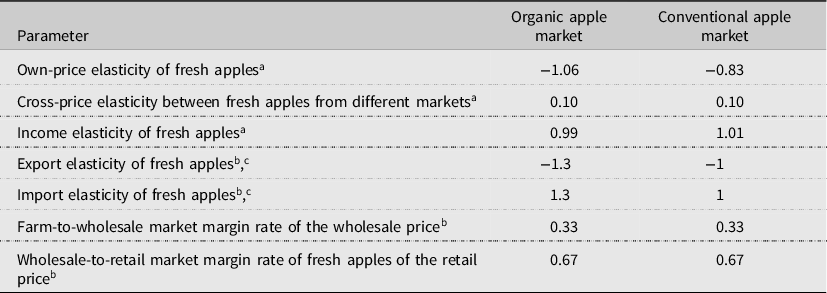
Sources:
a Lin et al. (Reference Lin, Yen, Huang and Smith2009);
b Tozer and Marsh (Reference Tozer and Marsh2018);
c Authors assumed these values.
Import and export elasticities are also needed to complete the model. Roosen (Reference Roosen1999) reported import elasticities for fresh apples as −0.609. Seale, Sparks, and Buxton (Reference Seale, Sparks and Buxton1992) estimated demand elasticities for U.S. apples between −0.90 and −1.62 in Canada, the U.K., Singapore, and Hong Kong. Richards, Van Ispelen, and Kagan (Reference Richards, Van Ispelen and Kagan1997) estimated elasticities for fresh apples at −1. Given the range of the calculated results, Tozer and Marsh (Reference Tozer and Marsh2018) assumed the import and export elasticities as −1 for U.S. fresh apples. Previous studies estimated that the elasticities of organic apples are larger than those of conventional apples (Lin et al., Reference Lin, Yen, Huang and Smith2009). Following these studies, we set the export (import) elasticities at −1.3 (1.3) for organic and −1 (1) for conventional apples.
4.2. Scenarios
We examine a limited number of scenarios that offer a reasonable representation of pest or disease outbreaks that are a balance of being similar to scale to historical examples and also relevant to future shocks under climate change for the U.S. apple industry. The baseline scenario represents the economic outcomes resulting from a situation in which the apple consumer population increases annually by 0.9%, and the annual apple yield growth rate is 1% due to farms’ strategies of planting and removal.Footnote 5 The future climate-induced exogenous shocks are applied to this baseline scenario.
The second scenario contemplates a situation where the organic and conventional apple-bearing areas are reduced by 5% and 2% due to pest and disease outbreaks. The justification for this scenario relies on the evidence from Michigan. In 2000, fire blight caused the removal of about 400,000 apple trees covering approximately 2,000 acres, which was 4% of the apple-bearing area in Michigan (Longstroth, Reference Longstroth2001). Over the years, after the fire blight spread, it has been scarce in northern Michigan due to the cooler weather, which has helped keep the bacteria. However, warmer, wetter temperatures of late spring and early summer 2019 have caused fire blight to become more prevalent in the region. As the climate crisis is expected to bring longer, warmer, and rainier springs, fire blight that spreads quickly during the blooming season is more likely to increase the risk of infecting trees (Vansickle, Reference Vansickle2019). We assume that the damage to the organic apple area is more prominent than the conventional apple area, considering the number of limitations in treating diseases for organic apples. For example, the antibiotics to control fire blight have been removed from the list of allowed materials by the National Organic Standards Board in the U.S. As a result, these antibiotics have been prohibited for organic orchards since October 2014 (Granatstein, Reference Granatstein2019).
The third scenario represents a situation in which the organic apple yield is reduced by 10%, and the conventional apple yield is reduced by 2%. The recurrence of the pest codling moth in U.S. apple orchards justifies this scenario. The codling moth is distributed worldwide; the number of codling moth generations depends mainly on the length of the season (when exactly the apples are to be harvested) and the climate conditions of the production environment (Stoeckli et al., Reference Stoeckli, Hirschi, Spirig, Calanca, Rotach and Samietz2012). Stoeckli et al. (Reference Stoeckli, Hirschi, Spirig, Calanca, Rotach and Samietz2012) showed that under future conditions with increased temperatures, the present risk of below 20% for a pronounced second generation would increase to 70–100%, and the risk of an additional third generation will increase from presently 0–2% to 100%. Projected warming patterns will result in forced applications of additional spray to control for second and third generations. Consumers are increasingly demanding fresh fruits with a reduced number of chemical applications. Therefore, only limited options would be available for growers to manage pests and diseases (Jones et al., Reference Jones, Steffan, Hull, Brunner and Biddinger2010; Simon et al., Reference Simon, Brun, Guinaudeau and Sauphanor2011), which could reduce apple yields. Under this scenario, a decline in yields of organic apples is more prominent than those of conventional apples. Previous research suggests that fruit damage from pests and diseases is more severe in organic (between 0.1% and 23.7%) compared to conventional (between 0% and 2.1%) production methods (Simon et al., Reference Simon, Brun, Guinaudeau and Sauphanor2011).Footnote 6
The fourth scenario presents a situation where organic apple growers face a pest or disease outbreak and decide to increase the number of chemical applications or use synthetic chemicals not approved for organic production. The bacteria (E. amylovora) causing fire blight in apple and pear trees is difficult to control without antibiotics. With new regulations in the U.S. preventing antibiotic use in organic orchards after 2014, however, organic farmers face a difficult choice—spray their apple plants with antibiotics and lose their organic certification or risk the disaster of a fire blight outbreak. Moreover, since the current production system for apples and pears was built on the high yields that were only possible with this practical tool against fire blight, even small outbreaks of fire blight can cause significant yield losses. For example, a 10% fire blight infection that has spread to the roots of a 4-year-old apple orchard can result in losses of around $12,000–15,000 per acre (Johnson, Reference Johnson2021). Therefore, in some pest outbreaks, organic farmers use antibiotics to control the devastating disease, deterring compliance with organic standards. Under this fourth scenario, organic apple production would decrease by 5%, increasing conventional and declining organic production.
The fifth scenario investigates the response of apple-importing countries to pest or disease outbreaks. The spread of pests and diseases results in increased concerns from apple-importing countries to introducing and distributing new pests and diseases in their countries. For example, China, British Columbia, and Canada require all apples shipped from the U.S. to be certified as apple maggot-free. Washington State has implemented a quarantine program Footnote 7 to prevent apple maggot dissemination (Hong et al., Reference Hong, Gallardo, Fan, Atallah and Gómez2019). Following Hong et al. (Reference Hong, Gallardo, Fan, Atallah and Gómez2019), apples from quarantine areas must be stored at 1°C for 40 days, with the cost burden from cold treatment at $11 per 40 lb box. Under the fifth scenario, all producers must implement cold treatment to export fresh products and face the cost ($0.275 per pound) as a trade barrier.
The exogenous shocks to the system occurred in 2016 under scenarios 2–5, and all models are simulated for over 10 years. Although there are still many unknowns related to climate change, a more advanced, proactive, and scientific approach will be applied to deal with the pest and disease outbreak-related problems caused by climate change. With this assumption, we assumed the shock is not a continuing event in each scenario.
5. Results
5.1. Bearing Acres Model
From the data listed above, we modeled the bearing acres for organic and conventional industries, respectivelyFootnote 8 :


where Adj. ${R^2}$
is 0.689 (for the organic model) and 0.706 (for the conventional model), and ***, **, and *indicate significance with 99%, 95%, and 90% confidence, respectively.
${R^2}$
is 0.689 (for the organic model) and 0.706 (for the conventional model), and ***, **, and *indicate significance with 99%, 95%, and 90% confidence, respectively. $premiu{m_t}$
=
$premiu{m_t}$
= $\mathop \sum \nolimits_{j = 0}^2 \left( {p_{t - j}^{F,o} - p_{t - j}^{F,c}} \right)/3$
represents the average organic price premium over 3 years, and
$\mathop \sum \nolimits_{j = 0}^2 \left( {p_{t - j}^{F,o} - p_{t - j}^{F,c}} \right)/3$
represents the average organic price premium over 3 years, and $p_t^{F,d}$
represents the farmgate prices of apples where d={o, c}.
$p_t^{F,d}$
represents the farmgate prices of apples where d={o, c}.
Farms need 3 years to transition from conventional to certified organic production in the U.S., with no regulation for the conventional sector. Therefore, it is reasonable to assume that the bearing area (acreage) and the output prices for organic during the first 3 years of production, that is, the years of transition to organic, are more volatile than conventional production. This study assumes that for organic, the prices change considering lags of 2, 3, and 5 years, and the acreages change considering lags of 1, 2, and 5 years. This study also assumes that for conventional, the price changes considering lags of 1 and 2 years and acreage changes at a lag of 1 year. In sum, the bearing area of conventional production is quickly affected by changes during the previous period. Organic production takes longer to adjust due to the 3-year transition requirement.
5.2. Simulation Results
Results from the baseline scenario, without any exogenous shock, show that the bearing area of organic apples will increase while the area of conventional apples will decrease. The average annual growth rates of the bearing acreage of organic apples are 1.6%, and conventional apples are −1.8% (see Table 2). Organic apple production increased by approximately 30% throughout the study, while conventional fresh apples decreased by about 8%. However, the share for conventional apples will still be more prominent because the bearing acres and production of the conventional production will still account for over 90% of the apple industry.
Table 2. Trends of bearing area and apple supply without shock, baseline

As shown in Table 3, the price for organic apples will decrease gradually as production grows, while conventional apple prices increase as production is reduced. Therefore, the organic price premium will decrease gradually over the study period. The net trade of organic apples increases, whereas the net trade of conventional apples decreases. This may be because declining prices of domestic organic crops make domestically grown crops more attractive; consequently, the imports of organic crops decrease, and exports increase. Domestic conventional crops become less appealing to foreign consumers due to increased prices; thus, exports decrease, and imports increase. Results in Appendix A are aligned with the results in this section.
Table 3. Trends of prices, exports, and imports without shock, baseline

In scenario 2, considering the negative supply shock on the bearing acreage, all the net changes in economic surplus are negative in both the organic and conventional sectors (see Table 5 and Figure 1). Figure 1 shows trends for consumer and producer surpluses. The changes in surpluses for conventional and organic industries are plotted on the left and right sides of the graphs. Consumers are worse off since decreased production increases retail prices relative to baseline. Domestic consumption for both production methods decreases as higher prices require consumers to increase their food expenditure, and, therefore, the consumer surplus decreases.
Table 4. Comparison of net-trade effects between scenario 2 and baseline


Figure 1. Change in economic surplus under scenario 2: negative supply shock on the bearing acreage (5% and 2% reductions of organic and conventional bearing acreage, respectively).
On the other hand, the positive effects on producer surplus signal that the price increases outweigh the losses from the reduced production. However, it would be possible that subsequent replanting follows, leading to re-gains in the bearing area and allowing production to increase and prices to decrease, gradually decreasing producer surplus. As the price increases, there also exists a negative net-trade effect, where imports of apples increase while exports decrease in both organic and conventional industries (see Table 4). This is because higher prices for domestic crops make foreign crops relatively more attractive to domestic consumers, while domestic crops become less appealing to foreign countries. To test the robustness of these results, additional analyses considering different own and cross-price elasticities are presented in Appendix A.Footnote 9
Figure 2 shows the results of changes in yields represented by scenario 3. Consumer surplus is reduced right after the yield shock due to increases in retail prices and then rebounds and remains relatively constant in the following periods in both sectors. The change in the producer surplus also rebounds right after the yield shock, but the recovery speed is relatively slow in the conventional sector. This is because a vast yield shock in the organic industry leads to higher increases in retail prices and organic production than conventional. To test the robustness of these results, additional analyses considering different own and cross-price elasticities are presented in Appendix A.
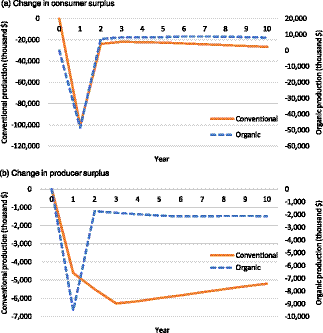
Figure 2. Change in economic surplus under scenario 3: negative supply shock on the yields (10% and 2% reductions in organic and conventional production, respectively).
Figure 3 shows the welfare changes under scenario 4, where some initially grown organic apples are sold as conventional. Consumer and producer surpluses for organic apples decrease while the surpluses of conventional apples increase right after the shock. The positive effects on surplus for the conventional sector suggest that the impacts of an increase in production sold as conventional outweigh the losses from the decreased prices.
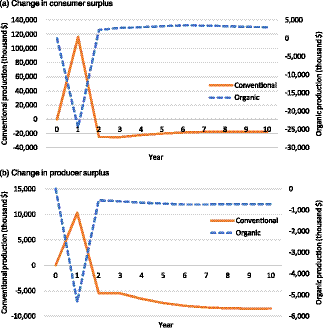
Figure 3. Change in economic surplus under scenario 4: 5% of initially grown organic apple production is sold as conventional.
From the trade cost shock in scenario 5, organic and conventional industries show similar results (Figure 4). As the trade costs are imposed on organic and conventional apples, the exports of both apples decrease right after the shock. Immediately after the trade cost shock, declines in exports are rerouted to domestic supply, reducing the equilibrium prices in both sectors; producer surpluses fall while consumer surpluses increase.
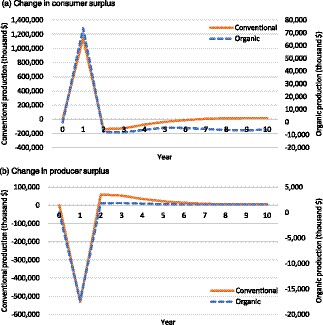
Figure 4. Change in economic surplus under scenario 5: apple-importing countries must implement cold treatment to export fresh products.
Table 5 reports the net present values of welfare changes over the analysis period. For the organic industry, a negative supply shock on the bearing acreage represented by scenario 2 has the largest impact on surplus (-$72.23 million). In comparison, the trade cost shock in scenario 5 has the largest effect on conventional ($472.36 million). According to the USDA (2022), aggregate sales of all apples and certified organic apples were $3,032 and $628 million, respectively, in 2021. Therefore, welfare changes under scenarios 2 and 5 can be considered a means for the organic and conventional industries.
6. Conclusions
This study specifies a dynamic economic model to consider the direct and indirect consequences of pest and disease outbreak shocks on conventional and organic U.S. apple production. Our model is based on a dynamic change in the bearing area for organic and conventional apples that predicts changes in welfare as economic agents respond to outbreaks. Though we parameterize our model using the U.S. apple industry, it is general enough to be easily adapted to consider organic and conventional interactions for other agricultural commodities, which is an understudied research question.
We model a baseline and four scenarios representing pest or disease outbreaks motivated by recent events to increase the salience of the results to key stakeholders. The outcome variables modeled include changes in bearing acreage, yield shock, and trade. Scenarios 2 and 3, where pest and disease outbreaks cause supply shocks through bearing area and yield, show negative net changes in total surplus. The empirical simulation results also show that, due to the differences between the organic and conventional sectors, the impacts of pests and disease shocks vary across industries. The extent of such effects on producer and consumer surpluses is different.
Models like the one examined in this study should be essential to building a proactive and advanced scientific approach for mitigating more frequent and severe pest and disease outbreaks, particularly given the continued expansion in certified organic production. Findings in this study demonstrate that the effects of pest or disease outbreaks on producer and consumer welfare vary between organic and conventional industries and by the types of shock. Farmers can refer to the results of this study to assess potential economic losses from alternative land allocations between organic and conventional. Also, since the ability to adapt pest management practices depends on their physical and financial resources, government support will be required for planning and conducting adaptation and mitigation strategies. In this context, policy makers should analyze representative crops and production methods, in this case, organic versus conventional, and determine the amount of financial and technical support for farmers by considering the changes in consumer and producer surpluses and crop losses.
Data availability statement
The data supporting this study's findings are available from the Noncitrus Fruits and Nuts (USDA-NASS 2016) and Organic Survey (USDA-NASS 2016). Imports and exports of apples are obtained from the USDA-ERS (2016). For the farm-level prices of apples, this study uses the value of sales per pound from the USDA Noncitrus Fruits and Nuts (USDA-NASS 2016) and the Organic Survey (USDA-NASS 2016). Retail prices of apples are obtained from the USDA-AMS (2016). The wholesale prices are calculated using the information in Tozer & Marsh (2018). We also use the free on board (FOB) price from various Washington State University Tree Fruit Research and Extension reports considering 2004 to 2018 (Granatstein & Kirby, 2019). We use the bearing acres and grower price data from 1980 to 2015 from the USDA Noncitrus Fruits and Nuts annual reports to estimate the function of conventional bearing acres.
Acknowledgments
The authors thank Thomas Marsh for his helpful comments.
Author contributions
Lim has contributed to the conceptualization, data curation, formal analysis, investigation, methodology, software, validation, and writing the original draft. Gallardo has contributed to the investigation, methodology, supervision, and writing review and editing. Brady has contributed to the conceptualization, data curation, formal analysis, funding acquisition, investigation, methodology, resources, supervision, validation, and writing review and editing.
Financial support
This research received no specific grant from any funding agency, commercial or not-for-profit sectors.
Competing interests
Author Lim, Gallardo, and Brady declare none.
Appendix A. Robustness test for scenarios 2 and 3.
We conducted an additional analysis with different parameters under scenario 2 (Figures A1–A4) and scenario 3 (Figures A5–A8).
-
(1) Since some previous research (reported in Tozer and Marsh) had used lower own-price elasticities than those utilized in this paper, we analyzed them with lower own-price elasticities. Figures A1 and A5 present simulation results with lower own-price elasticities (−0.6 and −0.3 for organic and conventional, respectively).
-
(2) Figures A2 and A6 present results with −0.5 and −0.2 for organic and conventional own-price elasticities.
-
(3) The range of cross-price elasticities in previous research is 0.03–0.32 (Lin et al. Reference Lin, Yen, Huang and Smith2009; Nelson et al. Reference Nelson, Fitzgerald, Tefft and Anderson2017). Figures A3 and A7 present simulation results with lower cross-price elasticities (0.05) than in Figure 1 (0.1).
-
(4) Figures A4 and A8 present simulation results under scenario 2 with larger cross-price elasticities (0.15) than in Figure 1 (0.1).
For scenario 2, the different parameterization has no significant impact on the trends of changes in consumer and producer surpluses (see Figures A1–A4). On the other hand, for scenario 3, Figures A5–A7 show that the changes in producer surplus are different right after the shock, compared to Figure 2. However, comparison results from Table A1 show that simulations with different parameters have no significant impacts on the net present values of welfare changes over the analysis period.
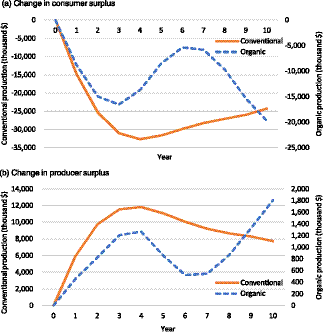
Figure A1. Simulation results under scenario 2 with lower own-price elasticities (−0.6 and −0.3 for organic and conventional, respectively).

Figure A2. Simulation results under scenario 2 with lower own-price elasticities (−0.5 and −0.2 for organic and conventional, respectively).

Figure A3. Simulation results under scenario 2 with lower cross-price elasticities (0.05).

Figure A4. Simulation results under scenario 2 with larger cross-price elasticities (0.15).

Figure A5. Simulation results under scenario 3 with lower own-price elasticities (−0.6 and −0.3 for organic and conventional, respectively).

Figure A6. Simulation results under scenario 3 with lower own-price elasticities (−0.5 and −0.2 for organic and conventional, respectively).

Figure A7. Simulation results under scenario 3 with lower cross-price elasticities (0.05).

Figure A8. Simulation results under scenario 3 with larger cross-price elasticities (0.15).
Table A1. Net present values of welfare impacts


 Open access