


Introduction
The role of iconicity in language processing – that is, the non-arbitrary mapping between form and meaning – has captured the attention of cognitive linguists in recent years, as reflected in a notable increase in the literature in this area (Nielsen & Dingemanse, Reference Nielsen and Dingemanse2020). This has been of particular interest to those in the field of child language development, as compelling arguments have been made regarding a possible role for iconic forms in early acquisition. The term ‘iconicity’ includes a range of phenomena, from iconic gestures to onomatopoeic forms, and the sound symbolism literature has perhaps had the strongest influence on this area of research. Sound symbolism is the non-arbitrary association between the phonetic or acoustic properties of a word and its meaning, and the extant literature presents a compelling picture of how this phenomenon might support word learning in the early stages of development. In this study, we consider the role of size sound symbolism – the encoding of object size through pitch, whereby a high pitch relates to smaller objects and a low pitch to larger objects – and its potential role in early language learning. We observe English-speaking mothers’ use of size-related sound symbolism when referring to large versus small objects in speech addressed to their infants. This will allow us to determine whether infants acquiring English have the opportunity to draw on such cues in the early stages of word learning. We aim to identify whether sound symbolic cues are indexed in caregiver speech, thereby testing whether the sound symbolism bootstrapping hypothesis can support learning in naturalistic speech to infants.
A large body of experimental evidence suggests that sound symbolic cues in infants’ input may support their transition to early lexical understanding. Evidence in this area is convincing,Footnote 1 showing that infants make inferences about sound in relation to specific properties of an object (Pejovic & Molnar, Reference Pejovic and Molnar2017; Peña et al., Reference Peña, Mehler and Nespor2011). Köhler’s (Reference Köhler1970) ‘bouba-kiki’ effect is the most famous and highly-replicated example of this phenomenon: when presented with a rounded shape and a spiky shape, both monolingual (Basque) and bilingual (Spanish–Basque) infants as young as 12 months old map novel words such as ‘buba’ onto the rounded shape, and words such as ‘kiké’ onto the spiky shape (Pejovic & Molnar, Reference Pejovic and Molnar2017; this effect was not found in 4-month-olds in their study, but cf. Ozturk et al., Reference Ozturk, Krehm and Vouloumanos2013, for evidence from a smaller sample (n=12) of younger infants). Similar studies have shown the same effect for properties of size, whereby four-month-olds tend to map higher-pitched vowels such as /i/ onto smaller objects and lower-pitched vowels such as /a/ onto larger objects (Peña et al., Reference Peña, Mehler and Nespor2011). Indeed, infants make the same inferences for non-linguistic sounds; Fernández-Prieto et al. (Reference Fernández-Prieto, Navarra and Pons2015) tested infants on their ability to map rising/descending frequency sweeps onto shapes whose sizes increased or decreased, to find that six-month-olds associated descending sweeps with objects becoming bigger, and ascending sweeps with objects becoming smaller. However, the four-month-old participants did not make any consistent associations between sound and size.
Language development researchers have noted that these biases could play an important role in a developing linguistic system; if infants can identify that a word such as ‘kiki’ relates to a spiky or small object in their visual field, they can begin to infer information about this pairing and the language that surrounds it. Known as the ‘sound symbolism bootstrapping hypothesis’ (Imai & Kita, Reference Imai and Kita2014), this theory proposes that sound symbolic forms provide a “referential insight” (Imai & Kita, Reference Imai and Kita2014, p. 2) into the ambient language, which may enable infants to establish a lexical representation between a form and its meaning. Over time, this bootstraps the transition towards arbitrary word-form mappings.
Evidence in favour of this theory is well-established, and has been tested across various languages (Maurer et al., Reference Maurer, Pathman and Mondloch2006 for English; Imai et al., Reference Imai, Kita, Nagumo and Okada2008 for Japanese; Pejovic & Molnar, Reference Pejovic and Molnar2017 for Spanish and Basque; Peña et al., Reference Peña, Mehler and Nespor2011 for Spanish), age groups (Imai et al., Reference Imai, Kita, Nagumo and Okada2008 for adults and toddlers; Kovic et al., Reference Kovic, Plunkett and Westermann2010 for adults; Pejovic & Molnar, Reference Pejovic and Molnar2017 for babies) and paradigms (Asano et al., Reference Asano, Imai, Kita, Kitajo, Okada and Thierry2015 using EEG; Imai et al., Reference Imai, Miyazaki, Yeung, Hidaka, Kantartzis, Okada and Kita2015 using eye-tracking; Yang et al., Reference Yang, Asano, Kanazawa, Yamaguchi and Imai2019 using NIRS). A recent meta-analysis of the bouba-kiki phenomenon revealed a moderate effect for sound symbolism on infants’ and toddlers’ ability to match supposedly sound symbolic words to rounded or spiky shapes (Fort et al., Reference Fort, Lammertink, Peperkamp, Guevara-Rukoz, Fikkert and Tsuji2018; see also Styles & Gawne, Reference Styles and Gawne2017 for a similar meta-analysis of adult studies), though this was stronger for bouba- than kiki-type words, and both showed an increasing effect with age. Importantly, this effect appears to be consistent across languages both with and without systematic sound symbolic correspondences.Footnote 2 Japanese and Korean (as well as many other Southeast Asian and sub-Saharan languages) possess a rich sub-lexicon of sound symbolic words, or mimetics (Imai & Kita, Reference Imai and Kita2014), which function as an integral part of formal speech, while most Indo-European languages have relatively few examples of iconicity (generally limited to onomatopoeia and phonaesthemes such as ‘gl-words’ in English, glisten, glitter, gleam; Bergen, Reference Bergen2004). Imai et al. (Reference Imai, Kita, Nagumo and Okada2008) tested Japanese three-year-olds on their ability to learn novel verbs modelled on Japanese mimetics to find that these toddlers were better-able to learn verbs that sound-symbolically matched their associated actions. These results were consistent when this experiment was replicated with English-speaking three-year-olds (Kantartzis et al., Reference Kantartzis, Imai and Kita2011), leading the authors to propose a universal sensitivity to sound symbolic form-meaning pairings.
This ‘sensitivity’ may be driven by a language-neutral processing bias towards sound symbolic object-referent pairings, which supports perceptual mapping in the early stages of language development. It is thought that these inferences relate to what Ohala (Reference Ohala1984) terms the ‘frequency code’: a symbolic relationship between formant values and vocal tract size in the production of a specific segment, and its corresponding meaning. Vowels and consonants with a smaller vocal tract size such as /i/ and /k/, refer to small, sharp or rapid referents, while those produced with a larger space in the vocal tract such as /a/ and /b/ relate to large, slow or heavy referents (Hinton et al., Reference Hinton, Nichols, Ohala, Hinton, Nichols and Ohala1994). Japanese mimetics are derived from these correspondences (Ivanova, Reference Ivanova2006); Kita (Reference Kita1997, p.380) claims that “in [the] realm of mimetic forms, phonemes seem to have meanings of their own.” That is to say that in Japanese (and other languages that contain systematic sound symbolic systems), individual segments are inherently meaningful, and can be drawn upon in the perception of linguistic forms. In their analysis of perception in synaesthesia, Ramachandran and Hubbard (Reference Ramachandran and Hubbard2001, p. 20) posit that this is established via multisensory integration, as “certain lip and tongue movements in motor brain maps may be mapped in non-arbitrary ways onto certain sound inflections and phonemic representations.” From a very early age, it is possible that infants integrate these multimodal mappings, which would lead them to establish associations between specific physical properties (as manifested in the shape and size of the vocal tract during vocalization) and the vocalizations they produce.
While the typological focus of literature in this area has tended to discuss ‘overtly’ sound symbolic languages such as Japanese, recent evidence suggests that sound symbolic mappings may be inherent to the world’s languages. For example, Blasi et al. (Reference Blasi, Wichmann, Hammarström, Stadler and Christiansen2016) analysed 62% of the world’s 6,000+ languages (incorporating 85% of language families) to find 74 sound-meaning correspondences that occurred more systematically across languages than would be expected by chance. This included /i/ for features of smallness, and /p/ or /b/ for features of fullness. The authors conclude that these systematic correspondences may reflect constraints on or preferences towards sounds and meanings, which may be influenced by biases “common to our species, such as sound symbolism, iconicity, communicative pressures, or synesthesia.” (Reference Blasi, Wichmann, Hammarström, Stadler and Christiansen2016, p.10821). With this in mind, one might conclude that these biases may be relevant to development across languages. Indeed, this appears to be reflected in the first words that children produce: Perry et al. (Reference Perry, Perlman and Lupyan2015) analysed the first words acquired by children in relation to their perceived iconicity (as judged by adult speakers) to show that the earliest-acquired words were rated highest for iconic properties in both American English and Spanish. Furthermore, Perry et al. (Reference Perry, Perlman, Winter, Massaro and Lupyan2018) found this to be reflected in the frequency of individual words produced in both child and child-directed (but not adult-directed) speech: 12-month-olds’ most frequent words correlated positively with their iconicity scores, and these results dissipated as the children got older. This was also reflected in adults’ speech to their children versus other adults. All results were consistent when onomatopoeia were removed from the analyses (Perry et al., Reference Perry, Perlman and Lupyan2015, Reference Perry, Perlman, Winter, Massaro and Lupyan2018). Similar findings have been observed in studies of sign language acquisition: iconicity is prevalent both in early-acquired signs (Thompson et al., Reference Thompson, Vinson, Woll and Vigliocco2012) and early child-directed signs (Perniss et al., Reference Perniss, Lu, Morgan and Vigliocco2017; but see Orlansky & Bonvillian, Reference Orlansky and Bonvillian1984, for contrasting findings).
Together these studies present compelling evidence towards a role for iconicity in early language learning by bringing together findings from acquisition and production of iconic forms in natural language data. Some experimental studies from adult speakers suggest that prosody may also be drawn upon in infant-directed speech (IDS) to index semantic properties. Nygaard et al. (Reference Nygaard, Herold and Namy2009) asked adult female speakers to produce sentences in an IDS speech style with embedded novel words that related to novel objects with different physical properties. They observed that words referring to smaller objects were produced in utterances with a significantly higher pitch than words referring to larger objects. Similar but non-significant trends were found across a tall/short parameter. In a follow-up experiment, this was found to support word identification amongst adult participants. Similarly, Perlman et al. (Reference Perlman, Clark and Johansson Falck2015) found that adults indexed properties of speed and size when reading ‘fast stories’ compared with ‘slow stories’, and ‘small stories’ versus ‘big stories’, respectively. For example, phrases from a story about a big house were produced at a significantly lower pitch than a story about a small house. Alongside the segmental sound symbolic mappings discussed above, it seems that sound symbolic mappings relating to properties such as size are available in natural languages. These have the potential to support the language learner when forming object-referent mappings. However, evidence from naturalistic IDS is currently lacking; Nygaard et al.’s (Reference Nygaard, Herold and Namy2009) analysis measured size sound symbolism in the prosody of IDS-STYLE speech, but this was not naturalistic speech to infants (i.e., the speakers were not actually addressing infants at the time of recording). Given that infants are able to map pitch with size changes from an early age (Fernández-Prieto et al., Reference Fernández-Prieto, Navarra and Pons2015), they may also draw on size sound symbolism to establish form-meaning mappings from the early input, if this information is available to them. Building on previous evidence from adult-directed (Perlman et al., Reference Perlman, Clark and Johansson Falck2015) and IDS-style (Nygaard et al., Reference Nygaard, Herold and Namy2009) speech, we establish the extent to which these iconic prosodic mappings are present in the early input.
Existing research shows that pitch is an important feature in infant-directed speech, and that it may support early word learning. For example, Fernald and Mazzie (Reference Fernald and Mazzie1991) show that mothers used higher pitch and wider pitch excursions and contour when producing target words (all nouns) in a picture book-reading task with their 14-month-olds, significantly more so than when doing the same task with other adults. This is thought to attract the child’s attention and highlight new information or words (e.g., Cooper et al., Reference Cooper, Abraham, Berman and Staska1997; Fernald & Kuhl, Reference Fernald and Kuhl1987; Segal & Newman, Reference Segal and Newman2015). Given that infants are sensitive to pitch-size correspondences, caregivers may use pitch as a means of encoding sound symbolic correspondences to index information about a referent in speech directed to their infants – specifically, using higher pitch to refer to smaller objects, and lower pitch to refer to larger objects. Analysing caregivers’ use of pitch in this way is the first step in interrogating how sound symbolism might support language learning more broadly in the early stages of development.
In planning a study of this kind, our aim should be to elicit IDS that is as natural and un-self-conscious as possible. Using a naturalistic corpus may resolve the issue of the mothers responding to what they perceive to be the demands of the task, and enhancing the sound symbolic cues in their speech. However, such corpora do not allow for much control over the relative sizes of the items being spoken about. Conversely, eliciting IDS in an experiment allows for better control of the different variables under investigation, but risks revealing to the participating mothers the issue that is at the heart of the investigation – size – and thus leading them to produce cues which they would not produce in more naturalistic situations. In this study, we address the question of whether mothers use cues to denote size sound symbolism in naturalistic speech to their infants. We measure the pitch of mothers’ IDS when referring to small vs. large objects to assess the encoding of sound symbolic information in relation to object size in IDS. Crucially, the presence of toys and pictures or picture books in the home means that babies and children often learn object labels for small items that represent large real-world objects (e.g., a toy elephant or bus are small objects representing large real-world items). If size sound symbolism is represented in mothers’ naturalistic speech, it is unclear whether this will encode the actual object size, or the real-world object size. Here we manipulate the salience of the object’s size by either violating expectations regarding objects’ relative size (e.g., a big spoon vs. a small bus) or not. We test the presence of sound symbolic pitch information in IDS across three experimental paradigms, with varying degrees of adherence to expectations regarding relative object sizes (congruent or reversed) and varying degrees of transparency regarding size being the focus of the study (non-transparent, moderately transparent, highly transparent).
By testing across three levels of transparency, we see to what degree sound symbolic cues might be task dependent. In both Perlman et al.’s (Reference Perlman, Clark and Johansson Falck2015) and Nygaard et al.’s (Reference Nygaard, Herold and Namy2009) experimental procedures, size was made salient to speakers through use of adjectives such as ‘huge’ and ‘little’. We ask whether, when participants are less aware of the focus of the investigation being a certain contrastive feature (in this case, size), they will still highlight that same feature in their speech. We use a relatively natural mother-child interactional context, that of book reading in the home, as a relatively ecologically-valid situation. This allows us to question the extent to which the sound symbolism bootstrapping hypothesis – specifically, the encoding of object size through changes in pitch – can be generalised to naturalistic language learning, across a single population. If task transparency is a factor that needs to be taken into account, as we suspect it is, then future research into these issues will need to analyse naturalistic speech corpora for such cues. In the current study, we draw on three experimental paradigms which vary in the degree to which size as a dimension of relevance is made salient to the participants. We address the following three research questions:
-
1) Do mothers encode size sound symbolic properties – that is, higher pitch when referring to smaller objects, and lower pitch when referring to larger objects – in speech addressed to their infants?
-
2) Does size expectation of the object in question affect this sound symbolic encoding? More specifically, when size expectation is violated, is the use of pitch made more or less distinctive?
-
3) Does the effect differ according to the transparency of the paradigm in question?
Following assumptions made by the sound symbolism bootstrapping hypothesis (Imai & Kita, Reference Imai and Kita2014), we expect that mothers will produce a higher pitch in reference to smaller objects, relative to their baseline pitch, and a lower pitch (relative to baseline) in reference to larger objects. However, we have no a priori hypotheses about the size of this effect when expectations regarding relative size are violated: for example, a very small bus (expected large item) may be referred to with a particularly high pitch when presented alongside a large spoon (expected small item) to denote its smallness. On the other hand, in the same situation the word bus may be produced with a particularly low pitch to reflect the expected largeness of the item in the real world. Finally, we expect that transparency will positively affect these pitch differences, in line with the explicitness of the perceptual contrasts presented: we predict that the effect will be largest in the most transparent paradigm (Paradigm 3, see below), where object size differences will be made most explicit. Through testing these hypotheses, our results will contribute to our understanding of size sound symbolism, and how this might support word learning in a naturalistic setting. This will set the stage for future analyses into other aspects of sound symbolism in the early input, such as object shape, texture, and other relevant properties.
Method
Participants
We recruited participants from across the UK through social media. The recruitment ads targeted infants aged between 1;2 and 1;4; this age was chosen to capture mothers’ infant-directed speech during the early period of lexical acquisition. All recruited infants were acquiring British English as their first and only language, and their mothers spoke British English as their only language. The children had no known speech or hearing difficulties. We know of no prior studies that have investigated the impact of expectedness and task transparency on size-based pitch productions. This made determining a reasonable sample size somewhat difficult, as no estimates of expected effect size could be calculated. Within a frequentist framework, a moderate effect (Cohen’s d=0.5, p<0.05) would suggest recruiting 34 participants. Given the Bayesian nature of our proposed analysis (see data analysis section), this estimate served as a useful guideline, though the underlying mechanics differed. To ensure even list sampling, we planned to include 32 participants, in order to counterbalance across stimuli. To achieve this number, we collected data from 40 participants to allow for exclusions due to fussiness, participant error (mothers not following instructions) or experiment error. Our final sample included 40 participants, though this includes one participant for whom we had no analysable data in our final task (see below).
Procedure
The full procedure consisted of three separate paradigms, varying in their transparency, i.e., in the degree to which they guided the participants towards a comparison between two objects, and in the degree to which this comparison centred on size. Each paradigm is detailed in turn below. Paradigm 1 was delivered using a poster, and Paradigms 2 and 3 were delivered using a wordless book (one for each paradigm). Mothers were first asked to talk to their child about a photo in the form of a poster (Paradigm 1). Following that, they talked them through two wordless spiral-bound books (Paradigms 2 and 3). Each paradigm involved images of 16 toys. Mothers were instructed to talk about the toys in the photos in any way they wished, and to name all the toys as they did so. The books and poster were sealed with a sticker, so that mothers did not leaf through or open them before actually talking through them to their child. They audio-recorded themselves on their phones and sent us the recording.
Paradigm 1 (least transparent; poster): the mother looked at an A3 poster featuring a photo of toys seemingly randomly spread on a carpet. The toys were not organised in pairs so that size comparison (or any type of comparison) was not highlighted. Most items for Paradigm 1 were bought in charity shops, and were of assorted sizes, styles, materials, etc. The aim was to give mothers the impression that the items were haphazardly or randomly assembled, rather than of being intentionally different on any particular feature. For each A3 poster (4 different versions, see Figure 1), the toys were photographed in such a way that there was no obvious ‘top edge’; in this way, assuming that participants would scan the poster from top to bottom, the ‘top’ would differ depending on which way round the participants looked at the poster. This avoided creating a sense of order and perhaps bias in object comparisons.
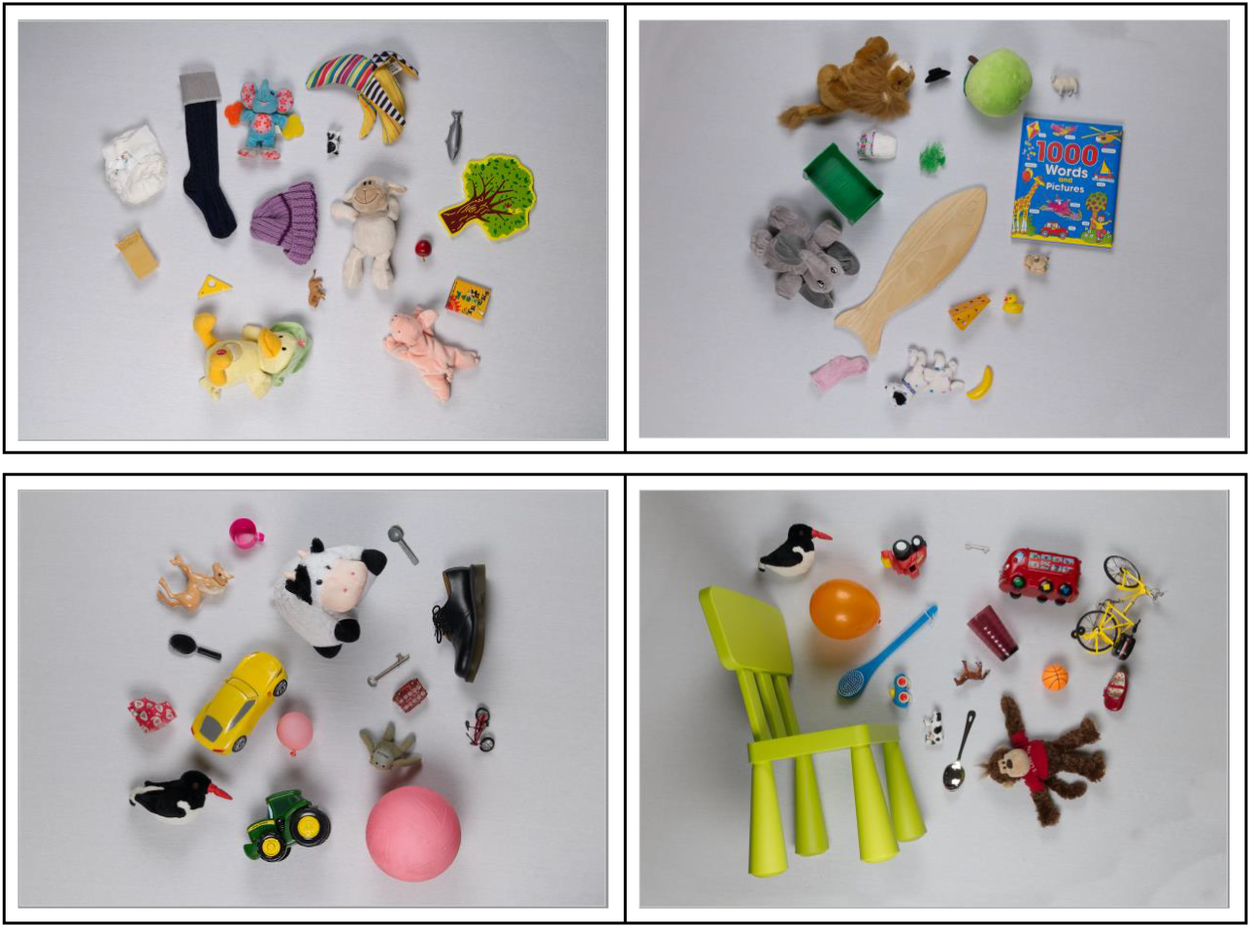
Figure 1. The four posters used in Paradigm 1. Posters 1 and 2 (left and right on top row, respectively) feature the same referents, with a small exemplar in one of those posters and a big one in the other. The same applies for Posters 3 and 4 (left and right on bottom row, respectively), so that e.g., there is a big monkey and a small ball in Poster 4 and a small monkey and a big ball in Poster 3.
Paradigm 2 (moderately transparent; book): Each page featured a photo of a pair of toys or household items (e.g., tree and fish). Although the toys in this paradigm were organised in pairs, the task did not explicitly highlight size comparison. Most items for Paradigm 2 were bought, like those for Paradigm 1, in charity shops. We created books with 4 different sets of different item pairs; in half of these books item A was small and item B was big, and in the other half item A was big and item B was small (see Table 1 and Figure 2). Within each of those versions, in half of the books the big item in the pair was on the left and the small on the right and in the other half the sides were reversed. In total there were 8 different books for this paradigm. We created 4 copies of each of the 8 books (based on the four sets presented in Table 1); the order of items in each book was presented in a randomized order such that no two books were the same. Mothers were asked to read through the books from start to finish. The items differed in actual size and in expected relative sizes. Thus, for each pair of items, e.g., fish and tree, some mothers saw a small fish and a big tree (where relative size was congruent with expectations based on real-life experience) and some saw a big fish and a small tree (incongruent with expectations). The big item (e.g., fish) was on the left and the small (e.g., tree) on the right in half the books and their order was reversed in the other half. We attached a ribbon to each book, and asked mothers to use this as a ‘bookmark’ if they had to pause the task halfway through. This ensured that all mothers went through the book in full, and in the correct order.
Table 1. Categorisation of pairs by size congruence for Paradigms 1 and 2
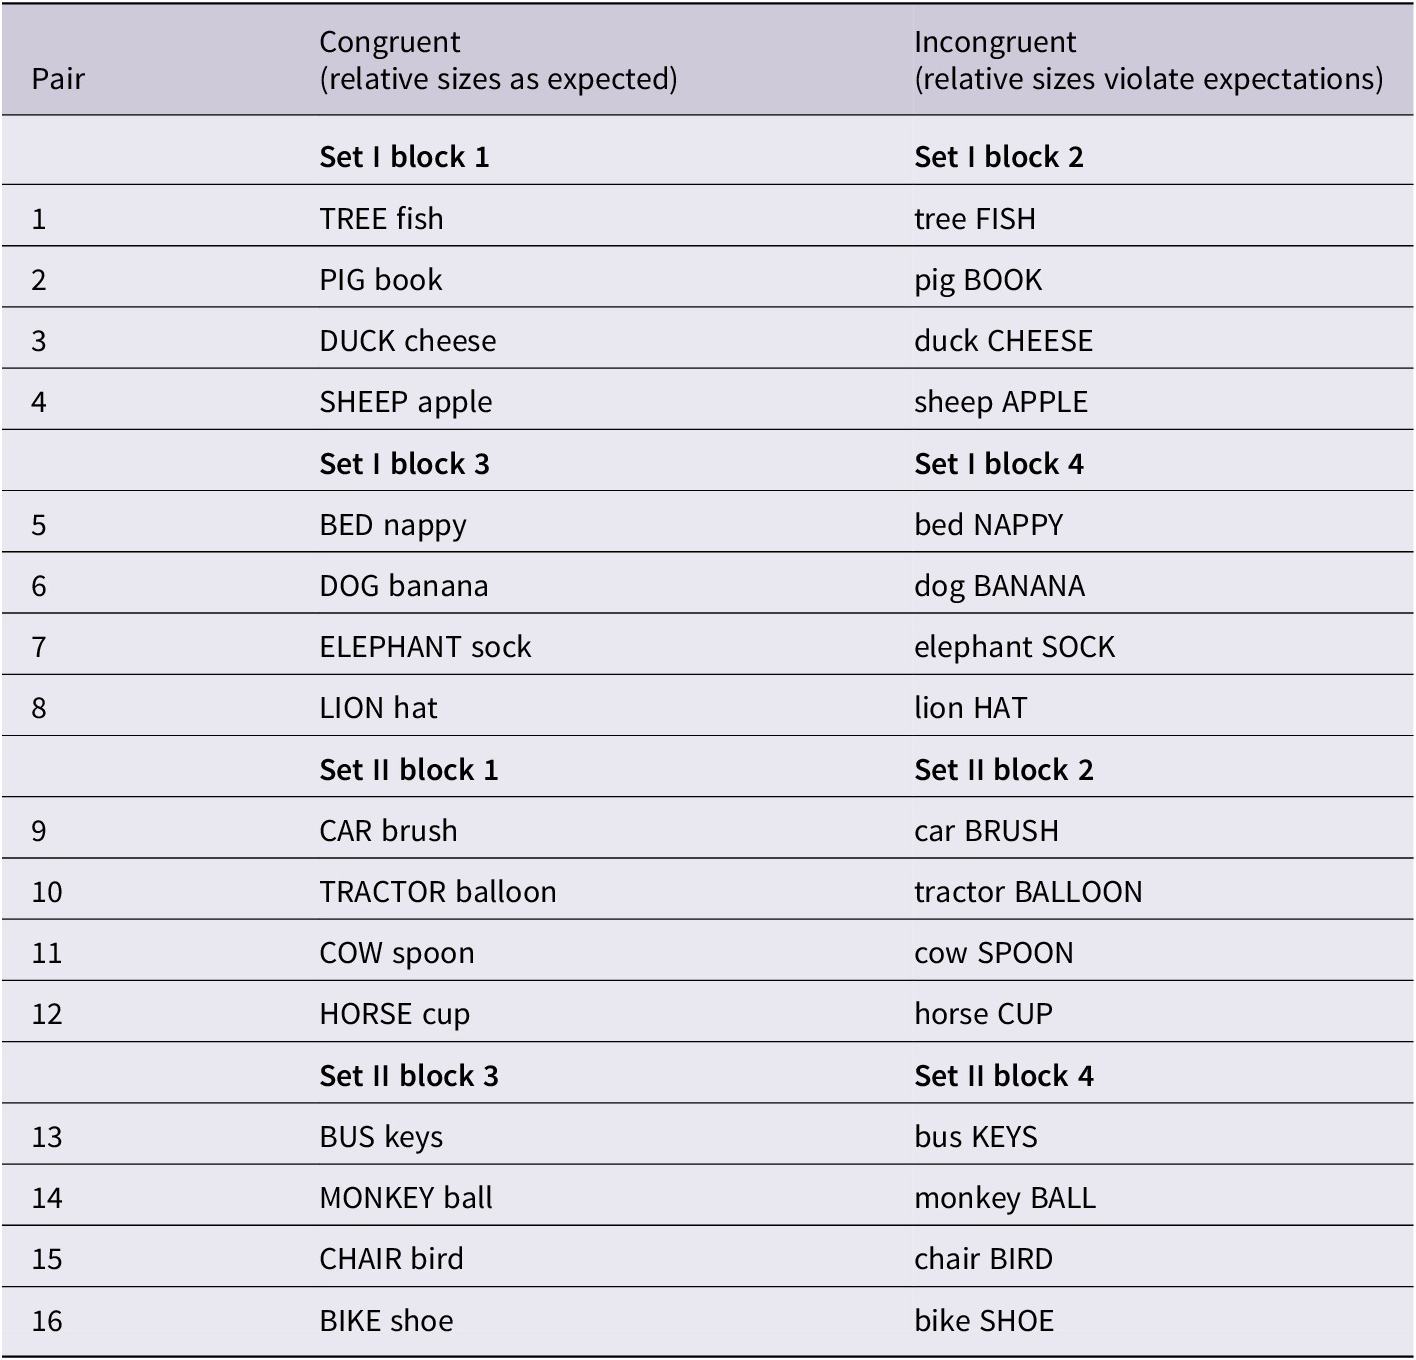
CAPS signify the larger item in the pair. Note, that in the printed books, the side each item appeared on within each set/block combination was counterbalanced, right in half the books and left in the other half.
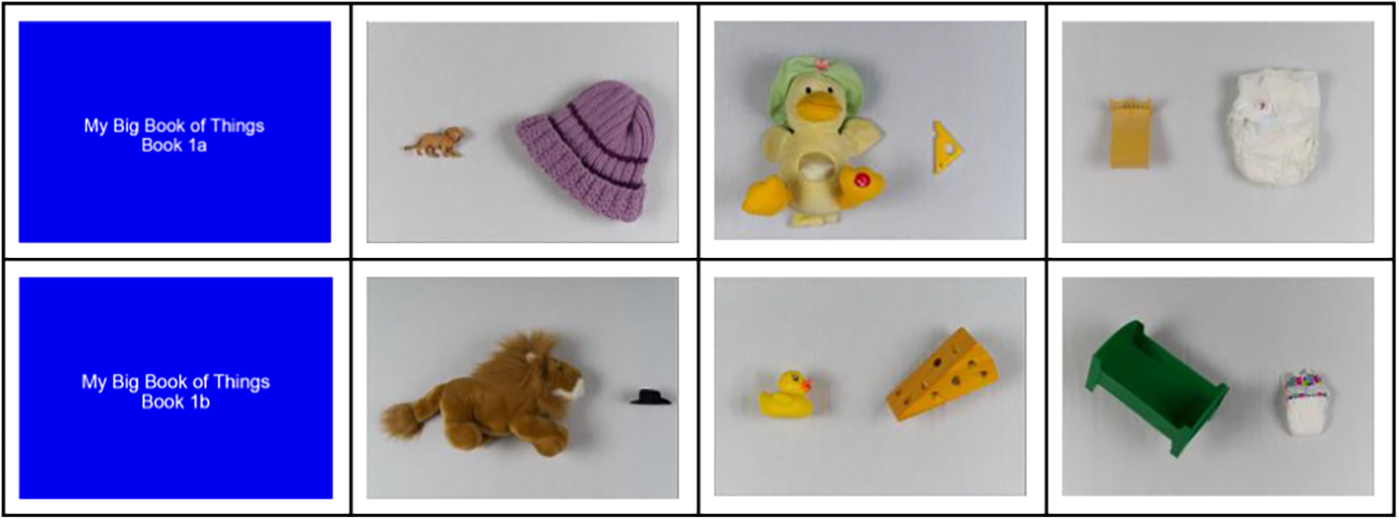
Figure 2. Examples of two of the books used in Paradigm 2. Book 1a (top row) and Book 1ar (not shown) features the same objects with their side on the page reversed (so that the small lion in book 1a was to the left of the big hat and in book 1ar it was to its right), and similarly for Book 1b and Book 1br. Books 1a and 1b (bottom row) feature the same referents paired in the same way (see Table 1), but with their relative size reversed, so that Book 1a features a small bed next to a big nappy and Book 1b features a big bed next to a small nappy.
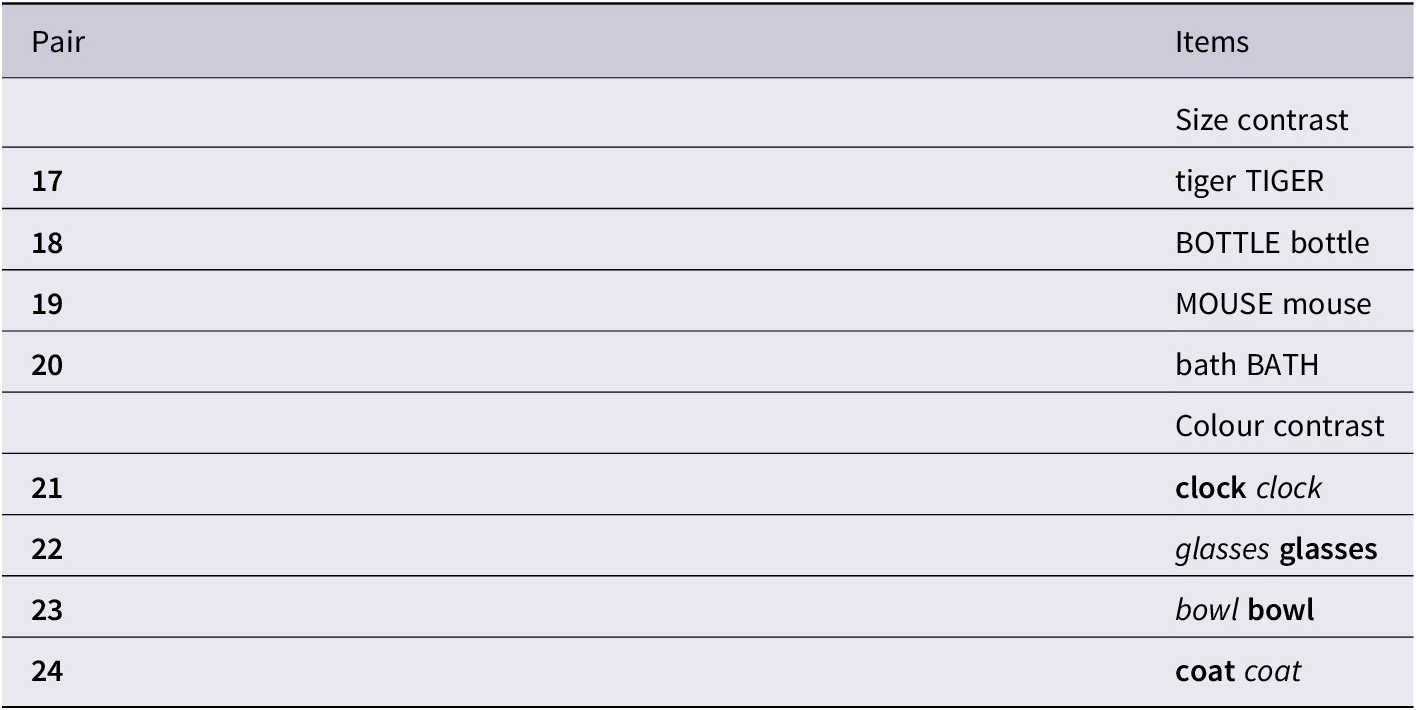
Paradigm 3 (most transparent; book): Each page featured a pair of toys that were identical apart from their size (e.g., small and large toy mice) or colour (e.g., green and yellow bowls) (see Figure 3). Colour difference served as a control to compare with the size difference condition.Footnote 3 This condition highlighted the contrastive features of the identical objects, so that relative size (or colour) was obvious. The items used for this paradigm were newly bought, and were bought with the intention that the items in each pair be as identical as possible on all other features but the highlighted one (colour or size). There were two versions of this book, so that for each item pair, e.g., mouse, half the books had the big item on the left and the small item on the right, and half featured them in the reverse order. Each book had two pairs with the big item on the left and two with it on the right, two pairs with the yellow item on the left and two with it on the right. As in Paradigm 2, order of presentation of item pairs was randomized such that no two books were the same, and a bookmark was attached to this book to ensure the task was completed as expected.
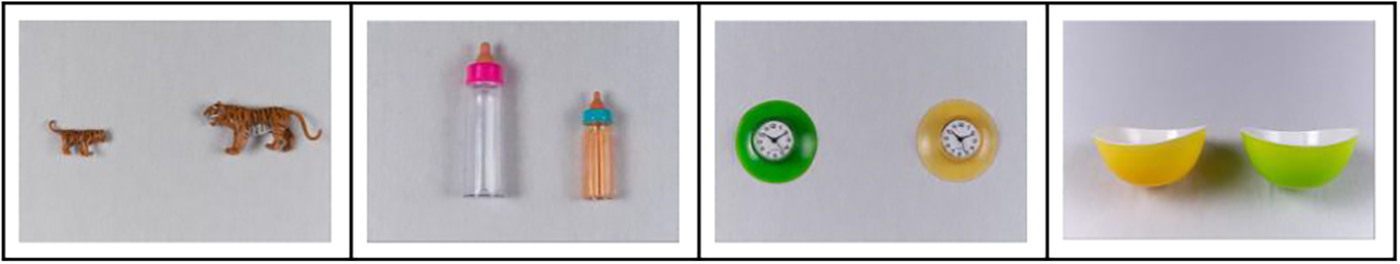
Figure 3. Examples of pages from Book 2 (Book 2r, not shown, contained the same objects with their sides on the page reversed). The two pages on the left show identical objects differing in size. The two objects on the right show identical objects differing in colour.
Stimuli
The words that were used as stimuli were chosen based on parental questionnaires (a modified version of the Oxford CDI – Hamilton et al., Reference Hamilton, Plunkett and Schafer2000). We used CDI response data from a previous longitudinal study with 18-months-olds (DePaolis et al., Reference DePaolis, Keren-Portnoy and Vihman2016, n=59). We chose only clearly imageable items. All the words chosen were marked as understood and/or produced by at least 30 children (out of 59) by 18 months, suggesting that the 14-16-month-olds in our study were in the process of acquiring these items.Footnote 4 Stimuli for Paradigms 1 and 2 are listed in Table 1 and those for Paradigm 3 are listed in Table 2. All stimuli can be viewed on the project’s OSF repository at https://osf.io/gxwqj/.
Table 2. Pairs of toys used in Paradigm 3. CAPs signify the larger item in the pair. Italics and bold signify different colours.
Set I and Set II toys (see Table 1) were counterbalanced between different dyads, to avoid item-repetition (or familiarity) effects. Half the dyads received Set I in Paradigm 1 and Set II in Paradigm 2 and half received Set II in Paradigm 1 and Set I in Paradigm 2. Half of the mother-child dyads received blocks 1 and 4 in each set and half received blocks 2 and 3 in each set, thus ensuring that each dyad received 4 congruous and 4 reversed pairs of toys in each paradigm. In order to control for the effect of inherent vowel pitch, the same target words were represented by small objects in Set I and large objects in Set II. In Paradigm 3, the same set of toys was used for all participants; these differed from the toys used in Paradigms 1 and 2, as explained above.
Coding
For each paradigm, the target words were extracted from the audio recording and analysed acoustically using Praat (Boersma & Weenink, Reference Boersma and Weenink2018). The stressed vowels in each of the target words were segmented manually and labelled by a trained RA, and a script was used to automatically measure absolute and relative mean f0 in Hz in the vowels across all conditions. The RA visually checked the f0 measurements to ensure these were extracted accurately by the script (i.e., to look for any artefacts). In addition, the RA carried out a second manual segmentation on 10% of the data 16 weeks later; for all of the re-segmented data, all but two of the new boundaries were within 17 ms of the old onesFootnote 5. This was considered sufficient for the reliability of manual segmentation. For each paradigm, we extracted the first token of each target word produced by each mother. Where the first token was unmeasurable or was a variant of the item that changed the position of the stressed vowel (e.g., hairbrush instead of brush), we took the following token in the mother’s speech. This included instances where f0 could not be measured due to poor sound quality, overlapping speech, or unmeasurable vocal setting (e.g., creaky voice or whisper). Participants who did not produce two usable word pairs in a given condition were excluded from the analysis. If there were no usable tokens for a given item then the item was excluded from the model. This led to 68 excluded tokens overall; 7 additional unusable tokens were replaced with following usable tokens in the mothers’ speech.
Data analysis plan
The analysis plan can be downloaded in R Markdown format from https://osf.io/gxwqj/. Our primary dependent variable of interest was the mean pitch (in Hz) of the stressed vowel in a mother’s first production of the target word. This was z-score transformed by participant; we excluded any observations with z>2.5. Data were analysed using Bayesian linear mixed-effects regression in R. The use of Bayesian mixed effects linear regression had several advantages over frequentist methods in this context. First, these techniques emphasize the distribution over possible effect sizes, rather than simple “yes/no” hypothesis testing. Thus, regardless of the outcome of this experiment, this allows us to discuss the directionality and likelihood of the effect that object size has on pitch excursions in natural production. Second, Bayesian implementations of mixed effects models are virtually guaranteed to converge, allowing us to fit the largest model possible to the data even given a limited number of participants (Barr et al., Reference Barr, Levy, Scheepers and Tily2013; Vasishth et al., Reference Vasishth, Nicenboim, Beckman, Li and Kong2018). Thus we were able to calculate a Bayes-factor for the effect of size over a range of different priors, allowing us to determine the credibility of the null hypothesis. Finally, Bayes-factor analyses make it possible to directly evaluate the probability of the null hypothesis, thereby allowing for a direct evaluation of the existence of a sound-symbolism effect in the data we collected. In all analyses, estimates assumed regularising, weakly informative priors (Gelman et al., Reference Gelman, Simpson and Betancourt2017).
To assess the impact of object size, congruence, and colour, as well as the influence of paradigm on pitch, we fitted three separate models. The first model jointly analysed the results of Paradigms 1 and 2 (which draw from the same set of items), taking paradigm as a sum-coded fixed effect (non-transparent = –1, moderately transparent = 1). In addition, this model included fixed effects for object size (large = –1, small = 1), and real-world congruence (congruent = 1, reversed = –1), as well as all interactions of paradigm, size, and congruence. Random intercepts were fitted for individual participants, items (toy-pairs) and words (individual toys), with random slopes assigned for each of the fixed effects. This model structure treated individual participants, toy-pairs, and words as sources of variance for a given token’s pitch, effectively making these grouping factors “pitch baselines” in the context of the model. The maximal model structure for the joint analysis of Paradigms 1 and 2 is given in (1).
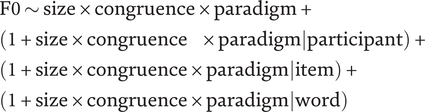 $$ {\displaystyle \begin{array}{l}\mathrm{F}0\sim \mathrm{size}\times \mathrm{congruence}\times \mathrm{paradigm}+\\ {}\Big(1+\mathrm{size}\times \mathrm{congruence}\hskip1em \times \mathrm{paradigm}|\mathrm{participant}\Big)+\\ {}(1+\mathrm{size}\times \mathrm{congruence}\times \mathrm{paradigm}|\mathrm{item})+\\ {}\left(1+\mathrm{size}\times \mathrm{congruence}\times \mathrm{paradigm}|\mathrm{word}\right)\end{array}} $$
Paradigm 3 was modelled separately, as the task and experiment structure were sufficiently different to make direct statistical comparison to Paradigms 1 and 2 impractical. As with the previous model, we model mean F0 (in Hz) of the stressed vowel in the target word as a function of object size (large = –1, small = 1) and colour (yellow = –1, green= 1), assigning random slopes and intercepts by participant, and random intercepts by item.Footnote 6 The model formula is provided in (2).
 $$ \mathrm{F}0\sim \mathrm{size}+\mathrm{colour}+\left(1+\mathrm{size}+\mathrm{colour}|\mathrm{participant}\right)+\left(1|\mathrm{item}\right) $$
Finally, to assess the interaction of object size and task, a third model was fit to data from all three paradigms, taking object size (large = –1, small = 1), paradigm, and their interaction as fixed effects. The three-level factor paradigm was helmert-coded with two contrasts comparing (1) Paradigm 1 with Paradigms 2+3 and (2) Paradigm 1 vs. Paradigm 2 vs. Paradigm 3. The model included both size, and paradigm as main effects, as well as their interaction. Random intercepts were fit to individual participants and words. All random slopes were included on a by-participant basis, but only random slopes for object size were included on a by-word basis, as different words were used in paradigm 3 than in the other two paradigms.Footnote 7 The maximal model is given in (3).
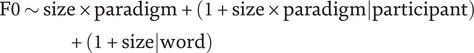 $$ {\displaystyle \begin{array}{c}\mathrm{F}0\sim \mathrm{s}\mathrm{i}\mathrm{z}\mathrm{e}\times \mathrm{p}\mathrm{a}\mathrm{r}\mathrm{a}\mathrm{d}\mathrm{i}\mathrm{g}\mathrm{m}+(1+\mathrm{s}\mathrm{i}\mathrm{z}\mathrm{e}\times \mathrm{p}\mathrm{a}\mathrm{r}\mathrm{a}\mathrm{d}\mathrm{i}\mathrm{g}\mathrm{m}|\mathrm{p}\mathrm{a}\mathrm{r}\mathrm{t}\mathrm{i}\mathrm{c}\mathrm{i}\mathrm{p}\mathrm{a}\mathrm{n}\mathrm{t})\\ {}\hskip-16em +(1+\mathrm{s}\mathrm{i}\mathrm{z}\mathrm{e}|\mathrm{w}\mathrm{o}\mathrm{r}\mathrm{d})\end{array}} $$
Following Vasishth et al. (Reference Vasishth, Nicenboim, Beckman, Li and Kong2018), we assumed that fixed effects whose 95% credible intervals do not overlap with 0 constitute “significant” effects, though “statistical significance” is not the primary aim of Bayesian analyses.
At present, we know of no prior estimates of the true effect of size-sound symbolism on F0. However, we think it is reasonable to believe that the effect of object size should not exceed that of speaker sex (i.e., the average difference between male and female F0 productions). Thus, we took this as the upper bound for an effect of size-sound symbolism. Using corpus data from Whalen and Levitt (Reference Whalen and Levitt1995), we estimated the effect of speaker sex on F0 to be approximately 50 Hz in English (b = -50.46, p<.0001).Footnote 8 Given that the size-sound symbolism hypothesis predicts higher F0 productions for smaller objects, and that our contrast coding treats “small” as positive, only positive estimates for the effect of object size would be compatible with the size-sound hypothesis. Accordingly, we adopted a truncated normal distribution centred at 0 Hz with a standard deviation of 25 Hz as our prior for the effect of object size on F0. This effectively treated 0 Hz as the smallest, and 50 Hz as the largest, credible estimate for the effect of object size. We then compared this model to a model of the null hypothesis (i.e., a model which excluded object size as a predictor) to compute a Bayes Factor. Following common practice, we took a Bayes Factor of less than 1/3 as moderate evidence in favour of the null. To provide evidence of robustness to the choice of prior, we recomputed the Bayes Factor for decreasing standard deviation values until the lowest value which still yielded a Bayes Factor of < 1/3 was identified.
Predicted results
Object size
In all three models, the Sound-symbolism Bootstrapping Hypothesis (Imai & Kita, Reference Imai and Kita2014) predicts a significant main effect of object size, such that smaller objects are produced with higher pitch, and larger objects are produced with lower pitch. This would manifest in our models as an effect of size with a positive slope coefficient. Since Paradigm 3 is testing size contrast directly, we expected to observe an effect of size (higher pitch for smaller objects) but not colour, which functioned here as a control condition.
Congruence
Regarding object congruence with real-world expectations, predictions for Paradigms 1 and 2 vary. It is not clear from the sound symbolism bootstrapping hypothesis whether pitch is always assumed to indicate object size, or only in certain circumstances, e.g., in situations where item size is a salient (e.g., contrastive or surprising) feature. If the inherent relationship between an object and its realisation is a natural reflex of language use, we would not expect the effect of size to vary across tasks, or according to an object’s congruence with the real world.
If pitch excursions associated with sound-symbolic productions are increased in the presence of unexpected stimulus relative sizes (e.g., a small cow presented alongside a large spoon), then congruence might affect the encoding of size through pitch. However, this could be exemplified either as a larger effect or a diminished effect of size on pitch for size-reversed productions.
In our models, this would manifest as a significant interaction of congruence and size. It is possible that the influence of both congruence and size is dependent on task context. Our model accounts for this possibility with the inclusion of the three-way size×congruence×task interaction. We remain agnostic about the likelihood of observing this interaction, but resolve our interpretation using a nested model probing for pair-wise differences between productions of small and large objects within levels of congruence and task.
Task transparency
If the sound-symbol mapping is contextually dependent, and conditioned on specific task context, we expect object size to exert a larger influence on pitch productions in a task where size is made a more salient feature. In our model, this would be realised as a significant size×task interaction. Furthermore, if pitch modulation is influenced by degree of task transparency, we expect to find a significant interaction of size and both of the contrasts defined for task in model (3). That is, we should see a greater effect of pitch in Paradigms 2 and 3 relative to Paradigm 1, and a greater effect in Paradigm 3 relative to Paradigm 2.
Finally, we may find a positive effect for pitch but no task differences in our results. This would lend the strongest support for a sound symbolism bootstrapping effect, as it would suggest that pitch-size correspondences are available in the input independent of task design, and therefore likely to be present in the infants’ day-to-day experience of language.
Results
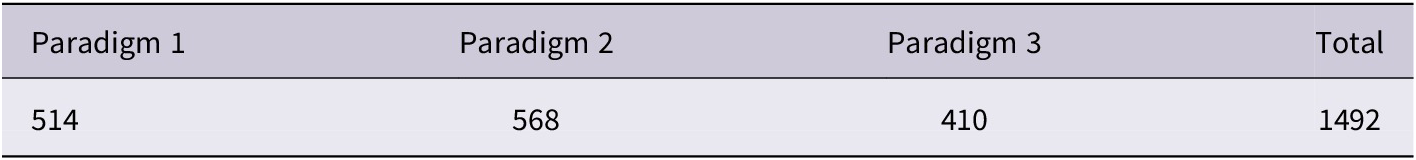
Table 3 summarises the breakdown of observations by paradigm after data cleaning; one participant was missing for Paradigm 3 owing to an error in data collection. A further four participants yielded only two analysable observations each for Paradigm 3. This was due to an unforeseen limitation in this paradigm, in which mothers could replace the label for the two target words in the picture with a plural (e.g., ‘look, tigers!’), or refer to the items ambiguously (e.g., ‘there’s a tiger, and another tiger’), meaning we could not tell whether they were referring to the large or the small item. Prior to analysis, by-participant z-scores were computed for mean F0, and observations with |z|>2.5 were removed (1.4% of the remaining data), as stated above. The overall cleaning of the data resulted in 23.5% missed observations from the total of potential observations. Z-scores were only computed for the purpose of data exclusion. All subsequent analyses were performed on raw mean F0 values assuming an exgaussian linking function.
Table 3. Number of observations by paradigm after data cleaningFootnote 9
To model our results, we fit three Bayesian mixed effect regression models to our data using the brms package in R (Bürkner, Reference Bürkner2017), analysing in turn:
-
• Analysis 1: Data from Paradigms 1 and 2 jointly
-
• Analysis 2: Data from Paradigm 3 alone
-
• Analysis 3: Size-related data from all three paradigms jointly
Our three models were run for 50000 iterations with 5000 burn-in iterations, and assumed an exgaussian linking function. All models assumed a weakly informative prior for the effect of object size: a normal distribution centred on zero with a standard deviation of 25 Hz (i.e., N(0,25)), Footnote Footnote 10 and all other effects were modelled with uniform priors (i.e., the brms default). Here, we take effects for which the 95% credible interval (CI) excludes 0 to be a strong indication of that effect’s likely direction. Subsequent Bayes Factor analyses compared models against a competitor model which excluded the main effect of object size. This serves as a test of whether object size is a good predictor of produced pitch, or whether the null hypothesis should be favoured. Following convention, we take Bayes Factors of <⅓ as moderate evidence favouring the null hypothesis, and those >3 as moderate evidence favouring the alternative hypothesis (i.e., the presence of a true effect of object size). For each reported Bayes Factor, 10 estimates were generated using the bridge_sampler package in R (Gronau et al., Reference Gronau, Sarafoglou, Matzke, Ly, Boehm, Marsman and Steingroever2017).Footnote 11
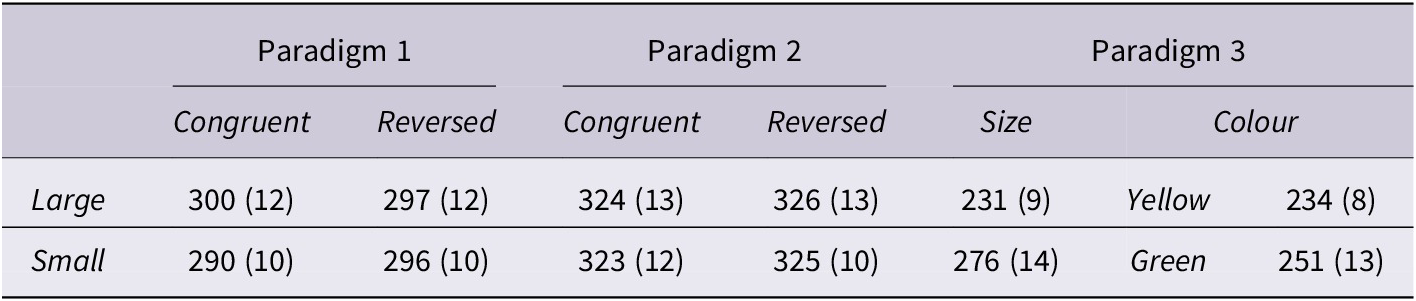
Summary statistics for data in each of the three paradigms are given in Figure 4 and Table 4.
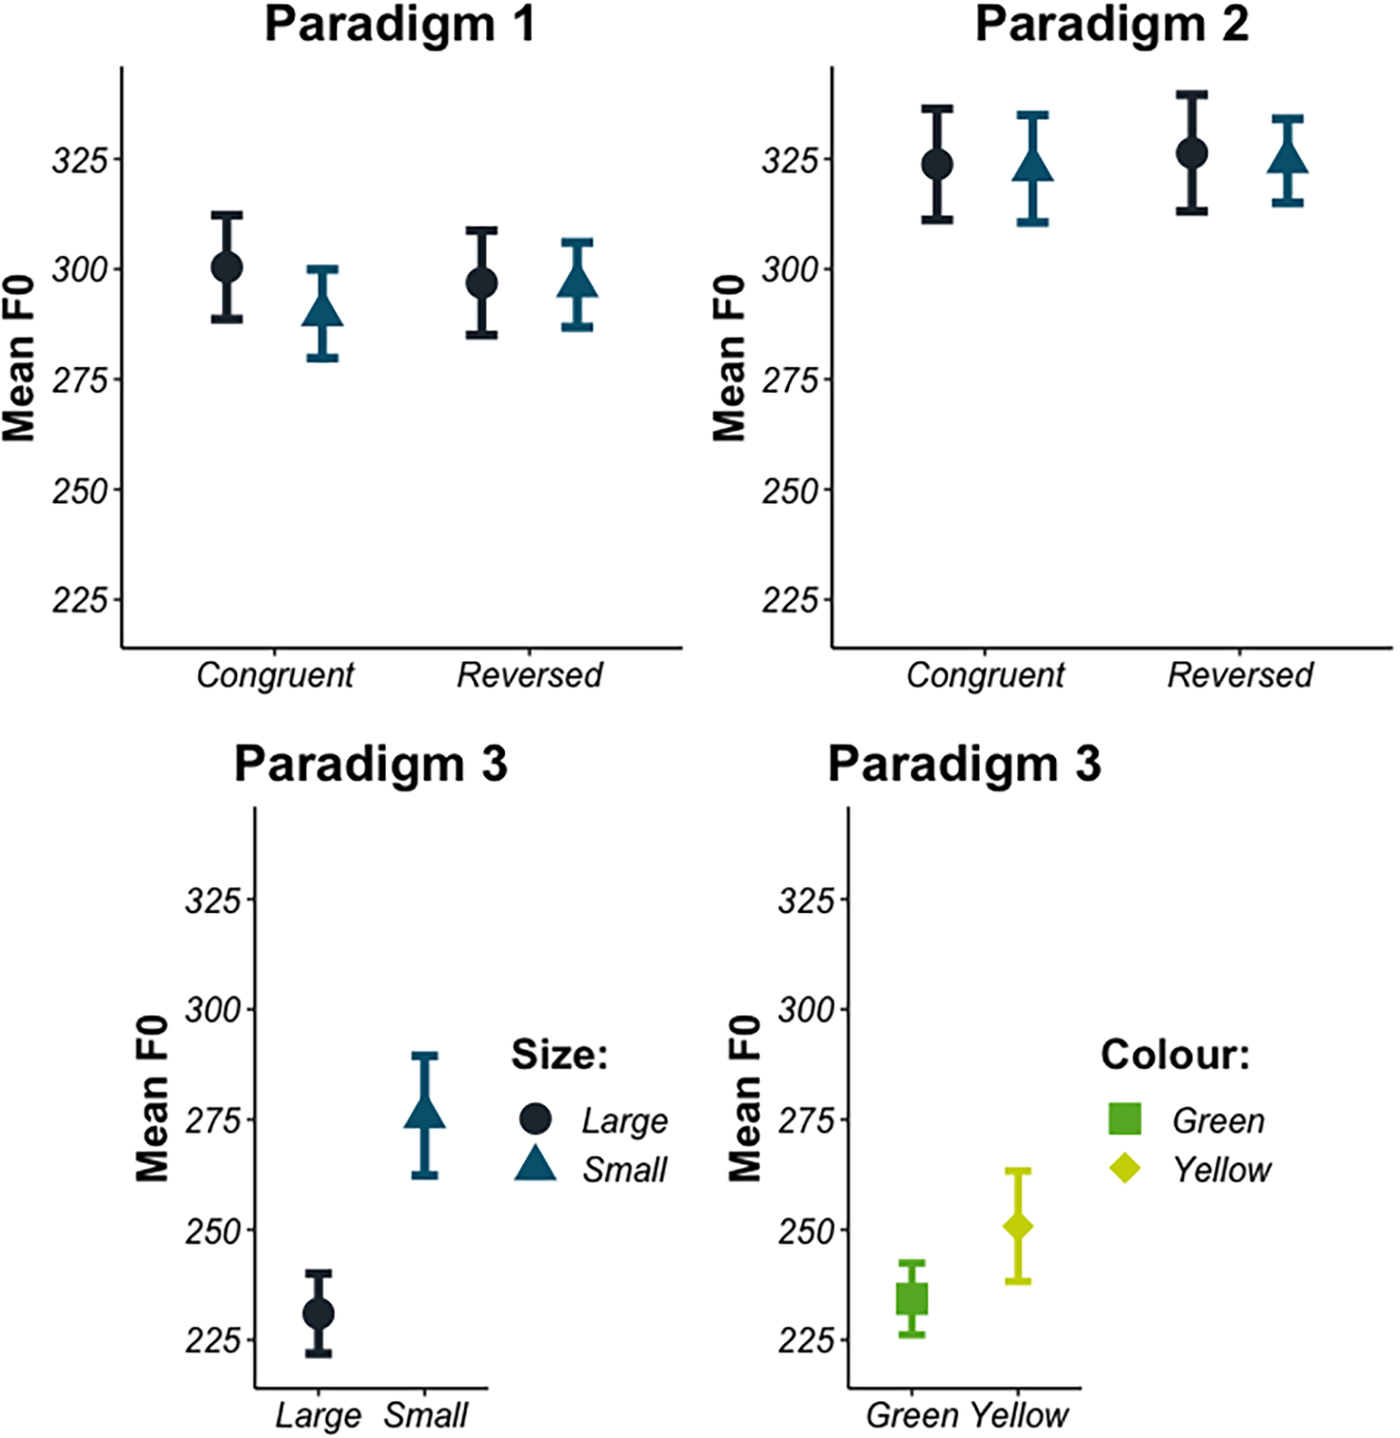
Figure 4. By-participant mean F0 for target words in each of the three paradigms tested. Error bars represent standard error (n=39).
Table 4. Mean(SD) F0 produced by mothers in each paradigm for large and small items, across congruent and incongruent pairings (Paradigms 1 and 2) and including green and yellow colour contrasts (Paradigm 3)
Analysis 1: Size, congruence, and transparency (Paradigms 1 and 2)
First we consider the role of object size in relation to real-world congruence and task transparency. Model estimates and 95% CIs are given in Table 5. These findings indicate no credible effect of size (β=–3.49 [-11.93, 4.96]) or congruence (β=3.07, [-3.84, 9.90]), and no credible interaction between these two factors (β=2.20, [-8.77, 13.14]). There was a credible positive effect of paradigm (β=10.85, [2.74, 19.04]), indicating higher F0 productions in Paradigm 2 than in Paradigm 1. However, no subsequent interactions of paradigm with the other factors reached the level of credibility (i.e., all 95% CIs included 0 for every other effect). The estimated Bayes Factor of 0.12 suggests moderate evidence favouring the null hypothesis. That is, these data provide credible evidence that object size did not exert a meaningful influence on F0 assuming a moderately informative prior (i.e., that the effect should likely be between -50 and 50 Hz). Overall, Analysis 1 does not find compelling evidence of a size-sound symbolism effect in mothers’ productions of child-directed speech: object size did not credibly modulate the F0 values of object-denoting productions and this effect did not interact with real-world expectations about object size. It also did not interact with the transparency of the task (i.e., presentation of different-sized objects in an array vs. in pairs). However, consistent with our expectations regarding task transparency, we did find a main effect of paradigm on F0, indicating that mothers produced higher pitched productions in Paradigm 2 than they did in Paradigm 1.
Table 5. Model estimates and 95% credible intervals for the effects of object size, real-world congruence, and paradigm, and their interactions, in Paradigms 1 and 2
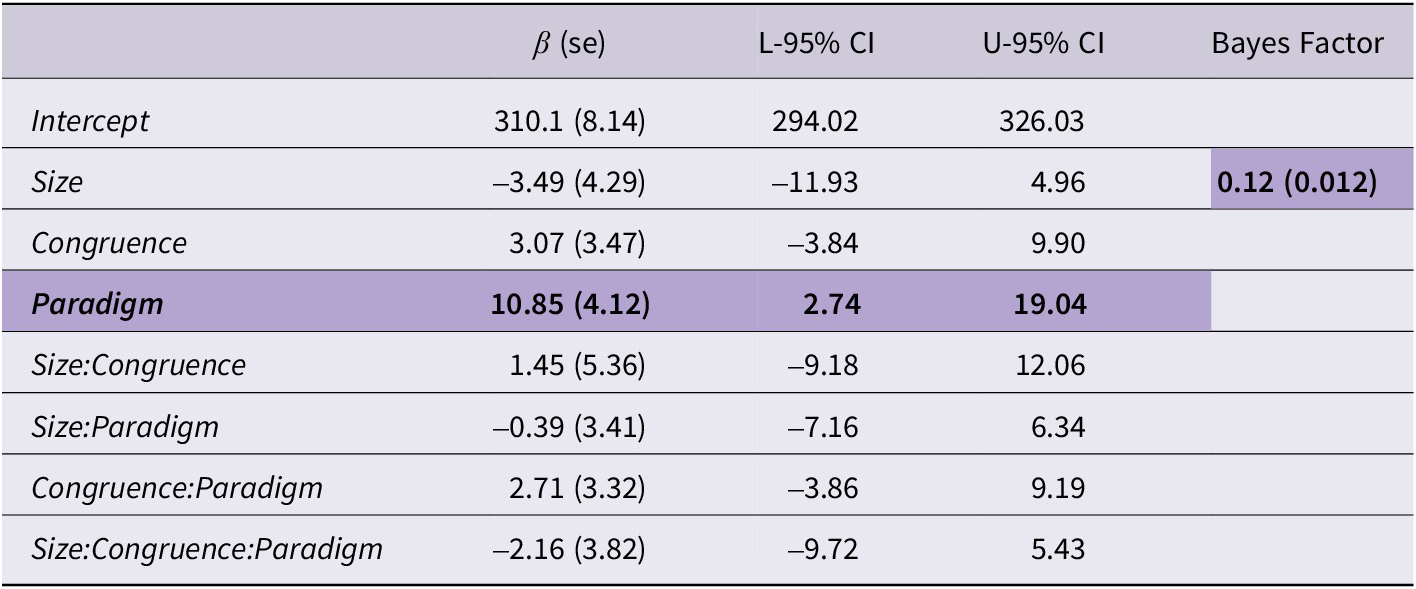
95% credible intervals which did not include zero are shaded, as are Bayes Factors <⅓ favouring the null hypothesis.
Analysis 2: Size vs. colour (Paradigm 3)
In Analysis 2 we consider the effect of object size (test condition) and colour (control condition) on F0 across object pairs that are identical except for their colour or size; that is, the object size/colour contrast is made clear to the speaker.
Model estimates and 95% CIs are given in Table 6. These findings indicate a credible effect of object size (β=12.79, [2.35; 23.88]), suggesting higher F0 for small objects than large objects. There was no credible effect of object colour (β=–1.27, [-10.61; 8.05]). The estimated Bayes Factor of 3.83 presents moderate evidence favouring the alternative hypothesis. This suggests that, in Paradigm 3 at least, we have evidence to believe that object size influenced pitch productions.
Table 6. Model estimates and 95% credible intervals for the effects of object size and colour in Paradigm 3
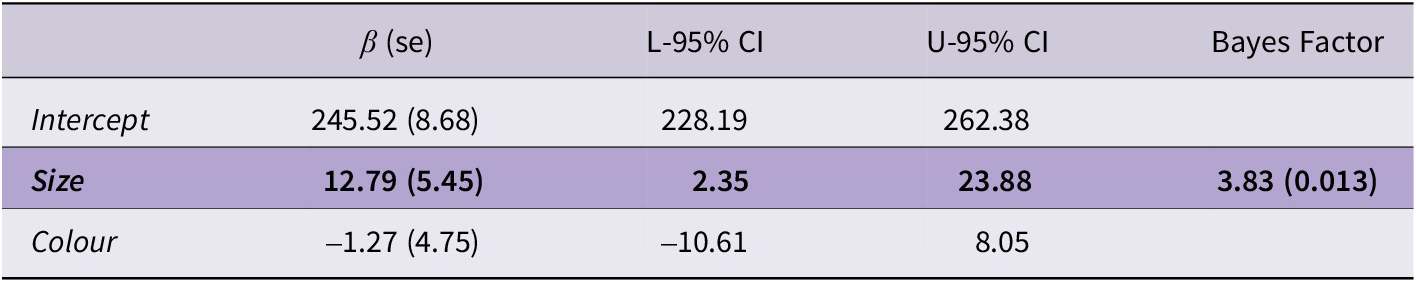
95% credible intervals which did not include zero are shaded, as are Bayes Factors >3 favouring the alternative hypothesis.
Analysis 2 suggests that object size may influence mothers’ pitch productions in some situations. We find an effect of around 13 Hz (corresponding to approximately a 26 Hz difference between large and small object productions). Notably, this effect was absent in Paradigms 1 and 2. Despite the descriptive statistics, object colour did not exert a credible influence on pitch in this study. This is to be expected if object size is sound-symbolically related to pitch, but object colour is not.
Analysis 3: Object size across three paradigms
Finally, we considered the overall effect of size, and its interaction with task transparency, by looking at the interaction of size and paradigm in all three data sets.
Model estimates and 95% CIs are given in Table 7. These findings indicate a credible difference between Paradigm 2 and 3, such that Paradigm 2 had higher F0 productions than Paradigm 3 (β=32.25, [18.58; 46.20]). However, there is no credible effect of size present across all three paradigms (β=2.61, [-3.58, 8.76]). There is an interaction of size and the second paradigm contrast (β=–8.55, [-18.09, 0.83]), but we cannot confidently conclude that this effect is negative.
Table 7. Model estimates and 95% credible intervals for the effects of object size, paradigm, and their interaction in all three paradigms
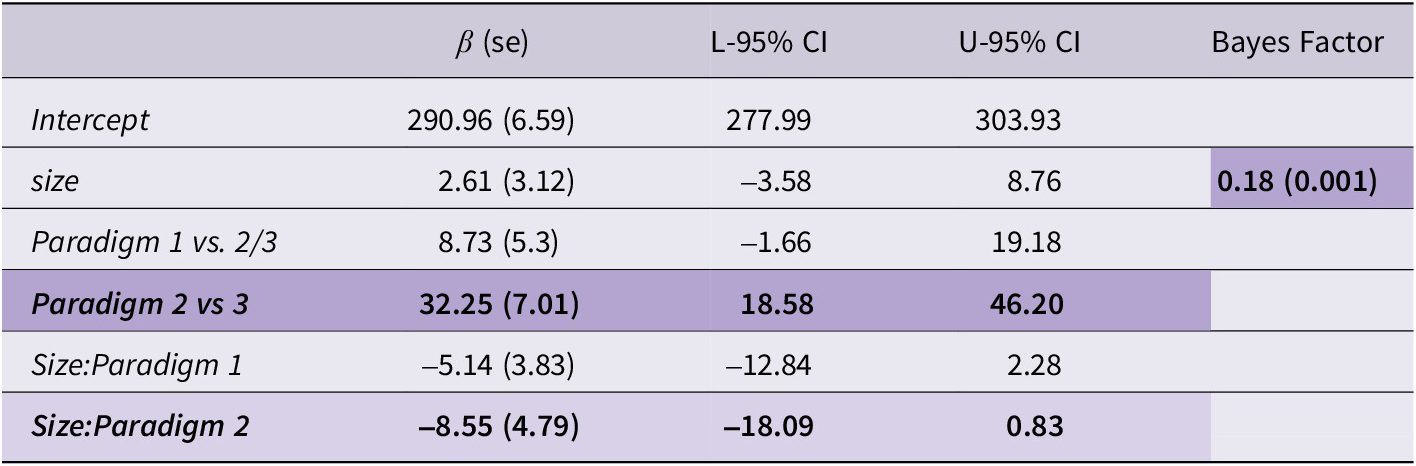
95% credible intervals which did not include zero are shaded, as are Bayes Factors <⅓ favouring the null hypothesis. Lighter shading denotes effects with a lower degree of credibility (i.e., including zero, but only just).
The estimated Bayes Factor of 0.18 provides moderate evidence favouring the null hypothesis, even when including data from all three paradigms where we know that at least one paradigm can produce a size-driven effect. Overall, Analysis 3 largely corroborates the findings of Analyses 1 and 2; to the extent that an effect of object size on pitch exists, it is most clearly observable in Paradigm 3. However, this evidence critically depends on the choice of prior, an issue dealt with in the extended Bayes Factor analysis below.
Extended Bayes Factor analysis of Model 3
Given that the computation of Bayes Factors is sensitive to the choice of prior distribution, we fit several alternative models to assess the sensitivity of our analysis to the choice of prior. These models started from the base model assuming a prior on the effect of size with a mean of 0 Hz and a standard deviation of 25 Hz. This weakly informative prior assumes that, should an effect of object size exist, it most likely lies between -50 Hz and 50 Hz. To assess the robustness of our modelling to this assumption, we then fit a series of models decreasing the assumed standard deviation by increments of 5 Hz, thereby incrementally narrowing the prior. This successively narrowing prior was used assuming (1) a mean of 0 Hz (i.e., the null) and (2) a mean of 12.79 Hz (i.e., the effect measured in Paradigm 3 of our study). Narrow priors represent strong hypotheses about the expected effect, and thus require more evidence to successfully accept the null hypothesis. Consequently, if the effect observed in Paradigm 3 generalises across tasks, we should expect the hypothesis most consistent with that effect to produce the strongest evidence against the null hypothesis. Bayes-factor results for these models are given in Figure 5.
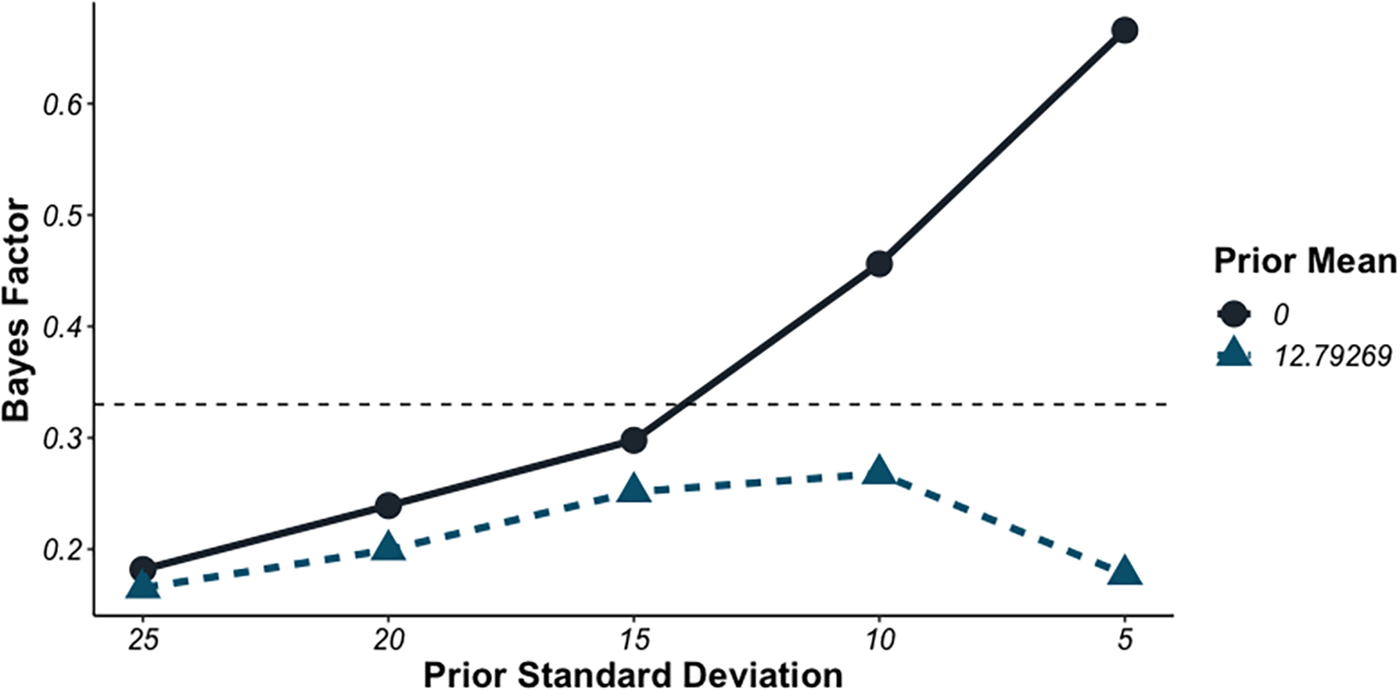
Figure 5. Bayes Factors for models fit to all three tasks assuming a prior with mean of “0” and “12.79” (the measured effect in Paradigm 3). The x-axis represents varying degrees of standard deviation in the prior distribution from highest (25 Hz) to lowest (5 Hz). The horizontal dashed line represents the threshold for preferring the null hypothesis (<⅓). The threshold for preferring the alternative hypothesis is 3.
This extended Bayes Factor Analysis suggests that, when we assume a fairly wide prior (>15 Hz), the location of the effect plays little role in the effect of object size on produced pitch, and all models moderately favour the null hypothesis. With narrower priors (<15 Hz), evidence for the null is weaker if we allow that the effect of object size may be either positive, or negative (i.e., 𝜇=0). However, if we assume that small objects correspond to higher pitches, consistent with the effect estimated for Paradigm 3 (i.e., 𝜇=12.79), even relatively narrow priors suggest that we should prefer the null hypothesis. In sum, these data provide consistent evidence that object size exerts at most a very weak (<20 Hz) effect on pitch, and even then only in a subset of task paradigms.
Discussion
We set out to test whether mothers encode sound symbolic properties of size in speech addressed to their infants through three object-labelling tasks. By manipulating pitch size, size expectation and task transparency, we aimed to capture the reality of size sound symbolism in mothers’ speech to their infants across a range of contexts. According to the sound symbolism bootstrapping hypothesis (Imai & Kita, Reference Imai and Kita2014) and previous experimental work in this area (Fernández-Prieto et al., Reference Fernández-Prieto, Navarra and Pons2015; Peña et al., Reference Peña, Mehler and Nespor2011), we expected that mothers would produce labels for smaller objects with a higher pitch, and a lower pitch for larger objects. However, while our results were mixed, overall they did not support this hypothesis.
We first asked whether or not mothers’ speech to their infants encoded the sound symbolic properties reported elsewhere in the literature (Fernández-Prieto et al., Reference Fernández-Prieto, Navarra and Pons2015; Peña et al., Reference Peña, Mehler and Nespor2011), assumed to be a key aspect of early word learning according to the sound symbolism bootstrapping hypothesis (Imai & Kita, Reference Imai and Kita2014). However, in our analyses, the presence of size-sound symbolism in mothers’ infant-directed speech was non-existent in contexts where size differences were not made salient (i.e., in Paradigms 1 and 2). The effect was present in the most transparent task, where the contrast between object size was made explicit, though this effect was relatively small. Our estimated effect in Paradigm 3 was ~26 Hz, approximately half the size of sex-based differences in F0. The lack of an effect in two of the three contexts suggests that this may not be a useful cue in word learning.
We also asked whether expectations regarding relative object sizes (congruent vs. incongruent) affected any sound symbolic encoding. That is, when an object is larger than another in the real world (e.g., a prototypical tree is larger than a prototypical fish) and these relative sizes are either maintained in the labelling situation (e.g., a large tree vs. a small fish) or reversed (e.g., a large fish vs. a small tree), is the effect of sound symbolism made more or less clear? No effect of congruence was found in our data; mothers produced labels for both congruent and incongruent object sizes at a similar pitch, and this was true for both small and large items. Overall, neither expected object size nor actual object size affected mothers’ pitch when labelling randomly-placed different-sized objects (Paradigm 1) or object pairs that were selected for congruent or incongruent size contrasts (Paradigm 2). Following on from our first finding, this result shows that mothers don’t encode surprising (or unsurprising) size differences in their speech to children.
Finally, we tested whether the transparency of the task affected mothers’ labelling of small versus large objects. We expected that more obvious size contrasts would lead to a clearer effect of sound symbolism, and this was found to be the case: there were meaningful F0 differences observed across the three tasks, and the sound symbolic pitch~size correspondence was strongest when the size contrast was most transparent (Paradigm 3). Furthermore, regardless of object size, meaningful differences were observed between the F0 produced in all three tasks: Paradigm 3 had the lowest mean pitch overall, followed by Paradigm 1; mothers’ pitch in Paradigm 2 was significantly higher than in Paradigm 1. We discuss this finding further below. Overall, when considering all three paradigms in the same model (Analysis 3), there was no credible effect of object size on F0, and a Bayes factor analysis suggests that we should prefer the null model which excludes size as a meaningful predictor. Overall, no model showed a preference for the alternative model, and all models (excepting those with mean of 0 and a very small variance) favoured the null model.
These results leave us with some questions and considerations regarding the role of sound symbolism – specifically, size sound symbolism reflected in features of pitch – in early word learning. Firstly, while previous studies have shown that infants are sensitive to pitch-size correspondences even in very early infancy, the fact that these correspondences are not directly represented in mothers’ speech may mean that they do not play a role in infants’ learning of form-meaning correspondences relevant to size. Given that evidence shows infants to be sensitive to these cues from as early as four months of age (Peña et al., Reference Peña, Mehler and Nespor2011), there may be a natural predisposition to size-sound correspondences, or – in our view more likely – they may be derived from multimodal cues that are available to infants even very early on in development; for example, the correspondence between high-pitched sounds and narrower lip opening or smaller vocal tract size (Ohala, Reference Ohala1984; see also Maurer et al., Reference Maurer, Pathman and Mondloch2006; Ramachandran & Hubbard, Reference Ramachandran and Hubbard2001; Sidhu & Pexman, Reference Sidhu and Pexman2018). While infants’ sensitivity to these correspondences is compelling, the fact that they are not necessarily available in the early input indicates that their contribution may be limited in terms of word learning, at least among English-acquiring infants.
In our study, we only analysed the pitch of object labels (i.e., concrete nouns) produced by the mothers. We chose to focus on noun labelling because nouns are an early-acquired word class, at least among English-learning infants (Frank et al., Reference Frank, Braginsky, Yurovsky and Marchman2021). However, it may have been the case that mothers were using adjectives to describe the objects, and those may have been produced at higher/lower pitch depending on the object’s size and/or congruence with real-world expectation. That is, our findings may not have fully captured the nature of size sound symbolism in infant-directed speech. Indeed, recent research shows that – independent of pitch – English adjectives systematically encode properties of size in their phonological properties, such that adjectives denoting smallness tend to include high front vowels /i/ and /ɪ/, while adjectives denoting largeness tend to include low back vowels such as /ɑ/ (Winter & Perlman, Reference Winter and Perlman2021). These properties – perhaps combined with high/low pitch contrasts – may be supportive in the eventual acquisition of adjectives, and may also help infants to extract information from the speech stream about a given word, even if that word is not sound symbolically marked for size features itself.
Given the fact that Paradigm 3 was the only one to show an effect of object size, it may be the case, as we predicted, that size was rendered more salient to the speaker in Paradigm 3, since this was the only difference between the object pairs, and was thus more likely to be encoded in the speech signal. While we did not analyse adjectives produced by the mothers, we can report anecdotally that in 51 cases, the mothers did refer to the size of the object in this paradigm – for example, by referring to the ‘big/little bottle’, the ‘mummy/baby tiger’, or using a diminutive such as ‘mousie’. This shows that mothers were aware of, and making contrastive, the size distinctions in the stimuli. However, it may be that size-sound symbolism is a contrastive cue used to differentiate between two different instances of the “same” object. This is a different explanation from our paradigmatic proposal in that it suggests a more selective role for local context than that of highlighting size differences. Given that a small (non-significant) effect was present in the objects that differed only in colour, this effect may reflect a more wholesale speech mechanism whereby pitch changes mark a distinction between two referents when those referents are largely identical.
Overall, mothers’ infant-directed pitch varied substantially based on the task context. In our study, F0 was highest in Paradigm 2, and lowest in Paradigm 3. Given that we only found an effect of object size in Paradigm 3, it is possible that effects of size-sound symbolism are only observable when overall F0 is relatively low, or alternatively, that F0 was lowered to allow a range that produced a high versus low contrast in that paradigm. The between-task pitch differences also warrant discussion. The nature of our study required that the three tasks took place in the same order for all participants, to ensure that the size contrasts were not obvious until Paradigm 3. Because of this, the observed pitch differences may reflect parents’ attempts to hold their infants’ attention at consistent points during the recording period. This can explain the increase in pitch between Paradigms 1 and 2, and also the drop between Paradigms 2 and 3: as parents were permitted to pause recording and come back later if infants were distracted or upset, it is possible that we see an attention-getting pitch rise in Paradigm 2 (Nencheva et al., Reference Nencheva, Piazza and Lew-Williams2021; Smith & Trainor, Reference Smith and Trainor2008) and then a lowered pitch in Paradigm 3 as parents returned to the task with their less-distracted infant. This would reflect a feedback loop between parents’ use of pitch features and infants’ attention, as caregivers are known to rapidly adjust their speech as needed in order to capture and hold their infant’s attention (Smith & Trainor, Reference Smith and Trainor2008).
In conclusion, current results do not support the hypothesis that size-sound symbolism is a frequent phenomenon in unstructured child-directed speech. While infants may be sensitive to size~pitch correspondences in natural language, our findings suggest that it is not part and parcel of the input regularly available to the language-developing child.
Acknowledgements
This research was supported by funding from the University of York Research Priming Fund. We also thank Huw Llewelyn-Jones, Eleanor Bray and Emanuela Buizza for their contribution to data preparation, collection and segmentation. The pre-registration of this study can be found at https://osf.io/r2d4c/?view_only=871064a9be134bebb891331c0fba0d5c.
Competing interests
The authors declare none.


 Open access