Hostname: page-component-7bb8b95d7b-495rp Total loading time: 0 Render date: 2024-10-07T07:26:14.912Z Has data issue: false hasContentIssue false

Dynamics of elongated bubbles in slightly inclined pipes with viscous fluids

Published online by Cambridge University Press:  21 December 2023

Alexandre Boucher
Affiliation:
Toulouse Biotechnology Institute (TBI), Université de Toulouse, CNRS, INRAE, INSA, 135 Avenue de Rangueil, 31077 Toulouse cedex 4, France
Joel Karp
Affiliation:
Toulouse Biotechnology Institute (TBI), Université de Toulouse, CNRS, INRAE, INSA, 135 Avenue de Rangueil, 31077 Toulouse cedex 4, France
Roel Belt
Affiliation:
TotalEnergies, Pôle d'Etudes et de Recherche de Lacq (PERL), Pôle Economique 2 - B.P. 47, 64170 Lacq, France
Alain Liné*
Affiliation:
Toulouse Biotechnology Institute (TBI), Université de Toulouse, CNRS, INRAE, INSA, 135 Avenue de Rangueil, 31077 Toulouse cedex 4, France
*
Email address for correspondence: alain.line@insa-toulouse.fr

Abstract

In this work, the relationship between the velocity of an elongated bubble and its shape is investigated, in the case where the elongated bubble flows in a viscous liquid initially at rest in a pipe. The velocity, expressed as a Froude number, depends on the angle of the inclined pipe, the Eötvös number and the buoyancy Reynolds number. The diameter of the pipe and the surface tension being fixed, the Eötvös number remains constant; this study focuses on the dependence of the velocity on the pipe inclination angle and the viscosity of the liquid. The velocity of the elongated bubble was measured for different angles between 0 and 15 degrees and for liquid viscosities 10 to 200 times that of water. As the velocity of elongated bubbles depends closely on their shape, shadowgraphy coupled with particle image velocimetry was used. The results show that the velocity of the elongated bubbles is highly sensitive to the inclination angle of the pipe and to the viscosity of the liquid, particularly for low pipe inclinations and large viscosities. In the layer of liquid located downstream of the elongated bubble, laminar flow develops rapidly in the liquid, resulting from a balance between gravity and friction at the wall. The identification of the position of the stagnation point close to the nose of the elongated bubble and the curvature of the interface at this point helps to explain why the velocity of the elongated bubble decreases for low angles and high viscosities.

Type
JFM Papers
Copyright
© The Author(s), 2023. Published by Cambridge University Press

1. Introduction

The present paper examines elongated bubbles flowing in a tube slightly inclined from the horizontal, initially filled with a viscous fluid at rest. An elongated bubble is generated when liquid is drained out of a pipe at one end; it fills the liquid volume lost during drainage. A simple representation of the elongated bubble is given in figure 1. Gas–liquid gravity currents in a pipeline are thus considered and correspond to phenomena that are encountered in chemical, nuclear and petroleum engineering (for example Séon et al. Reference Séon, Salin, Hulin, Perrin and Hinch2005; Hallez Reference Hallez2007; Séon et al. Reference Séon, Znaien, Salin, Hulin, Hinch and Perrin2007; Znaien, Moisy & Hulin Reference Znaien, Moisy and Hulin2011).

Figure 1. Shape of an elongated gas bubble propagating in an inviscid fluid in a horizontal pipe.

A dimensional analysis (White & Beardmore Reference White and Beardmore1962) shows that the motion of an elongated bubble in a liquid at rest is controlled by the acceleration due to gravity $g$, the pipe diameter $D$, the inclination angle $\theta$, the fluid properties (the gas and liquid densities $\rho _G$ and $\rho _L$, the gas and liquid viscosities $\mu _G$ and $\mu _L$, the surface tension $\sigma$) and the bubble length $l_B$. Since we deal with gravity currents, it is useful to define a Froude number involving the elongated bubble velocity $U_{\infty }$ as a function of 6 independent dimensionless numbers which do not contain $U_{\infty }$. Although the choice of dimensionless numbers is not unique, the following dimensionless form for the elongated bubble velocity $U_\infty$ is proposed:

(1.1)\begin{equation} Fr^2=f\left( Eo, Re_b, \frac{\rho_G}{\rho_L}, \frac{\mu_G}{\mu_L}, \frac{l_B}{D}, \theta \right), \end{equation}

where the dimensionless numbers are defined as

  • the Froude number $Fr^2={U_{\infty }^2 \rho _L}/{gD(\rho _L-\rho _G)}$ accounting for the relative effect of inertia over gravity;

  • the Eötvös number $Eo={g (\rho _L-\rho _G)D^2}/{\sigma }$ evaluating the relative effect of gravity and surface tension;

  • and the Archimedes or buoyancy Reynolds number $Re_{b}=\rho _L^{1/2}(\rho _L-\rho _G)^{1/2} g^{1/2} D^{3/2}/{\mu _L}$, where g is the acceleration due to gravity.

In the case of a gas–liquid system, it is possible to do some simplifications: if $\rho _G \ll \rho _L$ and $\mu _G \ll \mu _L$, then $\rho _G / \rho _L$ and $\mu _G / \mu _L$ are likely to be negligible terms in the expression of the dimensionless bubble velocity. In addition, for sufficiently long bubbles, i.e. $l_B>2 D$, Zukoski (Reference Zukoski1966) showed that the elongated bubble velocity $U_\infty$ does not depend on the bubble length $l_B$. Consequently, only three dimensionless numbers are necessary to describe a elongated bubble in an inclined tube with an angle $\theta$: the Froude number $Fr$, the Eötvös number $Eo$ and buoyancy Reynolds number $Re_{b}$. In this paper, the surface tension as well as the pipe diameter will be maintained fixed. The Eötvös number is thus constant and sufficiently large, so that surface tension effects are of second order compared with gravity. Hence, this study focuses thus on the effect of liquid viscosity and pipe inclination on both the velocity and shape of the elongated bubbles.

In the literature, experimental studies of elongated bubble motion flowing in a stagnant liquid have been carried out by Zukoski (Reference Zukoski1966), Spedding & Nguyen (Reference Spedding and Nguyen1978) and Weber, Alarie & Ryan (Reference Weber, Alarie and Ryan1986) for pipe inclinations ranging from 0 to 90$^\circ$. If the empirical correlation of Bendiksen (Reference Bendiksen1984), improved by Weber et al. (Reference Weber, Alarie and Ryan1986), may be used for the inertia-controlled regime, the influence of both inclination and viscosity is not being properly taken into account. Following Couët & Strumolo (Reference Couët and Strumolo1987), it may be useful to reduce the complexity of the problem to the study of two-dimensional plane flow. Such quasi-plane flows were addressed in Hele-Shaw cells, inclined with respect to the horizontal axis. Brener, Rabaud & Thomé (Reference Brener, Rabaud and Thomé1993) studied the effect of gravity on Saffman–Taylor fingers. It corresponds to a gravity current too, where a viscous fluid is displaced by a less viscous one. In their study, the authors observe significant gravity effects for inclination angles of a few degrees, both on the shape and velocity of the gas fingers; in particular, the velocity increases when the finger broadens. In his study on the motion of isolated bubbles in inclined pipes, Zukoski (Reference Zukoski1966) proposed an extensive experimental work on the velocity $U_\infty$ of elongated bubbles. His paper described the effects of liquid viscosity and surface tension on the bubble velocity. Starting from the horizontal position, Zukoski (Reference Zukoski1966) showed that the elongated bubble velocity increases with pipe inclination to a maximum value (the so-called Boycott effect, Boycott Reference Boycott1920; Acrivos & Herbolzheimer Reference Acrivos and Herbolzheimer1979) and then decreases until the vertical position is reached. For low values of the Eötvös number $Eo = 3.5$, Zukoski observed that the elongated bubbles do not move in horizontal or vertical positions. Bretherton (Reference Bretherton1961) investigated such low Eötvös number situations, and he determined that no motion of elongated bubble occurs for $Eo < 3.37$. However, Zukoski observed also that, at such low values of the Eötvös number $Eo = 3.5$, the elongated bubbles moves in inclined tubes with angles between 20$^\circ$ and 80$^\circ$, which confirms that the motion of the elongated bubble depends on its shape. In this paper, we will focus on elongated bubbles flowing in viscous fluids for very small pipe inclinations.

Benjamin (Reference Benjamin1968) conducted a comprehensive analytical work on the motion of elongated bubbles in an inviscid fluid and a horizontal pipe. The motion of elongated bubbles in a horizontal pipe was analysed in a frame of reference travelling with the gas bubble front. The problem unknowns are the elongated bubble velocity $U_\infty$, the liquid velocity and the liquid height $h_L$ in the layer under the bubble (see figure 1).

These three unknowns were found by applying mass and momentum balances on the liquid phase between sections upstream and downstream of the bubble nose and Bernoulli's equation along the gas–liquid interface. The gas–liquid interface was assumed to be horizontal far downstream of the bubble front. In the frame of reference travelling with the front of the elongated bubble at velocity $U_\infty$, the conservation of mass between two sections, one in the upstream region and the second one in the downstream liquid layer, can be expressed as

(1.2)\begin{equation} \rho_L U_\infty S = \rho_L~U'_{L}~S~\varepsilon_{L}, \end{equation}

where $U'_{L}$ is the mean liquid velocity in the downstream liquid layer in the frame of reference travelling with the elongated bubble front (throughout the text, the prime will denote variables written in the frame of reference of the bubble front), $S$ is the pipe cross-sectional area and $\varepsilon _{L}$ is the liquid volume fraction in the downstream liquid layer. The momentum balance between the two sections is

(1.3)\begin{equation} \rho_L U_\infty^2 S +P_0 S + \rho_L g \frac{D}{2} S= \rho_L U_{L}'^2 S \varepsilon_{L} + \rho_L g (h_{L}- h_{gL}) S \varepsilon_{L}, \end{equation}

where $P_0$ is the pressure at the upper boundary of the pipe (Benjamin considered that the pressure is zero everywhere along the free surface) and $h_{gL}$ is the centre of gravity in the liquid phase (its analytical expression is given in Appendix A). Following Benjamin (Reference Benjamin1968), Bernoulli's equation can be expressed along the gas–liquid interface as

(1.4)\begin{equation} \rho_L g D= \tfrac{1}{2} \rho_L U_{L}'^2 + \rho_L g h_{L}. \end{equation}

The system of 3 equations ((1.2), (1.3) and (1.4)) fixes the three unknowns: $U_\infty$, $h_L$ and $U_{L}'$. This system can be reduced to a system of two equations and two unknowns, expressed as

(1.5)$$\begin{gather} \frac{U_\infty}{\sqrt{g D}}=\sqrt{\frac{1-2 \varepsilon_L(H_L -H_{gL})}{\dfrac{2}{\varepsilon_L}-1}}, \end{gather}$$
(1.6)$$\begin{gather}\frac{U_\infty}{\sqrt{g D}}=\varepsilon_L \sqrt{2~(1-H_L)}, \end{gather}$$

where all the lengths are divided by the diameter of the pipe ($H_L = h_L / D$, $H_{gL} = h_{gL} / D$). Solving this set of (1.5) and (1.6) provides the Froude number $Fr = {U_\infty }/{\sqrt {g D}}$ and the dimensionless liquid height $H_L$. The solution corresponds to a Froude number equal to the well-known value of 0.54, a liquid layer height equal to 56 % of the pipe diameter and a liquid volume fraction $\varepsilon _L$ equal to 57.5 %.

The paper from Benjamin (Reference Benjamin1968) is a reference case for assessing the velocity of an elongated bubble in horizontal tubes for inviscid liquids. However, further investigations are required for situations where the liquid viscosity or the surface tension plays a major role. In particular, surface tension has been shown to reduce the velocity of the bubble front $U_\infty$ and modify its shape (Gardner & Crow Reference Gardner and Crow1970).

Several experimental and numerical studies have been performed to better understand the impact of liquid viscosity and surface tension on the elongated bubble velocity in horizontal and inclined pipes. Gokcal et al. (Reference Gokcal, Wang, Zhang and Sarica2008) extended the work of Benjamin (Reference Benjamin1968), highlighting that viscous effects were responsible for a uniform increase in the liquid layer height in the receding stream under the bubble. Jeyachandra et al. (Reference Jeyachandra, Gokcal, Al-Sarkhi, Sarica and Sharma2012) proposed empirical correlations for elongated bubble velocities in high-viscosity liquids in pipes with different dimensions.

Various Froude number correlations were addressed in Livinus et al. (Reference Livinus, Verdin, Lao, Nossen, Langsholt and Sleipneas2018) and Valdés et al. (Reference Valdés, Pico, Pereyra and Ratkovich2020). These investigators assessed the performance of previous correlations against experimental data (Livinus et al. Reference Livinus, Verdin, Lao, Nossen, Langsholt and Sleipneas2018) and numerical simulations (Valdés et al. Reference Valdés, Pico, Pereyra and Ratkovich2020). They argued that the correlations barely account for the combined effects of liquid viscosity and surface tension under specific operating conditions and that a more general model is needed. The experimental studies listed above covered all inclinations between 0$^{\circ }$ and 90$^{\circ }$, with rather large steps (10$^{\circ }$ to 15$^{\circ }$) and thus little information at lower inclinations. The experimental studies of Losi & Poesio (Reference Losi and Poesio2016) and Livinus & Verdin (Reference Livinus and Verdin2021) addressed the velocity, shape, length and gas volume fraction along bubbles in pipes with small inclinations. For inclination angles smaller than 2$^{\circ }$, a significant drop in the terminal velocity of the elongated bubble was reported for viscous fluids. However, the physical origin behind this phenomenon remains unknown.

Based on the above literature review, studies of the dynamics of elongated bubbles at small inclinations in viscous liquids are scarce. In this paper, an experimental analysis of the bubble front velocity is conducted for various pipe inclinations with respect to horizontal alignment (between $0.2^\circ$ and $15^\circ$) and liquid viscosities (from $50\ {\rm mPa}\ {\rm s}$ to $200\ {\rm mPa}\ {\rm s}$); in this study, the Eötvös number remains constant and large. The experimental set-up and measurement techniques are presented in § 2. Section 3 describes the experimental results, starting with the terminal velocities and the elongated bubble shape, followed by an analysis of the velocity field in the liquid. A discussion of the results is presented in § 4, with fluids that are 50 and 200 times more viscous than water.

2. Experimental set-up and measurement techniques

The velocity $U_\infty$ and the shape of elongated bubbles are measured experimentally. The experimental set-up is presented in figure 2 and consists of a 4.5 m long pipe with an internal diameter $D$ of 0.0352 m. The pipe is mounted on a metal structure that can be inclined from $0.2^{\circ }$ to a maximum of $15^{\circ }$ with a $\pm 0.05^{\circ }$ precision. Note that no experiment has been performed for a strictly horizontal pipe, i.e. $\theta = 0^{\circ }$.

Figure 2. Experimental set-up to measure the dynamics of elongated gas bubbles in inclined pipes. 1: pipe; 2: precision toothed rack; 3: valve; 4: diode; 5: test section with the optical box and the optical set-up (camera and particle image velocimetry); 6: test section with the optical box and camera.

Air is used to generate the bubbles, and the liquid phase is a mixture of distilled water and Breox$\circledR$ 75 W 55 000 (BASF Germany, chemical name: polyalcoxyether). Mixing Breox with water noticeably increases the viscosity of the solution while ensuring Newtonian behaviour. The viscosity of the liquid is measured at different temperatures using a Brookfield rotating viscometer (Ametek, USA). The surface tension of water–Breox solutions is constant and equal to 0.055 N m$^{-1}$ regardless of the Breox concentration. The viscosities of the solutions used in this study are given in table 1.

Table 1. Fluid properties at $20\,^{\circ }$C of the water–Breox mixtures used in this work.

All the experimental results presented in this paper correspond to elongated bubbles (drainage experiments). The pipe is initially filled with liquid. Drainage is initiated by opening the downstream valve. An elongated bubble is generated when liquid is drained out of a pipe; it fills the liquid volume lost during drainage. The measurement of the velocity of the elongated bubble is presented in § 2.1. The shapes of the elongated bubbles are measured using shadowgraphy with collimated parallel light; the technique is presented in § 2.3. Moreover, bubble shape measurements allow us to obtain the height of the liquid layer far downstream of the bubble nose $h_L$ and the curvature at the stagnation point $R_{CS}$. Particle image velocimetry (two-dimensional, two component PIV) measurements are performed in the vertical symmetry plane at the bubble nose and in the liquid layer; this measurement technique is presented in § 2.2. The velocity field close to the bubble nose also enables the determination of the position of the stagnation point.

The optical set-up and the test section are presented in figure 3. Two cameras are placed on a plane associated with the pipe structure, so that they follow the pipe inclination and do not need to be recalibrated each time the pipe inclination is modified. The two cameras are set up so that synchronised shadowgraphy and PIV measurements are possible; i.e. these cameras use the same visualisation window. The test section is located 3 m away from the pipe inlet to avoid any entrance effects and 1.5 m away from the end to avoid disturbances from the top end. An optical box filled with water is used to reduce the optical distortion or aberration linked to the travel of light through media with different optical indices.

Figure 3. Test section with the optical box and the optical set-up of coupled shadowgraphy and PIV imaging. 1: PIV camera; 2: shadowgraphy camera; 3: shadowgraphy collimated light source; 4: PIV laser sheet; 5: parallelepipedic box; 6: pipe.

2.1. Terminal velocity measurements of elongated bubbles

The elongated bubble velocity $U_{\infty }$ is measured using three laser diodes mounted on the top of the pipe and placed one metre apart. When a bubble passes through a laser diode, the signal jumps abruptly due to the difference in the refractive index between the liquid and air. Thus, the position of the elongated bubble in the pipe can be recorded as a function of time, with a frequency of 1000 Hz. The distance between the diodes is known, and the velocity of the elongated bubble is easily determined by obtaining the time lag between the different signal jumps (bubble noses). The uncertainties related to the measurements of $U_{\infty }$ are discussed further in Appendix B.

2.2. Liquid velocity measurements: PIV

The PIV measurements are carried out using a Dantec 4M camera with a resolution of 1632 (horizontal) $\times$ 816 (vertical) pixels (12 bits) and a double-cavity pulsed 30 mJ Nd:Yag laser with a 532 nm wavelength and a 30 Hz maximum frequency. Rhodamin-B particles with sizes close to 20 $\mathrm {\mu }$m are used as seeding particles because of their light spectrum. Their highest light absorption is in the green range with a peak at 550 nm, while the highest emission is in the orange and red range with a peak at 590 nm. Hence, a green (532 nm) laser (Skylight from Dantec) is used as the light source for Rhodamin-B particle excitation and a highpass light filter (over 570 nm) is installed on the camera to register only the red light emitted from the particles.

2.3. Elongated bubble shape: shadowgraphy

The gas–liquid interface position is recorded using the projected bubble shape on a camera. The major challenge when dealing with spatially extended bubbles is to ensure uniform lighting on the entire bubble surface. The shadowgraphy experiments make use of a Basler Ace acA1920-155 $\mathrm {\mu }$m camera with a resolution of 1920 (H) $\times$ 1200 (V) pixels in full frame on 12 bits, together with a collimated light source positioned at the other side of the pipe.

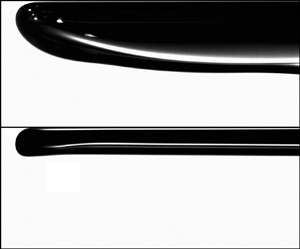
A collimated light source is considered, which ensures that light beams going through the optical box and test section are strictly parallel. Optical distortions and the variety of refracted and reflected beams are considerably reduced, increasing the overall contrast and accuracy of the image near the pipe walls, as shown in Appendix C (figure 14). A reduced window of observation (96 (H) $\times$ 1120 (V) pixels) is used to provide uniform lighting from the source. This set-up allows an accuracy of 36 $\mathrm {\mu }$m pixel$^{-1}$ and is very convenient for capturing the moving gas–liquid interface with precision.

The recorded shadow images need to be concatenated to reconstruct a full image of the bubble. The latter step is performed with the knowledge of the bubble velocity and the number of pixels travelled between two image acquisitions. The whole bubble is then reconstructed iteratively from an initial image of the bubble nose. Further postprocessing reported in Appendix C reveals the gas–liquid interface position.

3. Results

3.1. Terminal velocity of elongated bubbles

The influence of the liquid viscosity on the elongated bubble velocity is shown in figure 4, where the Froude number is plotted as a function of the pipe inclination for different liquid viscosities. An air–water experiment is shown as a reference case. We can see that, as expected, the elongated bubble velocity $U_\infty$ increases with pipe inclination angle and decreases with liquid viscosity.

Figure 4. Froude number based on experimental terminal velocities vs pipe inclination for draining bubbles in liquids of different viscosities in slightly inclined pipes.

In the air–water case, the elongated bubble velocity increases almost linearly with the pipe inclination when $0^{\circ } < \theta < 15^{\circ }$. The linear extrapolation to $0^\circ$ of our air–water experimental data agrees well with the experimental observations of Zukoski (Reference Zukoski1966) for similar experimental conditions, where the Froude number is approximately equal to 0.43, and with the correlation

(3.1)\begin{equation} \frac{U_{\infty}}{\sqrt{gD}} = 0.542 - \frac{1.76}{Eo^{0.56}}, \end{equation}

proposed by Weber et al. (Reference Weber, Alarie and Ryan1986) for horizontal pipes, with the Eötvös number $Eo$ equal to 220.

For liquids with higher viscosities investigated in this paper, the evolution of the bubble velocity with respect to the pipe inclination angle is no longer linear, and the velocities $U_\infty$ decrease significantly when the pipe inclination angle $\theta$ tends to $0^\circ$. Similar velocity reductions for small inclination angles are present in the literature, even though they have not been analysed in detail (Weber et al. Reference Weber, Alarie and Ryan1986; Losi & Poesio Reference Losi and Poesio2016).

3.2. Shapes of elongated bubbles

Next, we investigate whether the distinguished behaviour of the elongated bubble velocity in highly viscous fluids can be associated with its shape. With this objective, the profiles of the bubbles alongside the Froude number are plotted in figure 5 for the same fluids shown in figure 4. Several features can be observed from an analysis of figure 5. For each viscosity, the Froude number decreases with pipe inclination. The liquid height in the downstream liquid layer is constant and one can observe that, at each liquid viscosity, the Froude number decreases when the downstream layer liquid height increases. In the case of water, the bubble shape does not change significantly with pipe inclination, whereas a significant evolution of both the shape and the velocity of the bubble is noted for highly viscous liquids.

Figure 5. Terminal velocities and shapes of elongated bubbles in inclined pipes. Panels show(a) $\mu _L=0.01\ {\rm Pa}\ {\rm s}$, (b) $\mu _L=0.02\ {\rm Pa}\ {\rm s}$, (c) $\mu _L=0.091\ {\rm Pa}\ {\rm s}$ and (d)$\mu _L=0.19\ {\rm Pa}\ {\rm s}$.

Additionally, from figure 5, it is possible to analyse the shape of the elongated bubble nose and the liquid layer height in the downstream area. At the steepest pipe inclinations ($\theta = 15^\circ$), the nose shape and the liquid layer height are seemingly unaffected by the viscosity of the liquid. However, at low pipe inclinations, a significant influence due to the viscosity is noted. In view of the observations made, we will consider in the following a bubble shape slightly different from that shown in figure 1. Figure 6 shows the stagnation point, its vertical position and the $\xi$ and $\zeta$ coordinates which will be used later.

Figure 6. Shape of an elongated gas bubble in a horizontal pipe.

3.3. The PIV results for the vertical profiles of axial velocity under a draining elongated bubble

The PIV results coupled to shadowgraphy experiments are presented in figure 7 for three different viscosities. For simplicity, only one pipe inclination ($\theta = 1^{\circ }$) is illustrated. For clarity, the velocity field is presented on a 4$D$ length of the bubble, and only one vector on five is represented in the axial (associated with $\xi$) direction (see figure 7), except near the bubble nose. The shapes of the gas bubbles are extracted from shadowgraphy images and are superimposed on the PIV results.

Figure 7. Velocity fields and bubble shape flowing in a $1^{\circ }$ pipe inclination at different liquid viscosities;(a) 50 cP, (b) 100 cP and (c) 200 cP.

The vertical profiles of the axial velocity in the liquid are plotted in figure 8 for several axial positions ($\xi = 3 D; 15 D; 30 D$, $\xi =0$ being fixed in the section of the nose of the elongated bubble). For the three viscous fluids, the liquid flow develops rapidly in the liquid layer (figure 8) and the vertical profiles of axial velocity in the liquid seem to correspond to laminar flows. An analytical solution for laminar stratified flow was proposed by Ranger & Davis (Reference Ranger and Davis1979). In what follows, the solution of Ranger & Davis (Reference Ranger and Davis1979) is extended to a laminar liquid layer flowing in an inclined pipe without a pressure gradient (constant pressure in the elongated bubble) or interfacial viscous stress, corresponding to the fully developed falling liquid layer far from the bubble nose during drainage (Boucher Reference Boucher2021). Ranger & Davis (Reference Ranger and Davis1979) used a bipolar coordinate system together with Fourier transformations to describe the velocity field in both phases. A numerical solution for the Navier–Stokes equations via a bipolar coordinate system is obtained inside the unitary circle of equation (see Appendix A for an illustration of the bipolar coordinates)

(3.2)\begin{equation} z^2 + [y-R \cos(\alpha)]^2= R^2. \end{equation}

Recall that $x$ is the pipe axis, $z$ and $y$ are the coordinates in the cross-section of the pipe, $z$ is horizontal and $y$ is directed upwards. Here, $R$ stands for the pipe radius. Using this formalism, the liquid lies in $y < 0$. The bipolar coordinates $\chi$ and $\eta$ are defined for the cross-section of the pipe as follows:

(3.3a,b)\begin{equation} \frac{z}{R}=\frac{\sin(\alpha) \sinh(\chi)}{\cosh(\chi)-\cos(\eta)} \quad \textrm{and} \quad \frac{y}{R}=\frac{\sin(\alpha) \sin(\eta)}{\cosh(\chi)-\cos(\eta)}. \end{equation}

The liquid phase corresponds to $-\infty < \chi < +\infty$ and ${\rm \pi} < \eta < {\rm \pi}+\alpha$.

Figure 8. Vertical profiles of the axial velocity for a $1^{\circ }$ pipe inclination at different liquid viscosities;(a) 50 cP, (b) 100 cP and (c) 200 cP.

The axial liquid velocity is given by

(3.4)\begin{equation} U_L(\chi,\eta)=\frac{\rho_L g \sin(\theta) R^2}{\mu_L} \left[\frac{\sin(\alpha) \sin(\eta-\alpha)}{2 (\cosh(\chi)-\cos(\eta))} +\beta_L(\chi,\eta) \right], \end{equation}

where

(3.5)\begin{equation} \beta_L(\chi,\eta)={-}\frac{\sin(2 \alpha)}{2} \int_0^{+\infty} \frac{\sinh[k ({\rm \pi} - \alpha - \eta)] \cos(k \chi)}{\cosh(k \alpha) \sinh(k {\rm \pi})} \,{\mathrm{d}}k. \end{equation}

One can thus compare vertical profiles of the axial velocity at different axial positions with the laminar solution of fully developed laminar flow in a falling liquid layer (see figure 8). In bipolar coordinates, the vertical plane of symmetry of the pipe corresponds to $\chi = 0$. Clearly, from figure 8, the liquid flow is laminar, and the fully developed velocity field in the liquid is reached after 5 pipe diameters downstream of the bubble nose at 200 cP liquid viscosity, after 10 pipe diameters at 100 cP and after more than 20 pipe diameters at 50 cP. The postprocessing of the shadowgraphy images and the liquid velocity fields obtained by PIV (see figure 7) allowed us to extract the information reported in table 2.

Table 2. Flow characteristics of the water–Breox mixtures at a $1^{\circ }$ inclination.

For each viscosity of the liquid, the velocity of the elongated bubble $U_\infty$ and the associated Froude number ($Fr$) are reported. At 1$^\circ$ inclination, the elongated bubble velocity decreases when the liquid viscosity increases. The height of the liquid $h_L$ in the downstream developed liquid layer is constant and can be measured. From the liquid height $h_L$, one can deduce the liquid volume fraction in a cross-section (see (A1) and (A2) in Appendix A). One can thus derive the mean liquid velocity in the frame of reference moving with the bubble $\langle U_{L}'\rangle$ and the Froude number in the receding stream $Fr_{RS}$, defined as

(3.6)\begin{equation} Fr_{RS} =\frac{\langle U_{L}'\rangle}{\sqrt{g D}}. \end{equation}

The position of the stagnation point $h_S$ (which differs from the position of the nose of the elongated bubble) and the curvature $r_{CS}$ of the interface at this point are determined from data processing. Two dimensionless numbers are added, the capillary number $Ca$ and a Reynolds number $Re_{EB}$ related to the velocity of the elongated bubble defined, respectively, as

(3.7)$$\begin{gather} Ca =\frac{\mu_{L} U_\infty}{\sigma}, \end{gather}$$
(3.8)$$\begin{gather}Re_{EB} =\frac{\rho_{L} D U_\infty}{\mu_{L}}. \end{gather}$$

The position of the stagnation point $H_S = h_S / D$, the curvature $R_{CS} = r_{CS} / D$ of the interface at this point, the height of the liquid $H_L = h_L / D$ in the developed liquid layer, the associated Froude number $Fr_{RS}$, the capillary number $Ca$ and the elongated bubble Reynolds number $Re_{EB}$ are tabulated in table 2. The decrease in the bubble velocity $U_\infty$ observed with increasing liquid viscosity is accompanied by an increase in the height $h_L$ of the liquid layer under the bubble. The Froude $Fr_{RS}$ is larger than one in water (supercritical flow) whereas it is smaller than one in the viscous fluids (subcritical flows in the liquid layer). The values of the capillary number $Ca$ in viscous fluids are sufficiently large to consider that the capillary forces are small compared with the viscous forces.

Note that it is possible to observe an upper liquid film between the gas bubble and the upper wall. It is interesting to compare the estimations of the overpressure induced by the curvature of the interface at the stagnation point with the height of the liquid film above the bubble at this point; these two terms ${2\sigma }/{R_{CS}}$ and $\rho _Lg(D-h_S)$ are very close. Nonetheless, a detailed study of this liquid film requires a more precise and specific camera set-up, and therefore, the liquid film at the top wall will not be discussed further here.

4. Discussion

The analysis of figures 7 and 8 shows that, from a distance of a few pipe diameters along $\xi$ ($\xi = 0$ at the bubble nose), the height of the liquid layer is constant ($\xi = 2D$ at 50 cP, $\xi = 1D$ at 100 cP, $\xi = 0.5D$ at 200 cP). The free surface of the liquid layer is then parallel to the axis of the pipe. This behaviour is confirmed in figure 9, which shows different axial profiles of the elongated bubble for two liquid viscosities and different pipe inclination angles.

Figure 9. Profiles of elongated bubbles in viscous liquids, $0 < \varXi = \xi /D < 4$; (a) 50 cP and (b) 200 cP.

This behaviour can be associated with the development of a laminar flow of liquid falling down the inclined pipe, where the weight of the liquid layer is balanced by the frictional force of the liquid along the wall. There are no tangential and normal viscous stresses at the free surface. In this type of flow, the iso-pressure lines in the liquid are parallel to the wall. So, from a distance of a few pipe diameters along $\xi$ from the bubble nose, the pressure at the free surface is constant, as is the velocity of the liquid. As a result, whatever the inclination angle of the pipe, there is a transition from horizontal iso-pressure lines upstream the bubble nose (corresponding to a hydrostatic pressure distribution in the liquid at rest) to iso-pressure lines parallel to the free surface and the pipe wall in the downstream liquid layer. Therefore, the Bernoulli equation can be applied along the free surface only between the stagnation point S and a point located at a distance of a few pipe diameters along $\xi$ from the bubble nose.

4.1. Analysis of the 200 cP case

Let us consider the case of the most viscous liquid, 200 times more viscous than water, in order to analyse the evolution of the shape and the front velocity of the elongated bubbles as a function of the pipe inclination. The bubble profiles obtained from shadowgraphy are shown in figure 9(b) for pipe inclinations varying between $0.4^{\circ }$ and $2^{\circ }$. Let us recall that these different cases are accompanied by a significant decrease in the terminal velocity of the bubble front when decreasing the pipe inclination angle (figure 4). Following the analysis of figure 8, we can consider the analytical solution of the velocity field in laminar flow in the fully developed liquid layer to express the momentum in the downstream liquid layer.

One can derive the mean value of the liquid velocity given by (3.4) in a fixed frame of reference

(4.1)\begin{equation} \langle U_{L}\rangle =\frac{Q_L}{{\rm \pi} R^2 \varepsilon_L} = \frac{\rho_L g \sin(\theta) R^2}{\mu_L {\rm \pi}\varepsilon_L} \Bigg[\frac{1}{8}\left(\alpha -\frac{2}{3} \sin(\alpha)+\frac{1}{12} \sin(2\alpha) \right) - B_L \Bigg], \end{equation}

where $Q_L$ is the liquid flow rate and

(4.2)\begin{equation} B_L ={-}\frac{\rm \pi}{2} \sin(\alpha) \sin(2 \alpha) \int_0^{+\infty} \frac{k}{\sinh^2(k~{\rm \pi})} [k \sin(\alpha)-\cos(\alpha) \tanh(k \alpha) ]\,\mathrm{d}k. \end{equation}

Let us write a material balance between the bubble nose and the fully developed liquid layer in the frame of reference travelling with the bubble nose at the velocity $U_\infty$

(4.3)\begin{equation} \phi_L = \varepsilon_L (U_\infty+\langle U_{L}\rangle ) = U_\infty, \end{equation}

where $\phi _L$ is the liquid flux in a frame of reference travelling with the bubble front velocity. The liquid fraction $\varepsilon _L$ in (4.3) corresponds to $\varepsilon _{L}$ in (1.2). Likewise, the liquid velocity in a travelling frame $\langle U_{L}'\rangle$ in (1.2) corresponds to the velocity $U_\infty +\langle U_{L}\rangle$ in (4.3).

One can thus express the velocity of the elongated bubble as

(4.4)\begin{equation} U_\infty = \frac{\varepsilon_L}{1-\varepsilon_L}\langle U_{L}\rangle = \frac{\rho_L g \sin(\theta) R^2}{\mu_L {\rm \pi}(1-\varepsilon_L)} \left[\frac{1}{8}\left(\alpha -\frac{2}{3} \sin(\alpha)+\frac{1}{12} \sin(2 \alpha) \right) - B_L \right]. \end{equation}

One can thus derive a new Froude number $Fr_{MM}$, which is based on the mass and momentum conservation considering a laminar flow in the fully developed liquid layer, and which is defined as

(4.5)\begin{equation} Fr_{MM} = \frac{U_\infty}{\sqrt{g D}}= \frac{Re_b \sin(\theta)}{4 {\rm \pi}(1-\varepsilon_L)} \left[\frac{1}{8}\left(\alpha -\frac{2}{3} \sin(\alpha)+\frac{1}{12} \sin(2\alpha) \right) - B_L \right]. \end{equation}

The Froude number, and consequently the velocity of the elongated bubble, increases with increasing pipe inclination. Similarly, it decreases with increasing liquid viscosity or decreasing buoyancy Reynolds number $Re_b$. Thus, it is possible to write a Froude number (4.5) that depends explicitly on the viscosity of the fluid, the inclination angle of the pipe and the height of the liquid layer. For this viscous fluid, 200 times more viscous than water, the Froude number is calculated for the different pipe inclinations. The different curves corresponding to the different pipe inclinations $0.2^\circ$, $0.6^\circ$ and $1.2^\circ$ are plotted in figure 10(b) as well as the experimental values of the Froude number.

Figure 10. Froude number ((4.5) and (4.10)) as a function of the water layer height; (a) 50 cP and (b) 200 cP.

Referring to figure 9(b), the bubble nose does almost not present the shape of a breaking head for such highly viscous fluid at the lowest pipe inclination. Bernoulli's equation can be expressed along the gas–liquid interface between the stagnation point and the surface of the downstream liquid layer as

(4.6)\begin{equation} P_S + \rho_L g h_S = \tfrac{1}{2} \rho_L U_{L}^2(h_{L}) +P_1 + \rho_L g h_{L}, \end{equation}

where $h_S$ is the vertical position of the stagnation point from the bottom of the pipe. Surface tension causes the pressure in the air to exceed the pressure in the liquid. Since the pressure in the gas is constant and equal to $P_1$, one can write

(4.7)\begin{equation} P_1 = P_S + \frac{2 \sigma}{r_{CS}}, \end{equation}

where $r_{CS}$ is the radius of curvature of the gas–liquid interface at the stagnation point. These last two equations can be combined as

(4.8)\begin{equation} \rho_L g h_S = \frac{1}{2} \rho_L U_\infty^2 + \rho_L g h_L + \frac{2 \sigma}{r_{CS}}. \end{equation}

Furthermore, one can introduce the constant $C_1$ to relate the interfacial velocity $U_{L}(h_{L})$ to the mean velocity $\langle U_{L}\rangle$ in the downstream liquid layer

(4.9)\begin{equation} U_{L}(h_{L}) = C_1 \langle U_{L}\rangle . \end{equation}

The constant $C_1$ can thus be derived analytically. One can then derive a second Froude number $Fr_B$ from (4.8) combined with the mass balance, (1.2), giving

(4.10)\begin{equation} Fr_{B} = \frac{U_\infty}{\sqrt{g D}}=\frac{\varepsilon_L}{C_1} \sqrt{{2 (H_S-H_L)-\frac{\varSigma}{R_{CS}}}}, \end{equation}

where $H_S = {h_S}/{D}$, $R_{CS} = {r_{CS}}/{D}$ and $\varSigma$ is defined as

(4.11)\begin{equation} \varSigma = \frac{4 \sigma}{\rho_L g D^2}=\frac{4}{Eo}. \end{equation}

Solving the set of (4.5) and (4.10) provides the Froude number $Fr$ and the dimensionless liquid height $H_L$, given the constant $C_1$, the experimental values of both the position of the stagnation point $H_S$ and the radius of curvature at this point. Based on the PIV and shadowgraphy experiments, the position of the stagnation point is estimated to be close to $H_S = 0.92$ and the radius of curvature close to $R_{CS} = 0.14$. Given the velocity profiles in the fully developed liquid layer that are close to the analytical laminar solution, the value of the coefficient $C_1$ was fixed to 1.4. The Froude number based on Bernoulli $Fr_{{B}}(H_L)$ is plotted in figure 10(b). The agreement between theory and experiments is excellent for the three pipe inclinations, $0.2^\circ$, $0.6^\circ$ and $1.2^\circ$. The question that arises is how to evaluate the viscous dissipation along the gas–liquid interface between the upstream stagnation point and a downstream point located at the surface of the fully developed liquid layer. Viscous dissipation is obviously important in the liquid layer. For a falling liquid layer, there is a balance between the power of the volume forces and the viscous dissipation of kinetic energy. However, in this downstream liquid layer, the viscous dissipation at the interface is close to zero. Limited data are available on the viscous dissipation at the interface between an elongated bubble and a liquid layer. Bonometti, Balachandar & Magnaudet (Reference Bonometti, Balachandar and Magnaudet2008) addressed this issue through direct numerical simulations. These researchers confirm that wall friction plays a significant role in the dynamics of highly contrasted density currents, which corresponds to our study with regard to two-phase gas–liquid flow. At high density contrast, the dissipation at the interface is estimated to be one order of magnitude smaller than the dissipation at the lower wall.

4.2. Analysis of the 50 cP case

Let us consider now the case of elongated bubbles flowing in a viscous liquid that is 50 times more viscous than water, in order to analyse the evolution of their shape and their velocity as a function of the pipe inclination. Contrary to the more viscous case, where figure 5(d) does not show any significant breaking head at low pipe inclinations, the bubble nose in a liquid that is 50 times more viscous than water exhibits the shape of a breaking head at small pipe inclinations (i.e. smaller than $2^{\circ }$, see figure 5b), suggesting energy losses along the gas–liquid interface. Similar to the most viscous case, we base ourselves on the analytical solution of the velocity field in laminar flow in the fully developed liquid layer. One can thus estimate the Froude number $Fr_{MM}$ based on the hydrodynamics in the liquid layer, given by (4.5), which depends explicitly on the viscosity of the fluid, the inclination of the pipe and the height of the liquid layer. This Froude number is calculated for pipe inclinations varying between $0.4^\circ$ and $2^\circ$ and plotted in figure 10(a) together with the experimental values. Now, for a liquid that is 50 times more viscous than water, we cannot neglect the energy loss between the stagnation point and the fully developed liquid layer. To convince us of this, two Froude numbers are plotted in figure 10(a). The first one, $Fr_B$ given by (4.10), neglects any energy loss, and the second one, $Fr_{Bloss}$, accounts for an energy loss ${\rm \Delta} = 0.05$ and is defined as

(4.12)\begin{equation} Fr_{Bloss} = \frac{U_\infty}{\sqrt{g D}}=\frac{\varepsilon_L}{C_1} \sqrt{{2 (H_S-H_L-\varDelta)-\dfrac{\varSigma}{R_{CS}}}}. \end{equation}

Interestingly, taking the energy loss into account allows the Froude number of elongated bubbles with breaking heads at low inclinations to be predicted, whereas the Froude number of elongated bubbles without breaking heads at slightly higher inclinations can be predicted by neglecting the energy loss, as in the previous case.

To support this analysis, direct numerical simulations are in progress, as well as a three-dimensional analysis of the flow of the liquid phase by TOMOPTV.

5. Conclusion

The motion of elongated bubbles flowing in a slightly inclined pipe (with inclination angles between 0.2$^\circ$ and 15$^\circ$ from the horizontal) initially filled with a viscous liquid at rest (10 to 200 times more viscous than water) was studied experimentally. The velocity and the shape of the elongated bubbles, as well as the velocity profiles in the liquid layer under the bubble, were analysed using PIV and shadowgraphy. The pipe diameter and the surface tension being fixed, the Eötvös number remained constant and large (close to 220), so that it was possible to focus on the dependence of both the velocity and the shape of an elongated bubble on the pipe inclination angle and the viscosity of the liquid.

The experiments showed that the velocity of the elongated bubbles increases with the pipe inclination angle and decreases with the viscosity of the liquid. This sensitivity is particularly amplified at small pipe inclinations and high liquid viscosities, where a sharp drop of the elongated bubble velocity was observed.

The analysis of the PIV measurements showed that laminar flow develops rapidly in the liquid layer under the elongated bubble and that the liquid layer height is constant; the liquid flow results from a balance between gravity and friction at the wall. It was shown that the fully developed velocity profile in the downstream liquid layer can be derived analytically using a bipolar coordinate system together with Fourier transformations.

The position of the stagnation point was identified and the curvature of the interface at this point was estimated. Based on these data, it was shown that the velocity of the elongated bubble resulted from the transfer of potential energy between the stagnation point (located near the bubble nose, but not at the bubble nose) and a point located downstream along the gas–liquid interface (where the height of the liquid layer becomes constant) into kinetic energy.

The sharp decrease of the elongated bubble velocity at small pipe inclinations and high liquid viscosities can be explained physically using the analytical solution of the mass and momentum conservation equations in laminar flow, and the Bernoulli equation along the interface. The mass and momentum conservation forces the downstream liquid layer to be thicker at high liquid viscosities. As a result, the potential energy between the stagnation point and a point along the fully developed liquid layer becomes smaller, and so the driving force for the motion of the elongated bubble. In this sense, the approach from Benjamin (Reference Benjamin1968) for inviscid flows was extended to laminar flows.

In some cases (e.g. at medium viscosities), the bubble nose exhibited the shape of a breaking head, indicating that there was an energy dissipation along the gas–liquid interface. For those cases, it was possible to include an energy loss in the Bernoulli equation in order to predict satisfactorily the motion of the elongated bubble.

Acknowledgements

The authors would like to thank the company TotalEnergies for funding A.B.'s thesis, J.K.'s postdoctoral work and supporting this research. The authors also thank C. Le Men, research engineer at TBI during A.B.'s thesis, who contributed to the success of the PIV and shadowgraphy experiments.

Declaration of interests

The authors report no conflict of interest.

Appendix A. Geometrical parameters

In the calculations, the first geometric variable is the height of the liquid layer $h_L$ in the vertical plane of symmetry of the pipe and in the fully developed liquid layer (see figure 11a). One can derive the angle $\alpha$ such that

(A1)\begin{equation} h_L = \frac{D}{2} [1-\cos(\alpha)], \end{equation}

and the liquid fraction $\varepsilon _L$ in the fully developed liquid layer as

(A2)\begin{equation} \varepsilon_L = \frac{2 \alpha - \sin(2 \alpha)}{2 {\rm \pi}}. \end{equation}

The centre of gravity in the liquid phase $h_{gL}$ is also introduced and can be expressed as

(A3)\begin{equation} h_{gL} = \frac{D}{2} \Big[1-\frac{2}{3 {\rm \pi}\varepsilon_L}\sin(\alpha)^3\Big]. \end{equation}

The bipolar coordinates defined in (3.3a,b) are plotted in figure 11(b).

Figure 11. (a) Cross-section in the liquid layer; definition of the vertical positions of the interface and gravity centres in each phase and (b) bipolar coordinates.

Appendix B. Measurement of the terminal velocity

B.1. On the uncertainty of the terminal velocity measurements

The uncertainties in the velocity measurements can be estimated based on the accuracy of the laser diodes. Given the sampling frequency of the diodes, $Fe = 1000$ Hz, the uncertainty linked to the detection of a bubble is ${\rm \Delta} t' = 1/Fe$ for one diode; ${\rm \Delta} t' = \sqrt {2}/Fe$ for the measurement. This time represents the maximum time a gas bubble can spend under the diode without being detected. The resulting uncertainties in the velocities can be expressed as follows, assuming that ${\rm \Delta} t' \ll {\rm \Delta} t$, where ${\rm \Delta} t$ is the time spent by the slug bubble between the two diodes:

(B1)\begin{equation} {\rm \Delta} U_\infty = \frac{d}{{\rm \Delta} t^2}\frac{\sqrt{2}}{Fe} = \frac{U_\infty^2}{d}\frac{\sqrt{2}}{Fe}. \end{equation}

This error corresponds to the error linked to the measurement technique (laser diodes) for a given inclination and liquid viscosity. Given the distance between the two diodes, $d=1$ m, and the fact that the maximum velocity experienced for $\theta = 15^\circ$ is approximately $0.25$ m s$^{-1}$, the absolute uncertainty made on the velocity is approximately $0.000125$ m s$^{-1}$. In terms of the relative error on the velocity

(B2)\begin{equation} \frac{{\rm \Delta} U_\infty}{U_\infty} = \frac{U_\infty}{d}\frac{\sqrt{2}}{Fe}, \end{equation}

which gives a relative uncertainty of 0.5 % in the velocity measurements.

B.2. On the evolution of the terminal velocity along the pipe for bubbles of finite and infinite volume

The development length of bubbles in a stagnant liquid was investigated by Losi & Poesio (Reference Losi and Poesio2016) for different liquid viscosities and pipe inclinations. These researchers concluded that the flow under an elongated bubble can never develop in horizontal pipes. At one degree, however, their measurements show a different behaviour, and the flow develops rather quickly for all investigated liquid viscosities. For instance, for liquid viscosities of 0.038 ${\rm Pa}\ {\rm s}$ and 0.195 ${\rm Pa}\ {\rm s}$, an average of 2 m is needed for the development of the bubble velocities over the 1–5$^\circ$ range of their experiments. In addition, it is worth noting that the diameter of the pipe used in their experiment was 0.022 m; hence, a dimensionless length of 90 pipe diameters on average was needed for the bubble to reach a constant velocity.

Particular attention was thus accorded in our experiments to development effects on both the velocity and the shape of the bubbles. Figure 12 shows, for two different liquid viscosities, the velocity measurements obtained from the first set of diodes (1 and 2) and from the second set (2 and 3). No development effects were observed for our elongated bubbles.

Figure 12. Terminal velocities of the bubbles recorded by the first set of diodes (referred to as 1-2) and the second set (referred to as 2-3).

B.3. Influence of the pipe inclination uncertainty on the results

The uncertainties in the velocity measurements are mostly due to the possible error in the pipe inclination. This error is evaluated to be at maximum 0.1$^\circ$ and corresponds to the precision of the digital level meter used to determine the pipe inclination.

The influence of the uncertainty in the pipe inclination has thus been investigated by taking velocity measurements in the upper bound $\theta + 0.1^\circ$ and the lower bound $\theta -0.1^\circ$ for the given inclination $\theta$. This set of experiments led to the error bars in figure 13, which are linked to the $\pm 0.1^{\circ }$ accuracy of the digital level meter. For clarity, only three viscosities are represented in figure 13. The induced errors in velocity measurements for angles ranging from $2.0^\circ$ to $15.0^\circ$ are negligible; however, for smaller inclinations, there is a noticeable error in the results. However, even in this range of uncertainties, the general trend of decreasing velocities with decreasing inclination is clearly noticeable in figure 13.

Figure 13. Results for the terminal bubble velocity with a $\pm 0.1^\circ$ uncertainty in the pipe inclination angle.

For the results in § 3.1, each experiment was repeated at least five times for a given set of parameters, i.e. liquid viscosity and pipe inclination, and very good repeatability was achieved.

Appendix C. Image processing

Figure 14 shows the improvement of image quality using a collimated light source (see Boucher (Reference Boucher2021) for more details). Figure 15 shows the different steps in the image postprocessing of the recorded shadow images.

  1. (i) The background is subtracted from the initial image of $96 \times 1120$ pixels.

  2. (ii) The full bubble is reconstructed from the raw images by successively concatenating the pixels from two consecutive images.

  3. (iii) The deflated image is binarised, where the gas bubble is black and the liquid is white.

  4. (iv) The gas–liquid interface is determined by a closing operation of successive dilatations and erosions of the binarised image. The object selected for this operation is a disc with a radius of 2 pixels.

Figure 14. Shadowgraphy images after reconstruction (postprocessing) with a (a) regular LED board and(b) collimated light source.

Figure 15. Postprocessing steps for bubble shadowgraphy images. Here, $\theta = 15^\circ$ and $\mu _L = 0.1\ {\rm Pa}\ {\rm s}$.(a) Reconstructed image of the bubble from unprocessed images, (b) reconstructed image of the bubble from deflated images, (c) binarised bubble image from the deflated bubble image and (d) gas–liquid interface profile extracted from the binarised image.

References

Acrivos, A. & Herbolzheimer, E. 1979 Enhanced sedimentation in settling tanks with inclined wall. J. Fluid Mech. 92, 435457.CrossRefGoogle Scholar
Bendiksen, K.H. 1984 An experimental investigation of the motion of long bubbles in inclined tubes. Intl J. Multiphase Flow 10 (4), 467483.CrossRefGoogle Scholar
Benjamin, T.B. 1968 Gravity currents and related phenomena. J. Fluid Mech. 31 (2), 209248.Google Scholar
Bonometti, T., Balachandar, S. & Magnaudet, J. 2008 Wall effects in non-boussinesq density currents. J. Fluid Mech. 616, 445475.CrossRefGoogle Scholar
Boucher, A. 2021 Modélisation des écoulements intermittents gaz-liquide en conduite. Ph.D. thesis, Université de Toulouse, INSA.Google Scholar
Boycott, A.E. 1920 Sedimentation of blood corpuscles. Nature 102, 532.CrossRefGoogle Scholar
Brener, E., Rabaud, M. & Thomé, H. 1993 Effect of gravity on stable Saffman-Taylor fingers. Phys. Rev. E 48, 10661072.Google Scholar
Bretherton, F.P. 1961 The motion of long bubbles in tubes. J. Fluid Mech. 10, 166188.CrossRefGoogle Scholar
Couët, B. & Strumolo, G.S. 1987 The effects of surface tension and tube inclination on a two-dimensional rising bubble. J. Fluid Mech. 184, 114.CrossRefGoogle Scholar
Gardner, G.C. & Crow, I.G. 1970 The motion of large bubbles in horizontal channels. J. Fluid Mech. 43 (2), 247255.CrossRefGoogle Scholar
Gokcal, B., Wang, Q., Zhang, H.-Q. & Sarica, C. 2008 Effects of high oil viscosity on oil/gas flow behavior in horizontal pipes. SPE Proj. Fac. Const. 3 (2), 111.Google Scholar
Hallez, Y. 2007 Mélange gravitationnel de fluides en géométrie confinée. Ph.D. thesis, National Polytechnic Institute, Toulouse.Google Scholar
Jeyachandra, B.C.C., Gokcal, B., Al-Sarkhi, A., Sarica, C. & Sharma, A.K.K. 2012 Drift-velocity closure relationships for slug two-phase high-viscosity oil flow in pipes. SPE J. 17 (02), 593601.CrossRefGoogle Scholar
Livinus, A. & Verdin, P. 2021 Experimental study of a single elongated bubble in liquid in under 10-degree upwardly inclined pipes. Exp. Therm. Fluid Sci. 120, 110247.CrossRefGoogle Scholar
Livinus, A., Verdin, P., Lao, L., Nossen, J., Langsholt, M. & Sleipneas, H. 2018 Simplified generalised drift velocity correlation for elongated bubbles in liquid in pipes. J. Petrol. Sci. Engng 160, 106118.CrossRefGoogle Scholar
Losi, G. & Poesio, P. 2016 An experimental investigation on the effect of viscosity on bubbles moving in horizontal and slightly inclined pipes. Exp. Therm. Fluid Sci. 75, 7788.CrossRefGoogle Scholar
Ranger, K.B. & Davis, A.M.J. 1979 Steady pressure driven two-phase stratified laminar flow through a pipe. Can. J. Chem. Engng 57 (6), 688691.CrossRefGoogle Scholar
Séon, T., Salin, D., Hulin, J.P., Perrin, B. & Hinch, E.J. 2005 Buoyancy driven miscible front dynamics in tilted tubes. Phys. Fluids 17, 031702.CrossRefGoogle Scholar
Séon, T., Znaien, J., Salin, D., Hulin, J.P., Hinch, E.J. & Perrin, B. 2007 Transient buoyancy-driven front dynamics in nearly horizontal tubes. Phys. Fluids 19, 123603.CrossRefGoogle Scholar
Spedding, P.L. & Nguyen, V.T. 1978 Bubble rise and liquid content in horizontal and inclined tubes. Chem. Engng Sci. 33 (8), 987994.CrossRefGoogle Scholar
Valdés, J.P., Pico, P., Pereyra, E. & Ratkovich, N. 2020 Evaluation of drift-velocity closure relationships for highly viscous liquid-air slug flow in horizontal pipes through 3D CFD modelling. Chem. Engng Sci. 217, 115537.Google Scholar
Weber, M.E., Alarie, A. & Ryan, M.E. 1986 Velocities of extended bubbles in inclined tubes. Chem. Engng Sci. 41 (9), 22352240.CrossRefGoogle Scholar
White, E.T. & Beardmore, R.H. 1962 The velocity of rise of single cylindrical air bubbles through liquids contained in vertical tubes. Chem. Engng Sci. 17 (5), 351361.Google Scholar
Znaien, J., Moisy, F. & Hulin, J.P. 2011 Flow structure and momentum transport buoyancy driven mixing flows in long tubes at different tilt angles. Phys. Fluids 23, 035105.CrossRefGoogle Scholar
Zukoski, E.E. 1966 Influence of viscosity, surface tension, and inclination angle on motion of long bubbles in closed tubes. J. Fluid Mech. 25 (4), 821837.CrossRefGoogle Scholar
Figure 0

Figure 1. Shape of an elongated gas bubble propagating in an inviscid fluid in a horizontal pipe.

Figure 1

Figure 2. Experimental set-up to measure the dynamics of elongated gas bubbles in inclined pipes. 1: pipe; 2: precision toothed rack; 3: valve; 4: diode; 5: test section with the optical box and the optical set-up (camera and particle image velocimetry); 6: test section with the optical box and camera.

Figure 2

Table 1. Fluid properties at $20\,^{\circ }$C of the water–Breox mixtures used in this work.

Figure 3

Figure 3. Test section with the optical box and the optical set-up of coupled shadowgraphy and PIV imaging. 1: PIV camera; 2: shadowgraphy camera; 3: shadowgraphy collimated light source; 4: PIV laser sheet; 5: parallelepipedic box; 6: pipe.

Figure 4

Figure 4. Froude number based on experimental terminal velocities vs pipe inclination for draining bubbles in liquids of different viscosities in slightly inclined pipes.

Figure 5

Figure 5. Terminal velocities and shapes of elongated bubbles in inclined pipes. Panels show(a) $\mu _L=0.01\ {\rm Pa}\ {\rm s}$, (b) $\mu _L=0.02\ {\rm Pa}\ {\rm s}$, (c) $\mu _L=0.091\ {\rm Pa}\ {\rm s}$ and (d)$\mu _L=0.19\ {\rm Pa}\ {\rm s}$.

Figure 6

Figure 6. Shape of an elongated gas bubble in a horizontal pipe.

Figure 7

Figure 7. Velocity fields and bubble shape flowing in a $1^{\circ }$ pipe inclination at different liquid viscosities;(a) 50 cP, (b) 100 cP and (c) 200 cP.

Figure 8

Figure 8. Vertical profiles of the axial velocity for a $1^{\circ }$ pipe inclination at different liquid viscosities;(a) 50 cP, (b) 100 cP and (c) 200 cP.

Figure 9

Table 2. Flow characteristics of the water–Breox mixtures at a $1^{\circ }$ inclination.

Figure 10

Figure 9. Profiles of elongated bubbles in viscous liquids, $0 < \varXi = \xi /D < 4$; (a) 50 cP and (b) 200 cP.

Figure 11

Figure 10. Froude number ((4.5) and (4.10)) as a function of the water layer height; (a) 50 cP and (b) 200 cP.

Figure 12

Figure 11. (a) Cross-section in the liquid layer; definition of the vertical positions of the interface and gravity centres in each phase and (b) bipolar coordinates.

Figure 13

Figure 12. Terminal velocities of the bubbles recorded by the first set of diodes (referred to as 1-2) and the second set (referred to as 2-3).

Figure 14

Figure 13. Results for the terminal bubble velocity with a $\pm 0.1^\circ$ uncertainty in the pipe inclination angle.

Figure 15

Figure 14. Shadowgraphy images after reconstruction (postprocessing) with a (a) regular LED board and(b) collimated light source.

Figure 16

Figure 15. Postprocessing steps for bubble shadowgraphy images. Here, $\theta = 15^\circ$ and $\mu _L = 0.1\ {\rm Pa}\ {\rm s}$.(a) Reconstructed image of the bubble from unprocessed images, (b) reconstructed image of the bubble from deflated images, (c) binarised bubble image from the deflated bubble image and (d) gas–liquid interface profile extracted from the binarised image.